


使用Flex做出对比杜邦分析图
前段时间让做一个对比的杜邦分析图报表,网上看了看,要么就是特专业的报表工具。所以自己用Flex弄了个,然后交互下数据得了。
杜邦分析体系,大家可以google之。
1.javaScript 调用 Flex
html代码:
<table width="100%" id = "dupontList">
                          <embed src="<%=basePath%>flex/Dupont.swf" width="100%" height="1300" id="dupontFlex"></embed>
                    </table>
js代码: dupontFlex.getFlexDupont('companyIDA','companyIDB','20131011');
js调用 Flex方法 代码如下
加载页面时候调用 init()方法, init方法中的那一段代码为注册一个钩子给js可以调用,js调用的方法名为引号中的方法,
后面没有引号的及是flex中具体的方法名。
<s:Application xmlns:fx="http://ns.adobe.com/mxml/2009"
xmlns:s="library://ns.adobe.com/flex/spark"
xmlns:mx="library://ns.adobe.com/flex/mx" minWidth="955" minHeight="600" width="1318" height="1280"
creationComplete="init()">
import flash.external.ExternalInterface;
public function init():void{
                ExternalInterface.addCallback("getFlexDupont",getFlexDupont);//注册init方法,使js可以调用
 }

 public function getFlexDupont(companyA:String,companyB:String,data:String):void{
     remoDupont.getDupont(companyA,companyB,data);
  }
Flex 调用 java 代码
首先 bin-debug 目录输出选择 web项目的目录就不做说明了
Flex 调用java
remoting-config.xml 配置信息如下
<destination id="remoDupont">
        <properties><source>com.xx.xx.xx.action.CreateChartAction</source></properties>
    </destination>
action方法信息如下
public Map getDupont(String companyA,String companyB,String data)throws SQLException{
        Map map = new HashMap();
        System.out.println("=======------->>>"+data);
        System.out.println(data.split(",").length);
        map.put("Acompany", companyA);
        CreateChartService cService = new CreateChartService();
        //System.out.println(createChartService);
        System.out.println(cService);
        String bac = cService.getDupont(companyA, companyB, data);
        map.put("Bcompany", bac);
        map.put("Aval", "5%");
        map.put("Bval", "26%");
        map.put("Dval", "21%");
        return map;
    }
Flex 调用部分如下
<fx:Declarations>
<!-- 将非可视元素(例如服务、值对象)放在此处 -->
<s:RemoteObject id="remoDupont" destination="remoDupont" endpoint="项目名/messagebroker/amf">
<s:method name="getDupont" result="resultDupont(event)"/>
</s:RemoteObject>
</fx:Declarations>
import mx.rpc.events.ResultEvent;
            [Bindable]
            private var acompany:String;
            [Bindable]
            private var bcompany:String;
            [Bindable]
            private var aval:String;
            [Bindable]
            private var bval:String;
            [Bindable]
            private var dval:String;
            private function resultDupont(event:ResultEvent):void{
                acompany = event.result["Acompany"].toString();
                bcompany = event.result["Bcompany"].toString();
                aval = event.result["Aval"].toString();
                bval = event.result["Bval"].toString();
                dval = event.result["Dval"].toString();
            }
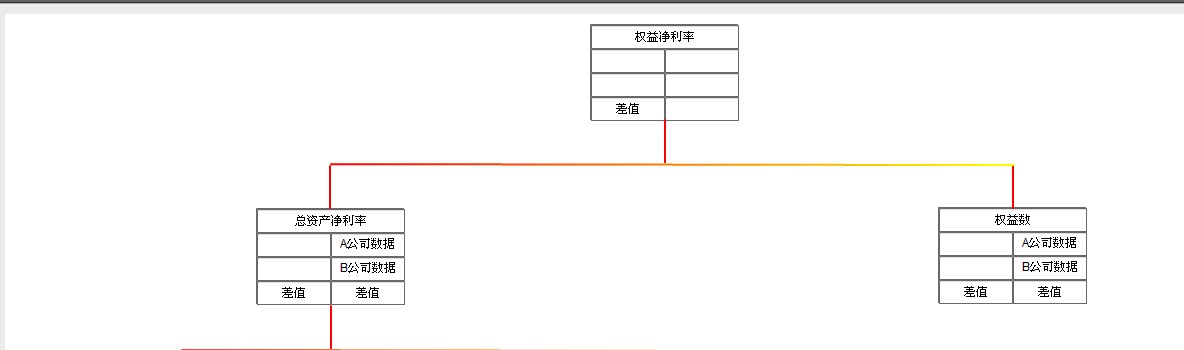
Flex画图部分如下
<s:BorderContainer id="Total" x="585" y="10" width="148" height="96">
        <s:TextArea x="0" y="0" width="148" height="24" text="权益净利率" fontSize="12" textAlign="center"/>
        <s:TextArea x="0" y="24" width="74" height="24" text="{acompany}" fontSize="10" textAlign="center" />
        <s:TextArea x="74" y="24" width="74" height="24" text="{aval}" fontSize="12" textAlign="center"/>
        <s:TextArea x="0" y="48" width="74" height="24" text="{bcompany}" fontSize="10" textAlign="center"/>
        <s:TextArea x="74" y="48" width="74" height="24" text="{bval}" fontSize="12" textAlign="center"/>
        <s:TextArea x="0" y="72" width="74" height="24" text="差值" fontSize="12" textAlign="center"/>
        <s:TextArea x="74" y="72" width="74" height="24" text="{dval}" fontSize="12" textAlign="center"/>
    </s:BorderContainer>
    <s:BorderContainer id="Total1" x="735" y="381" width="148" height="96">
        <s:TextArea x="0" y="0" width="148" height="24" text="总资产周转率" fontSize="12" textAlign="center"/>
        <s:TextArea x="0" y="24" width="74" height="24" text="{acompany}" fontSize="10" textAlign="center" />
        <s:TextArea x="74" y="24" width="74" height="24" text="A公司数据" fontSize="12" textAlign="center"/>
        <s:TextArea x="0" y="48" width="74" height="24" text="{bcompany}" fontSize="10" textAlign="center"/>
        <s:TextArea x="74" y="48" width="74" height="24" text="B公司数据" fontSize="12" textAlign="center"/>
        <s:TextArea x="0" y="72" width="74" height="24" text="差值" fontSize="12" textAlign="center"/>
        <s:TextArea x="74" y="72" width="74" height="24" text="差值" fontSize="12" textAlign="center"/>
    </s:BorderContainer>
    <s:BorderContainer id="Total2" x="933" y="193" width="148" height="96">
        <s:TextArea x="0" y="0" width="148" height="24" text="权益数" fontSize="12" textAlign="center"/>
        <s:TextArea x="0" y="24" width="74" height="24" text="{acompany}" fontSize="10" textAlign="center" />
        <s:TextArea x="74" y="24" width="74" height="24" text="A公司数据" fontSize="12" textAlign="center"/>
        <s:TextArea x="0" y="48" width="74" height="24" text="{bcompany}" fontSize="10" textAlign="center"/>
        <s:TextArea x="74" y="48" width="74" height="24" text="B公司数据" fontSize="12" textAlign="center"/>
        <s:TextArea x="0" y="72" width="74" height="24" text="差值" fontSize="12" textAlign="center"/>
        <s:TextArea x="74" y="72" width="74" height="24" text="差值" fontSize="12" textAlign="center"/>
    </s:BorderContainer>

<!-- 画一个红色的直线 -->
    <s:Line width="0" x="660" y="106"  height="42">
        <s:stroke>
            <s:SolidColorStroke color="0xff0000" weight="2"/>
        </s:stroke>
    </s:Line>
<!-- 画一个颜色渐变的直线 -->
    <s:Line width="683" x="326" y="150"  height="1">
        <s:stroke>
            <s:LinearGradientStroke weight="2">
                <s:GradientEntry color="#ff0000"/>
                <s:GradientEntry color="#ffff00"/>
            </s:LinearGradientStroke>
        </s:stroke>
    </s:Line>
    <s:Line width="633" x="177" y="336"  height="1">
        <s:stroke>
            <s:LinearGradientStroke weight="2">
                <s:GradientEntry color="#ff0000"/>
                <s:GradientEntry color="#ffff00"/>
            </s:LinearGradientStroke>
        </s:stroke>
    </s:Line>
效果图如下
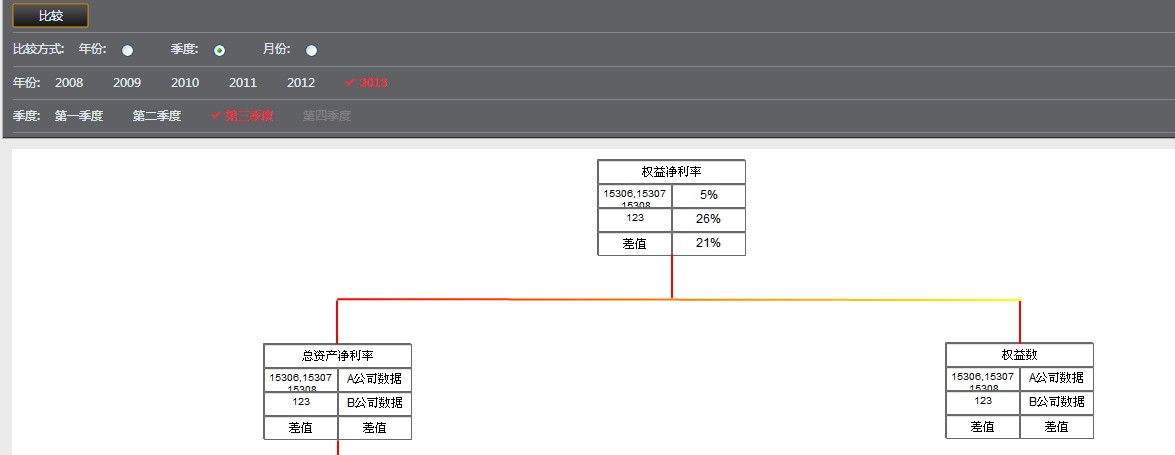
- -~~~突然发现表达能力是渣渣。

 浙公网安备 33010602011771号