

完整教程:MongoDB源码分析慢日志:从配置到实现的完整解析
一、MongoDB 慢日志基础配置:Profiling 操作指南
mongodb对慢日志怎么做的呢?一般教程会这样指导:
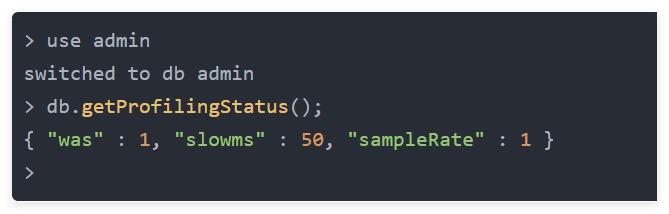
1.1 查看当前 Profiling 状态
> use admin
switched to db admin
> db.getProfilingStatus();
{ "was" : 0, "slowms" : 100, "sampleRate" : 1 }
1.2 MongoDB Profiling 核心级别(0/1/2 级)说明
MongoDB 的 Profiling 有was三个级别:0:关闭 Profiling(默认);1:记录执行时间超过 slowms 阈值的操作;2:记录所有操作(谨慎使用,可能产生大量日志)。
1.3 启动参数配置 Profiling
启动脚本增加--slowms 50 --profile 1参数
>mongod --dbpath C:\me\studyhome\mongodb\mongo-r4.0.7\data -vvvvv --slowms 50 --profile 11.4 Profiling 配置后的验证方法
再次验证 Profiling 级别
二、MongoDB 慢日志底层实现机制拆解
2.1 会话状态流转与命令传递流程
mongo/transport/service_state_machine.cpp已经分析startSession创建ASIOSession过程,并且验证connection是否超过限制ASIOSession和connection是循环接受客户端命令,状态转变流程是:State::Created 》 State::Source 》State::SourceWait 》 State::Process 》 State::SinkWait 》 State::Source 》State::SourceWait。
State::Process将命令发送给mongodb数据库,数据库执行命令find。
2.2 handleRequest 核心方法执行逻辑(service_entry_point_common.cpp)
session接受到客户端发送的命令Msg,把接受到的Msg信息发送给mongodb数据库执行DbResponse dbresponse = ServiceEntryPointMongod->handleRequest()
/mongo/db/service_entry_point_common.cpp中的handleRequest方法代码:
DbResponse ServiceEntryPointCommon::handleRequest(OperationContext* opCtx,
                                                  const Message& m,
                                                  const Hooks& behaviors) {
   ...
    CurOp& currentOp = *CurOp::get(opCtx);
    {
        stdx::lock_guard lk(*opCtx->getClient());
        // Commands handling code will reset this if the operation is a command
        // which is logically a basic CRUD operation like query, insert, etc.
        currentOp.setNetworkOp_inlock(op);
        currentOp.setLogicalOp_inlock(networkOpToLogicalOp(op));
    }
    OpDebug& debug = currentOp.debug();
    boost::optional slowMsOverride;
    bool forceLog = false;
    DbResponse dbresponse;
    if (op == dbMsg || (op == dbQuery && isCommand)) {
        dbresponse = receivedCommands(opCtx, m, behaviors);
    } else if (op == dbQuery) {
        invariant(!isCommand);
        opCtx->markKillOnClientDisconnect();
        dbresponse = receivedQuery(opCtx, nsString, c, m, behaviors);
    } else if (op == dbGetMore) {
        dbresponse = receivedGetMore(opCtx, m, currentOp, &forceLog);
    } else {
        ...
        if (LastError::get(opCtx->getClient()).hadNotMasterError()) {
            notMasterLegacyUnackWrites.increment();
            uasserted(ErrorCodes::NotMaster,
                      str::stream()
                          << "Not-master error while processing '" << networkOpToString(op)
                          << "' operation  on '" << nsString << "' namespace via legacy "
                          << "fire-and-forget command execution.");
        }
    }
    const bool shouldSample = currentOp.completeAndLogOperation(
        opCtx, MONGO_LOG_DEFAULT_COMPONENT, dbresponse.response.size(), slowMsOverride, forceLog);
    Top::get(opCtx->getServiceContext())
        .incrementGlobalLatencyStats(
            opCtx,
            durationCount(currentOp.elapsedTimeExcludingPauses()),
            currentOp.getReadWriteType());
    if (currentOp.shouldDBProfile(shouldSample)) {
        // Performance profiling is on
        if (opCtx->lockState()->isReadLocked()) {
            LOG(1) << "note: not profiling because recursive read lock";
        } else if (c.isInDirectClient()) {
            LOG(1) << "note: not profiling because we are in DBDirectClient";
        } else if (behaviors.lockedForWriting()) {
            // TODO SERVER-26825: Fix race condition where fsyncLock is acquired post
            // lockedForWriting() call but prior to profile collection lock acquisition.
            LOG(1) << "note: not profiling because doing fsync+lock";
        } else if (storageGlobalParams.readOnly) {
            LOG(1) << "note: not profiling because server is read-only";
        } else {
            invariant(!opCtx->lockState()->inAWriteUnitOfWork());
            profile(opCtx, op);
        }
    }
    recordCurOpMetrics(opCtx);
    return dbresponse;
}
CurOp& currentOp = *CurOp::get(opCtx);记录开始时间,获取当前操作对应curop ;
dbresponse = receivedCommands(opCtx, m, behaviors);执行请求命令
const bool shouldSample = currentOp.completeAndLogOperation(opCtx, MONGO_LOG_DEFAULT_COMPONENT, dbresponse.response.size(), slowMsOverride, forceLog);处理时间差,根据参数判断是否需要记录日志。
profile(opCtx, op)将慢日志记录到db.system.profile中。
2.3 completeAndLogOperation 方法:耗时计算与日志判断
completeAndLogOperation核心方法如下:
bool CurOp::completeAndLogOperation(OperationContext* opCtx,
                                    logger::LogComponent component,
                                    boost::optional responseLength,
                                    boost::optional slowMsOverride,
                                    bool forceLog) {
    // Log the operation if it is eligible according to the current slowMS and sampleRate settings.
    const bool shouldLogOp = (forceLog || shouldLog(component, logger::LogSeverity::Debug(1)));
    const long long slowMs = slowMsOverride.value_or(serverGlobalParams.slowMS);
	LOG(1) << "conca responseLength=" <&) {
                warning(component) << "Unable to gather storage statistics for a slow "
                                      "operation due to interrupt";
            }
        }
        // Gets the time spent blocked on prepare conflicts.
        auto prepareConflictDurationMicros =
            PrepareConflictTracker::get(opCtx).getPrepareConflictDuration();
        _debug.prepareConflictDurationMillis =
            duration_cast(prepareConflictDurationMicros);
        log(component) << _debug.report(opCtx, (lockerInfo ? &lockerInfo->stats : nullptr));
    }
    // Return 'true' if this operation should also be added to the profiler.
    return shouldDBProfile(shouldSample);
}
    bool shouldDBProfile(bool shouldSample = true) {
        // Profile level 2 should override any sample rate or slowms settings.
        if (_dbprofile >= 2)
            return true;
        if (!shouldSample || _dbprofile <= 0)
            return false;
        return elapsedTimeExcludingPauses() >= Milliseconds{serverGlobalParams.slowMS};
    }
serverGlobalParams.slowMS默认值是100,前面mongod启动脚本设置--slowms 50
serverGlobalParams.sampleRate默认值是1.0
2.4 shouldDBProfile:慢日志记录的核心判断逻辑
shouldDBProfile判断是否记录慢日志,profile>=2记录,profile=0不记录,profile=1 & slowms判断是否记录慢日志,前面mongod启动脚本设置--profile 1,所以这个find命令耗时超过50ms,记录到慢日志中。
/mongo/db/server_options.h源代码:
    int defaultProfile = 0;                // --profile
    int slowMS = 100;                      // --time in ms that is "slow"
    double sampleRate = 1.0;               // --samplerate rate at which to sample slow queries
    int defaultLocalThresholdMillis = 15;  // --localThreshold in ms to consider a node local
    bool moveParanoia = false;             // for move chunk paranoia
三、MongoDB 慢日志运行验证与结果分析
运行过程关键日志打印结果:
2025-05-14T21:18:29.292+0800 D1 -        [conn1] conca responseLength=240
2025-05-14T21:18:29.292+0800 D1 -        [conn1] conca serverGlobalParams.slowMS=50
2025-05-14T21:18:29.292+0800 D1 -        [conn1] conca slowMsOverride=(nothing)
2025-05-14T21:18:29.292+0800 D1 -        [conn1] conca _debug.executionTimeMicros=56413
2025-05-14T21:18:29.293+0800 D1 -        [conn1] conca serverGlobalParams.sampleRate=1
2025-05-14T21:18:29.293+0800 D1 -        [conn1] conca shouldSample=1
2025-05-14T21:18:29.293+0800 I  COMMAND  [conn1] command db.user appName: "MongoDB Shell" command: find { find: "user", filter: { age: 28.0 }, sort: { wages: 1.0 }, lsid: { id: UUID("7f72749d-bdaf-4b1c-9ad4-b15ab44b055c") }, $db: "db" } planSummary: IXSCAN { age: 1 } keysExamined:2 docsExamined:2 hasSortStage:1 fromMultiPlanner:1 cursorExhausted:1 numYields:3 nreturned:2 queryHash:A13CF6D8 planCacheKey:FD90BAA0 reslen:240 locks:{ ReplicationStateTransition: { acquireCount: { w: 4 } }, Global: { acquireCount: { r: 4 } }, Database: { acquireCount: { r: 4 } }, Collection: { acquireCount: { r: 4 } }, Mutex: { acquireCount: { r: 1 } } } storage:{ data: { bytesRead: 944, timeReadingMicros: 957 } } protocol:op_msg 56ms
2025-05-14T21:18:29.293+0800 I  -        [conn1] Creating profile collection: db.system.profile
2025-05-14T21:18:29.293+0800 I  STORAGE  [conn1] createCollection: db.system.profile with generated UUID: 05224cf7-a845-41b2-b71d-7e3d899c5757 and options: { capped: true, size: 1048576 }
 浙公网安备 33010602011771号