
自学Zabbix3.5.3-监控项item-zabbix agent 类型所有key
1. 温习
Zabbix server是Zabbix软件的中心进程。
- Server执行polling和trapping来采集数据,评估是否触发触发器,发送报警给用户。它是Zabbix agent和proxy用来报告关于系统可用性和完整性数据的中心组件,Server也可以通过简单服务检查(simple service check)来完成远程网络服务检测。
- Server是所有配置、统计和操作数据的中心存储仓库,也是在所有的监控系统中扮演故障发生时通知管理员的角色
- 基础Zabbix server依据功能不同划分为三个部分,分别为: Zabbix server、web前端及数据库。
- 由于Zabbix的所有的配置信息保存在数据库中,server和web前端可以直接进行操作。比如,通过web前端(或者API)创建一个新的监控项时,它将创建的数据插入数据库。一分钟左右Zabbix server会查询监控项数据表,并将查询的监控项 列表保存在自己的缓存(cache)中。这也是为什么通过Zabbix前端进行的变更将在两分钟左右生效。
Zabbix agent部署在被监控机器上用来监控本地资源和应用(如硬盘、内存、处理器统计等).
- Zabbix agent聚合本地的运行信息并将数据发送给Zabbix server以进一步处理. 一旦出现异常(如硬盘空间满的情况或者服务进行宕掉),Zabbix server将会发送告警给管理员报告本次异常.
- Zabbix agent利用本地系统调用完成统计信息收集,因此它非常的高效。
被动(passive)和主动(active)检查
Zabbix agent提供被动和主动检查方式:
- 被动检查模式中agent应答数据请求,Zabbix server或者proxy询问agent数据,如CPU load, 然后Zabbix agent回送结果给server.
- 主动检查模式处理过程将相对复杂. agent必须首先进行一次请求Zabbix server索取监控项列表,然后发送对应的值给server.
选择是被动还是主动检查,需要在监控性类型中选择’Zabbix agent’或者’Zabbix agent (active)’
- 被动:zabbix server向zabbix agent讨要数据。
- 主动:zabbix agent提交数据给zabbix server。
Zabbix代理(proxy)
- 通常用于替代server完成对多个监控设备收集监控信息并将数据发送给Zabbix server. 所有的收集数据会先存储在代理本地缓存中然后传送给Zabbix server.
- 代理是可选的,不过使用它可以有效的降低在分布式环境中单一的Zabbix server负载. 通过代理去收集收集,server可以有效降低CPU和磁盘I/O消耗.
- Zabbix代理可以出色的完成远程区域、分支机构、没有本地管理员的网络的集中监控.
- Zabbix代理使用独立的数据库
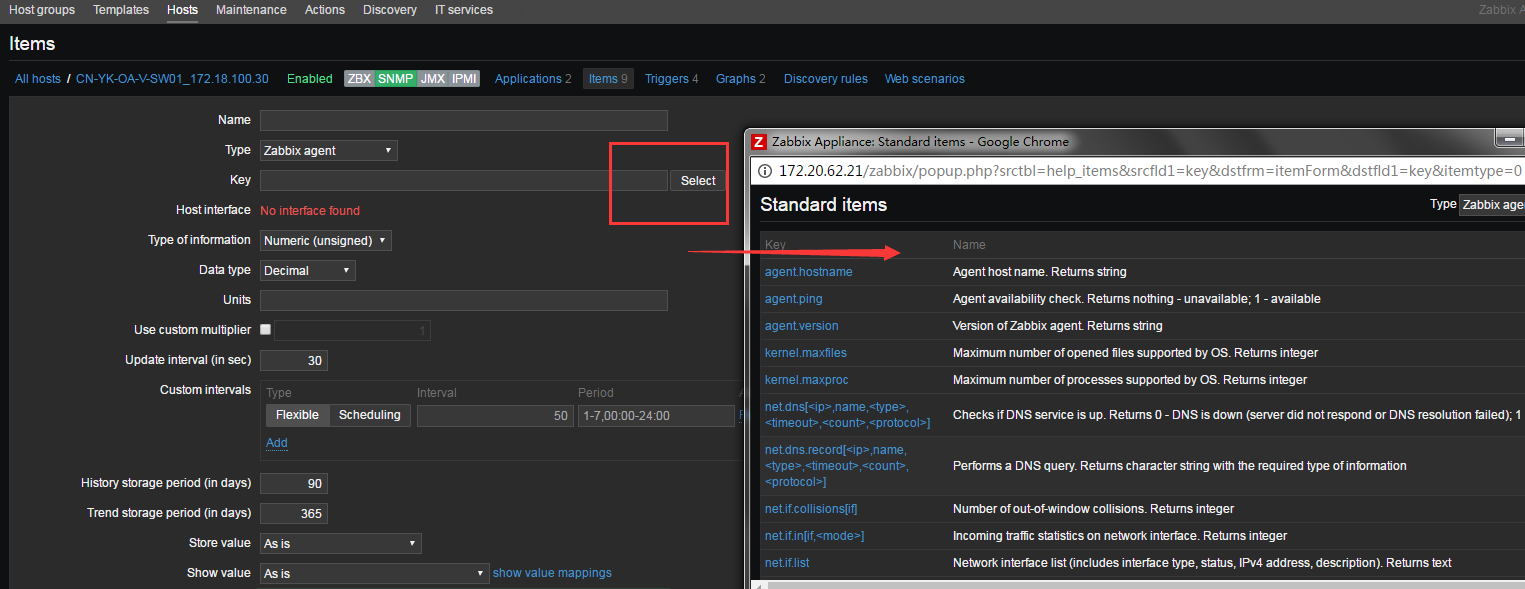
2. 监控项item 所有的key
| Key | Name |
|---|---|
| agent.hostname | Agent host name. Returns string |
| agent.ping | Agent availability check. Returns nothing - unavailable; 1 - available |
| agent.version | Version of Zabbix agent. Returns string |
| kernel.maxfiles | 系统支持的最大opened files. Returns integer |
| kernel.maxproc | 系统支持的最大进程数. Returns integer |
| net.dns[<ip>,name,<type>,<timeout>,<count>,<protocol>] | 检测DNS服务是否开启,0 – DNS挂了 1 – DNS运行中 ip – DNS服务器的ip地址(留空表示使用本地DNS, ignored on Windows) name – 需要测试的域名 type – 记录类型 (默认为 SOA ) 可选项 timeout (ignored on Windows) – 超时时间(默认1秒) count (ignored on Windows) – 重试次数 (默认值2) 示例key:net.dns[8.8.8.8,zabbix.com,MX,2,1] |
| net.dns.record[<ip>,name,<type>,<timeout>,<count>,<protocol>] | 执行一个DNS查询,获取DNS查询记录 ip – DNS服务器的ip地址(留空表示使用本地DNS, ignored on Windows) name – 需要测试的域名 type – 记录类型 (默认为 SOA ) 可选项 timeout (ignored on Windows) – 超时时间(默认1秒) count (ignored on Windows) – 重试次数 (默认值2) 示例key:net.dns.record[8.8.8.8,carlos.com,MX,2,1] |
| net.if.collisions[if] | Number of out-of-window collisions. Returns integer |
| net.if.in[if,<mode>] | 网卡入口流量,返回整数 if – 网卡名称 mode – 可用值如下: bytes – 字节数 (默认) packets – 包数量 errors – 错误数量 dropped – 丢包数量 示例keys: net.if.in[eth0,errors] net.if.in[eth0] |
| net.if.list | Network interface list (includes interface type, status, IPv4 address, description). Returns text |
| net.if.out[if,<mode>] | Outgoing traffic statistics on network interface. Returns integer |
| net.if.total[if,<mode>] | Sum of incoming and outgoing traffic statistics on network interface. Returns integer |
| net.tcp.listen[port] | 检测端口是否开启,0 – 未监听1 – 监听中 port- TCP端口 示例:net.tcp.listen[80] |
| net.tcp.port[<ip>,port] | 是否可以连接到指定的TCP端口,0 – 无法连接1 – 可以连接 ip – IP地址(默认是 127.0.0.1) port – 端口 |
| net.tcp.service[service,<ip>,<port>] | 检测服务是否开启,并且端口可用,0 – 服务挂了1 – 服务运行中 service – 如下: ssh, ntp, ldap, smtp, ftp, http, pop, nntp,imap, tcp, https, telnetip IP地址 (默认127.0.0.1) port – 端口 (默认情况为标准端口号) |
| net.tcp.service.perf[service,<ip>,<port>] | 检测服务器性能,0 – 服务挂了;seconds – 链接到服务器端口消耗的时间 service – 如下: ssh, ntp, ldap, smtp, ftp, http, pop, nntp,imap, tcp, https, telnetip IP地址 (默认127.0.0.1) port – 端口 (默认情况为标准端口号) |
| net.udp.listen[port] | Checks if this UDP port is in LISTEN state. Returns 0 - it is not in LISTEN state; 1 - it is in LISTEN state |
| net.udp.service[service,<ip>,<port>] | Checks if service is running and responding to UDP requests. Returns 0 - service is down; 1 - service is running |
| net.udp.service.perf[service,<ip>,<port>] | Checks performance of UDP service. Returns 0 - service is down; seconds - the number of seconds spent waiting for response from the service |
| perf_counter[counter,<interval>] | |
| proc.cpu.util[<name>,<user>,<type>,<cmdline>,<mode>,<zone>] | Process CPU utilisation percentage. Returns float |
| proc.mem[<name>,<user>,<mode>,<cmdline>,<memtype>] | 用户进程消耗的内存,内存使用量 (字节单位) name – 进程名 (默认值 “all processes”)user – 用户名 (默认值“all users”) mode – 可选值: avg, max, min, sum (默认) cmdline – 命令行过滤(正则表达时) |
| proc.num[<name>,<user>,<state>,<cmdline>] | 某用户某些状态的进程的数量 name – 进程名称 (默认“all processes”)user – 用户名 (默认 “all users”) state – 可用值: all (默认), run,sleep, zomb cmdline – 命令行过滤(正则表达时) |
| proc_info[process,<attribute>,<type>] | Different information about specific process(es). Returns float |
| sensor[device,sensor,<mode>] | 读取硬件传感器 device – 设备名称 sensor – 传感器名称 mode – 可选值: avg,max, min (if this parameter is omitted, device and sensor are treated verbatim).On Linux 2.4, 读取/proc/sys/dev/sensors. |
| service.info[service,<param>] | Information about a service. Returns integer with param as state, startup; string - with param as displayname, path, user; text - with param as description; Specifically for state: 0 - running, 1 - paused, 2 - start pending, 3 - pause pending, 4 - continue pending, 5 - stop pending, 6 - stopped, 7 - unknown, 255 - no such service; Specifically for startup: 0 - automatic, 1 - automatic delayed, 2 - manual, 3 - disabled, 4 - unknown |
| services[<type>,<state>,<exclude>] | Listing of services. Returns 0 - if empty; text - list of services separated by a newline |
| system.boottime | 系统启动时间戳. Returns integer (Unix timestamp) |
| system.cpu.intr | 设备中断. Returns integer |
| system.cpu.load[<cpu>,<mode>] | CPU负载,返回浮点数 cpu – 可用值: all (默认), percpu (所有在线cpu的负载) mode – 可用值: avg1 (1分钟 默认值), avg5(5分钟平均), avg15 (15分钟平均值) 范例system.cpu.load[,avg5] |
| system.cpu.num[<type>] | CPU的数量 |
| system.cpu.switches | 上下文交换次数 |
| system.cpu.util[<cpu>,<type>,<mode>] | CPU的利用率,百分比 cpu – cpu数量 (默认是所有cpu)type – 可用值: idle, nice, user (默认), system (windows系统默认值), iowait, interrupt, softirq,steal mode – 可用值: avg1 (一分钟平均,默认值), avg5(5分钟平均, avg15 (15分钟平均值) |
| system.hostname[<type>] | 系统返回主机名. Returns string |
| system.hw.chassis[<info>] | 返回机架信息. Returns string |
| system.hw.cpu[<cpu>,<info>] | 返回CPU信息. Returns string or integer cpu – cpu数量或者all (默认) info – full (默认), curfreq, maxfreq, model 或者vendor |
| system.hw.devices[<type>] | 列出PCI或者USB,返回文本值 |
| system.hw.macaddr[<interface>,<format>] | 列出MAC地址,返回字符串 interface – all (默认) 或者正则表达式 format – full (默认) 、short |
| system.localtime[<type>] | 系统时间,返回数字或者字符串; utc – (默认) (00:00:00 UTC, January 1, 1970) local – 本地时间格式 ‘yyyy-mm-dd,hh:mm:ss.nnn,+hh:mm’ |
| system.run[command,<mode>] | 在指定的主机上运行命令,返回文本 command – 命令 mode – wait (默认值, 执行超时时间), nowait (不等待) 最大可用返回512KB数据,包含空白数据。命令输出数据必须是文本 例如:system.run[ls -l /]– 列出/的文件和目录. 备注: 启用这个方法, agent配置文件必须配置 EnableRemoteCommands=1选项 |
| system.stat[resource,<type>] | System statistics. Returns integer or float |
| system.sw.arch | 返回软件信息. Returns string |
| system.sw.os[<info>] | 返回系统信息. Returns string |
| system.sw.packages[<package>,<manager>,<format>] | 已安装软件列表. Returns text package – all (默认)或者正则表达式manager – all (默认) or a package manager format – full (默认) ,short |
| system.swap.in[<device>,<type>] | 交换分区IN(磁盘交换到内存),返回数字 device – swap设备 (默认all) type – possible values: count (number of swapouts), sectors(sectors swapped out), pages (pages swapped out). See supported by platformfor details on defaults. |
| system.swap.out[<device>,<type>] | 内存到磁盘. Returns integer device – swap设备 (默认all) type – possible values: count (number of swapouts), sectors(sectors swapped out), pages (pages swapped out). See supported by platformfor details on defaults. |
| system.swap.size[<device>,<type>] | 交换分区大小,字节或者百分比 device – 交换分区 (默认值 all) type – possible values: free (free swap space, default), pfree (free swap space, in percent), pused (used swap space, in percent), total (total swap space), used (used swap space) |
| system.uname | 返回主机相信信息. Returns string |
| system.uptime | 系统运行时长(秒). Returns integer |
| system.users.num | 登陆用户数量. Returns integer |
| vfs.dev.read[<device>,<type>,<mode>] |
磁盘读取状态. 整数(如果type为如下): sectors,operations,bytes 浮点数(如果type为如下): sps, ops,bps |
| vfs.dev.write[<device>,<type>,<mode>] | 磁盘写入状态.整数(如下类型): sectors,operations,bytes 浮点型(如下类型): sps, ops,bps device – 磁盘设备 (默认值 “all”1)type – sectors, operations, bytes, sps, ops, bps (must specify exactly which parameter to use, since defaults are different under various OSes). sps, ops, bps means: sectors, operations, bytes per second respectively mode – one of avg1 (default),avg5 (average within 5 minutes), avg15. Note: The third parameter is supported only if the type is in: sps, ops, bps. |
| vfs.file.cksum[file] | 计算文件校验, calculated by the UNIX cksum algorithm. Returns integer 例如:vfs.file.cksum[/etc/passwd] 返回值: 1938292000 |
| vfs.file.contents[file,<encoding>] | 获取文本内容. Returns text file – 文件完整路径 例如:vfs.file.contents[/etc/passwd] |
| vfs.file.exists[file] | 检测文件是否存在,1 – 文件/硬链接/软连接文件存在 0 – 不存在 file – 文件完整路径 例如:vfs.file.exists[/tmp/application.pid] |
| vfs.file.md5sum[file] | 文件MD5校验码. 文件MD5哈希值 file – 完整路径 示例:vfs.file.md5sum[/usr/local/etc/zabbix_agentd.conf] 返回值b5052decb577e0fffd622d6ddc017e82 |
| vfs.file.regexp[file,regexp,<encoding>,<start line>,<end line>,<output>] | 文件中搜索字符串,包含字符串的行,或者为空 file – 文件完整路径regexp – GNU正则表达encoding – 编码 |
| vfs.file.regmatch[file,regexp,<encoding>,<start line>,<end line>] |
文件中搜索字符串,0表示未找到1表示找到 |
| vfs.file.size[file] | File size (in bytes). Returns integer |
| vfs.file.time[file,<mode>] | File time information. Returns integer (Unix timestamp) |
| vfs.fs.inode[fs,<mode>] | inode数量,返回数字; float for percentage fs – 文件系统 mode – total (默认), free, used, pfree (空闲百分比), pused (使用百分比) |
| vfs.fs.size[fs,<mode>] | 磁盘大小,返回字节; float for percentage fs – 文件系统 mode – total (默认), free, used, pfree (空闲百分比), pused (使用百分比) 返回本地文件系统的使用量 例如: vfs.fs.size[/tmp,free] |
| vm.memory.size[<mode>] | 内存大小,字节或者百分比; float for percentage mode – total (默认), active, anon, buffers, cached, exec, file, free, inactive, pinned, shared, wired, used, pused, available, available其中挑一个 允许三种类型的参数 第一类:包含total – 总内存 第二类: 系统指定内存类型:active, anon, buffers, cached, exec, file, free, inactive,pinned, shared, wired. 第三类:用户级别,一共使用了多少内存,还有多少内存可用: used, pused, available,pavailable. |
| vm.vmemory.size[<type>] | |
| web.page.get[host,<path>,<port>] | 获取网页内容,网页的源代码.返回空字符串表示失败Returns web page source as text host – 主机名 path – html文件路径 (默认值 /) port – 端口 (默认80) 示例:web.page.get[www.carlos.com,/,80] |
| web.page.perf[host,<path>,<port>] | 获取完全加载网页消耗的时间,秒. 返回0表示失败 host – 主机名 path – html文件路径 (默认值 /) port – 端口 (默认80) 示例:web.page.get[www.carlos.com,/,80] |
| web.page.regexp[host,<path>,<port>,<regexp>,<length>,<output>] |
在网页中搜索字符串,失败返回空字符表示不匹配. Returns the matched string, or as specified by the optional output parameter |
| wmi.get[<namespace>,<query>] | Execute WMI query and return the first selected object. Returns integer, float, string or text (depending on the request) |
作者:CARLOS_CHIANG
出处:http://www.cnblogs.com/yaoyaojcy/
本文版权归作者和博客园共有,欢迎转载,但未经作者同意必须保留此段声明,且在文章页面明显位置给出原文链接。
posted on 2017-12-21 14:34 CARLOS_KONG 阅读(1757) 评论(0) 收藏 举报

 浙公网安备 33010602011771号