
日志查询
参考:
查询权限,需要查询哪些,查询的参数怎么来
kubesphere: KubeSphere 愿景是打造一个以 Kubernetes 为内核的 云原生分布式操作系统
参考 - KubeSphere API - 《KubeSphere v3.3 中文文档》 - 书栈网 · BookStack
架构
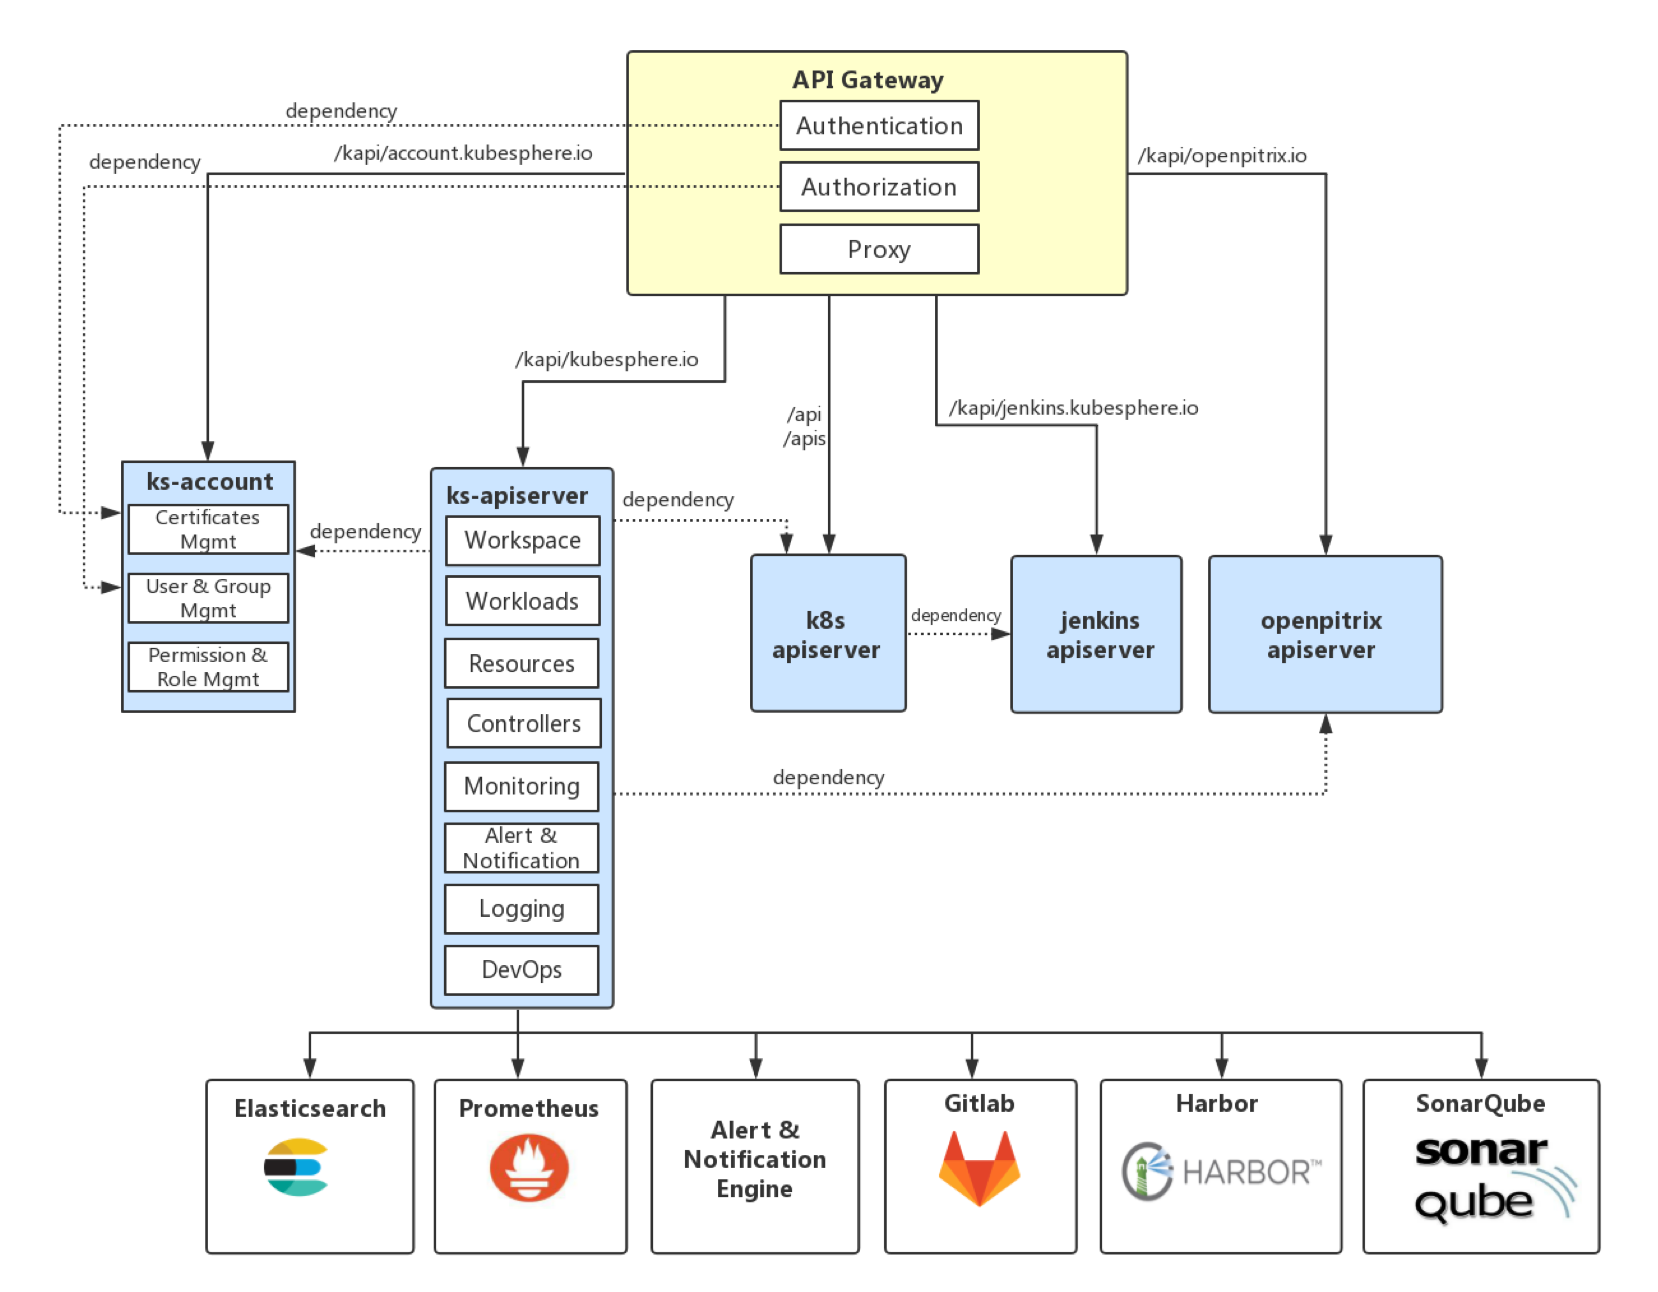
下图是 KubeSphere API 的架构,所有请求都将通过 API Gateway 进行认证授权代理后发送到各个服务组件。
其中 /kapi/xxx.kubesphere.io 是 KubeSphere 拓展聚合的 API,/api 和 /apis 开头的都属于 Kubernetes 原生的 API,KubeSphere 把用户对原生 Kubernetes 资源的请求通过 API Gateway 转发到 Kubernetes API Server 对原生资源进行操作和管理。
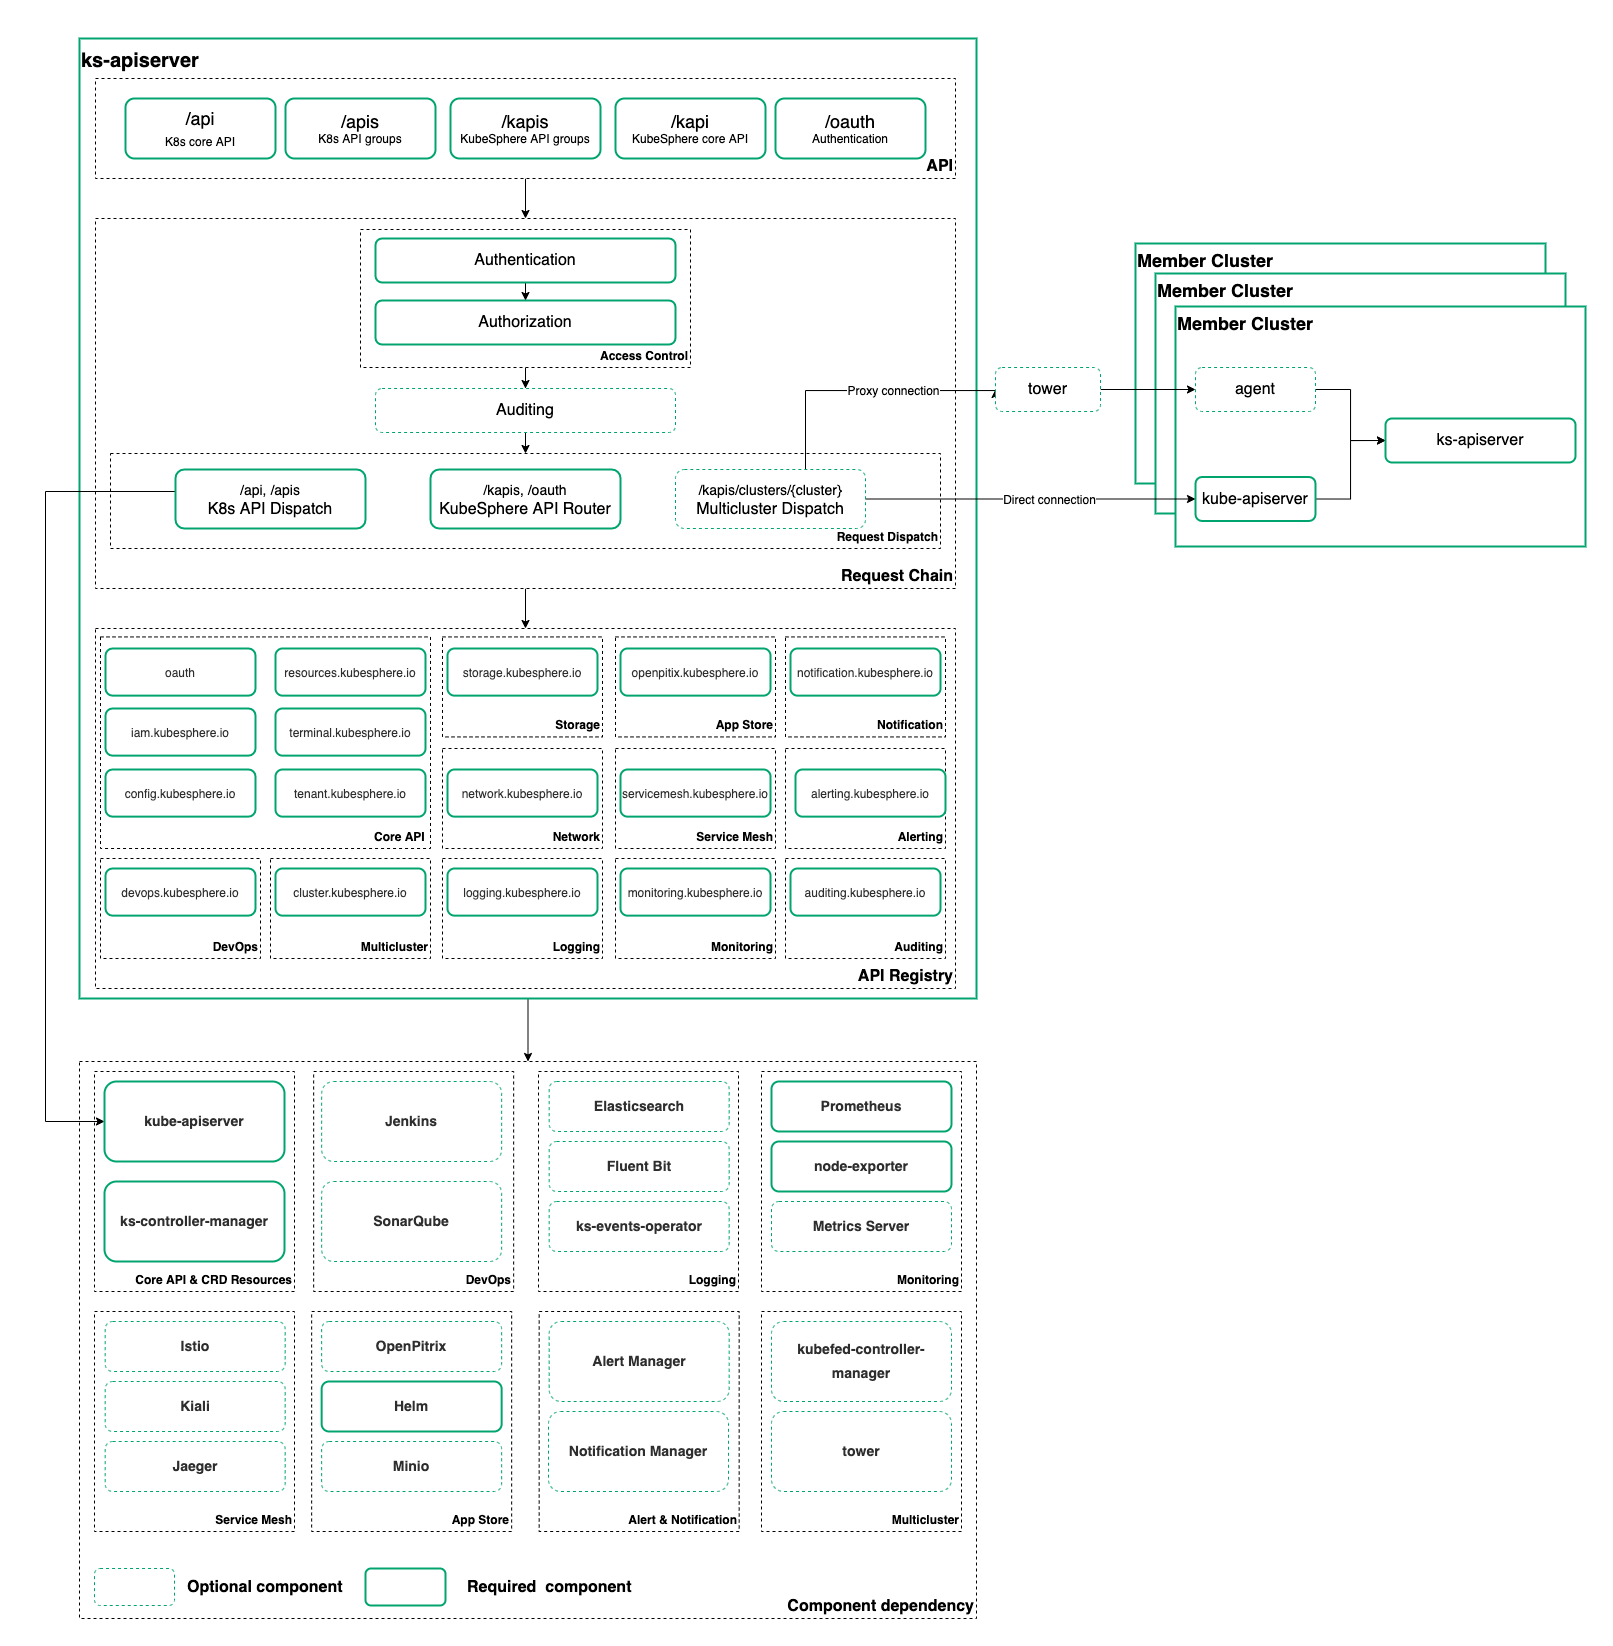
KubeSphere API 服务器为 API 对象验证和配置数据。API 服务器为 REST 操作提供服务,并为集群的共享状态提供前端,其他所有组件通过它进行交互。
其中 /kapi 和/kapis 是 KubeSphere 拓展聚合的 API,/api和 /apis开头的都属于 Kubernetes 原生的 API,KubeSphere 把用户对原生 Kubernetes 资源的请求通过 API Server 转发到 Kubernetes API Server 对原生资源进行操作和管理。
日志查询介绍
应用程序和系统的日志可以帮助您更好地了解集群内部和工作负载内部发生的事情。日志对于排除故障问题和监控集群活动特别有用。
KubeSphere 提供强大且易用的日志系统,从租户的角度为用户提供日志收集、查询和管理的功能。
基于租户的日志系统使不同的租户只能查看自己的日志,安全性更好,相较于 Kibana 更为实用。
此外,KubeSphere 日志系统会过滤掉一些冗余信息,以便用户能够只专注于对自己有用的日志。
KubeSphere 支持对每个集群分别进行日志查询。您可以点击搜索栏左侧的 日志查询 - 图2 切换目标集群。
查询
KubeSphere 默认存储最近七天内的日志。
您可以点击搜索栏并输入搜索条件,可以按照消息、企业空间、项目、资源类型、资源名称、原因、类别或时间范围搜索事件(例如,输入时间范围:最近 10 分钟来搜索最近 10 分钟的事件)。或者,点击时间直方图中的柱状图,KubeSphere 会使用该柱状图的时间范围进行日志查询。
备注
关键字字段支持关键字组合查询。例如,您可以同时使用 Error、Fail、Fatal、Exception 和 Warning 来查询所有异常日志。
关键字字段支持精确匹配和模糊匹配。模糊匹配不区分大小写,并且根据 ElasticSearch 分段规则,通过单词或词组的前半部分来检索完整术语。例如,您可以通过搜索关键字 node_cpu(而不是 cpu)来检索包含 node_cpu_total 的日志。
每个集群都有自己的日志保留期限,可单独设置,您可以在 ClusterConfiguration 中进行修改。有关详细信息
使用搜索参数
-
您可以输入多个条件来缩小搜索结果。
-
点击列表中的任一结果,进入它的详情页面,查看该容器组 (Pod) 的日志,包括右侧的完整内容,便于开发者分析和排除故障。
备注
- 日志查询界面支持每 5 秒、10 秒或 15 秒动态刷新一次。
- 您可以点击右上角的
 将日志导出至本地文件进行进一步分析。
-
在左侧面板中,您可以点击
 切换 Pod 并查看其在同一个项目中的容器,从而查看是否有任何异常 Pod 影响到其他 Pod。
进入详情页面
在左侧面板,您可以点击  查看 Pod 详情页面或容器详情页面。
日志查询
应用日志的收集、分析和监控是日常运维工作中非常关键的部分,妥善地处理应用日志收集也是应用容器化的一个重要主题。KubeSphere 提供了非常强大且易用的日志管理功能比如多租户日志管理、多级别日志查询 (项目/工作负载/容器组/容器以及关键字)、灵活方便的日志收集配置选项等。在 KubeSphere 的日志查询系统中,不同的租户只能看到属于自己的日志信息,而 Kibana 虽然强大,但是它无法区分不同租户的日志,用户只能在整个集群范围内查看和搜索日志,并且 Kibana 中展现的 Kubernetes 日志包含了很多无关的信息。
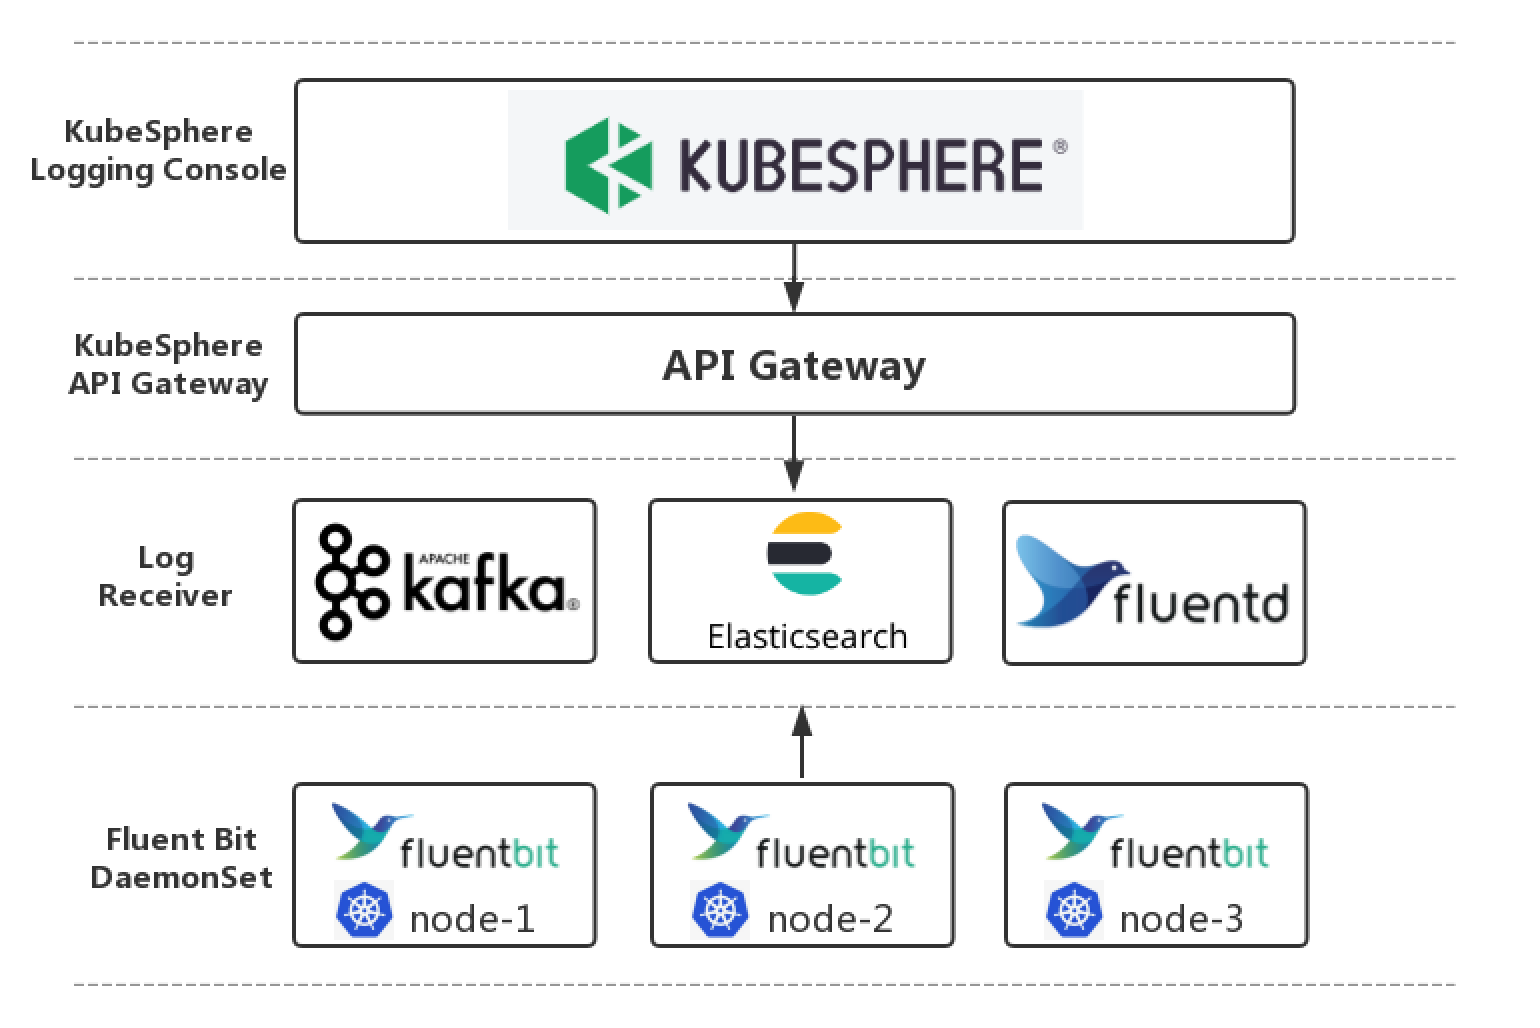
KubeSphere 的日志系统目前是通过 FluentBit Operator 在集群的所有节点上统一部署和配置 Fluent Bit,由 Fluent Bit 进行收集所有容器的日志信息,然后直接传到 Elasticsearch,集群管理员也可以指定 Kafka 或 Fluentd 等存储、消息队列中。
-
FluentBit-operator 以 DaemonSet 方式在每个节点上运⾏⼀个实例,节点物理机的
/var/log/containers目录映射到 FluentBit-operator 容器中。 FluentBit-operator 的 Input 插件 tail 主机映射到容器的 log 日志文件,Output 插件依据配置,将采集到的⽇志信息发送到 ElasticSearch、Kafka 等存储、消息队列中。 -
Elasticsearch 以 StatefulSet 的方式部署在集群中,输出插件依据⽇志信息。在 Elasticsearch 创建对应的 Index (默认是⼀天的日志一个 Index),为 Kubernetes ⽇志创建指定格式的 mapping ,并向其中写⼊日志信息。
-
Elasticsearch Curator 以 CronJob 的形式,定时运行并删除过期的日志信息,删除方式为删除过期的 Index (⼀个 Index 存放⼀天的日志信息),默认存放⽇志的时间⻓度为 1 周,支持修改其默认存放时间。
-
最终的日志信息可通过 KubeSphere 日志查询的可视化界面,提供用户对 Elasticsearch 数据的查询、分析、统计等操作。
日志查询
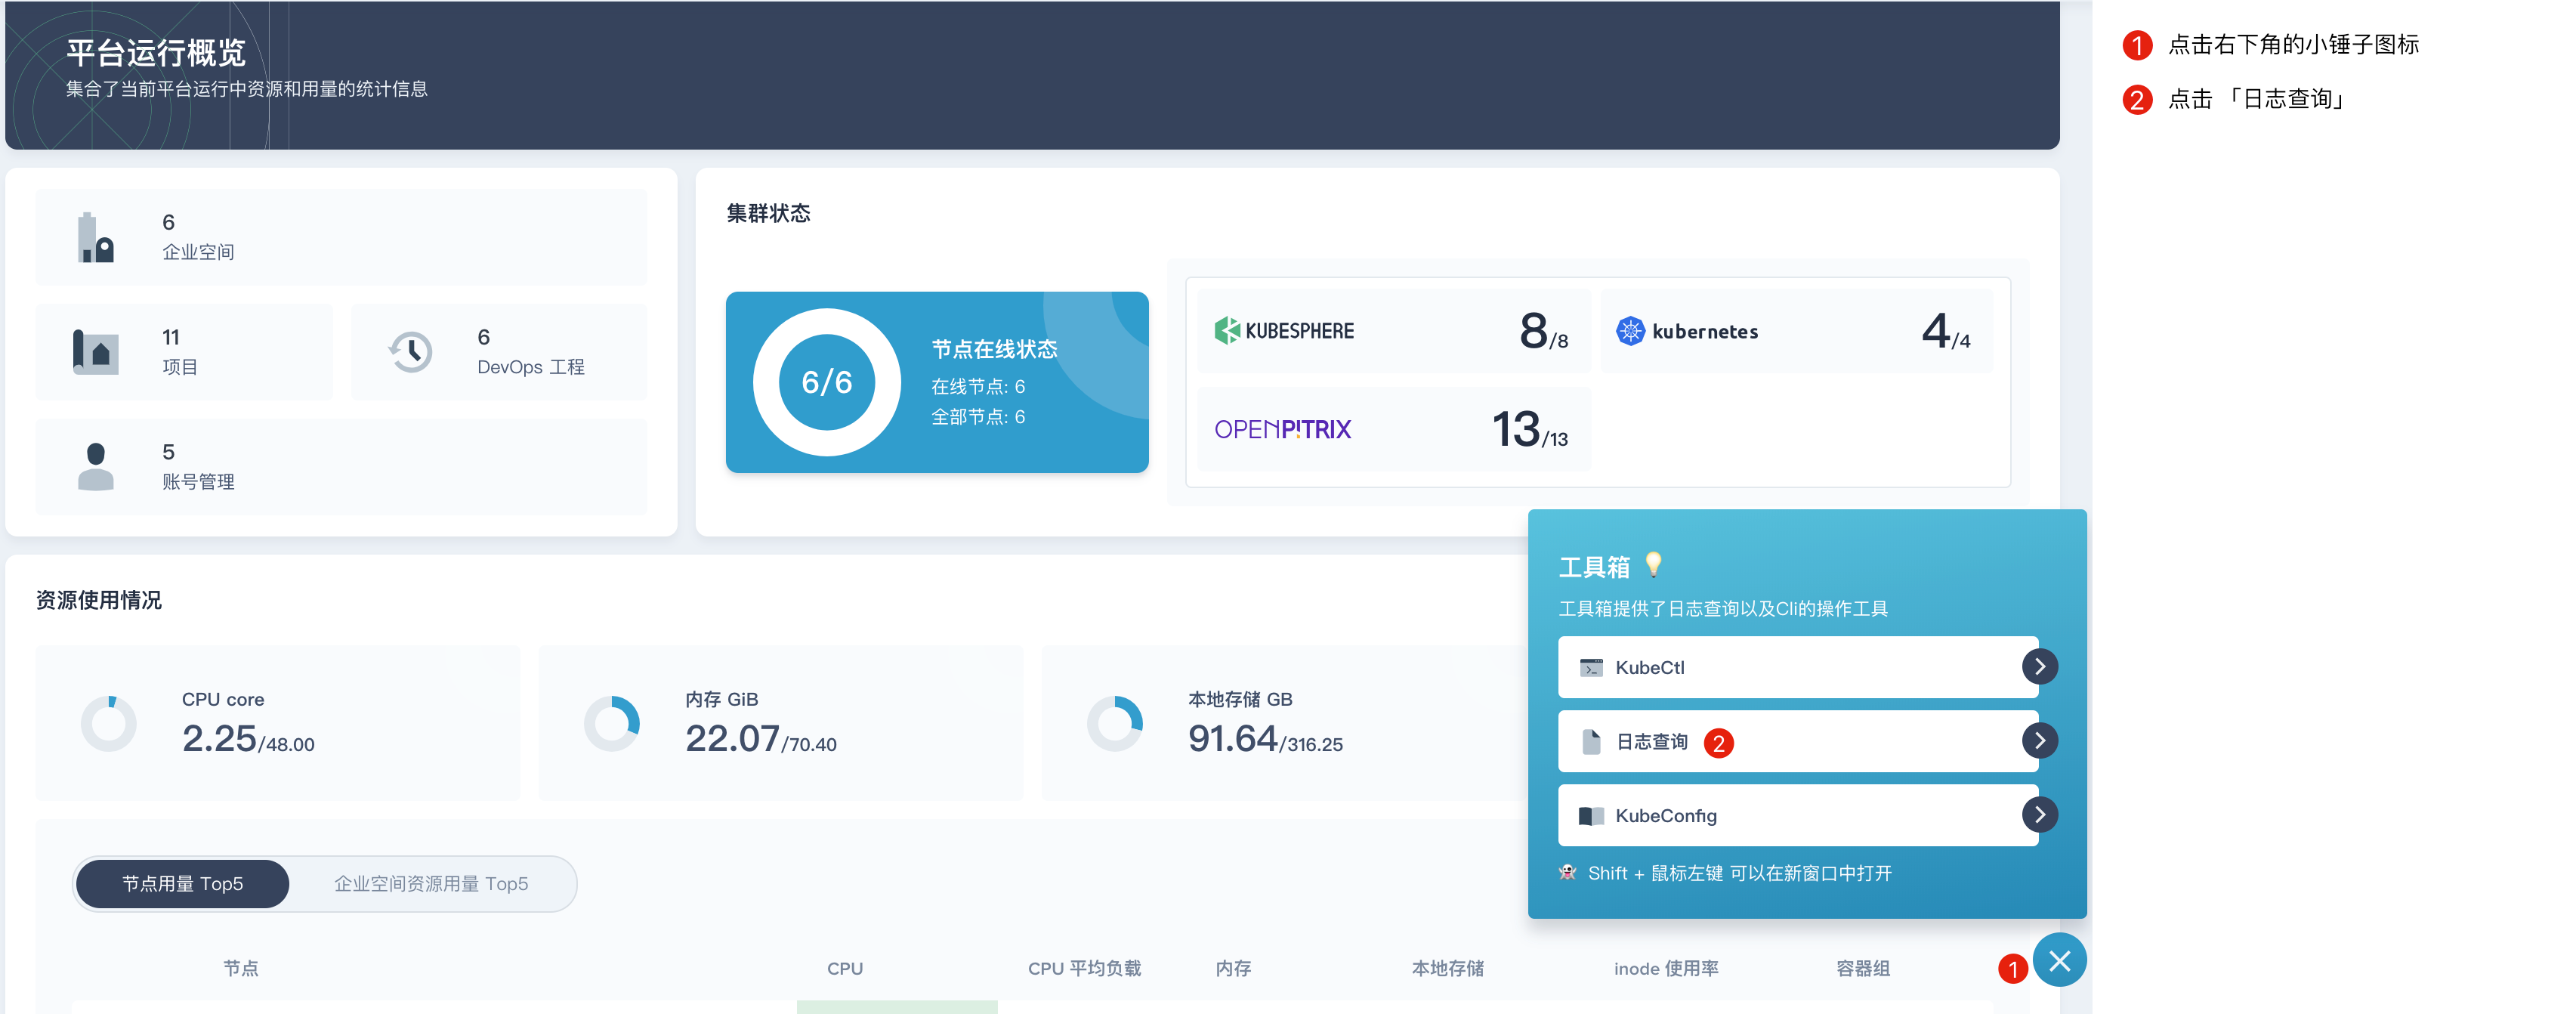
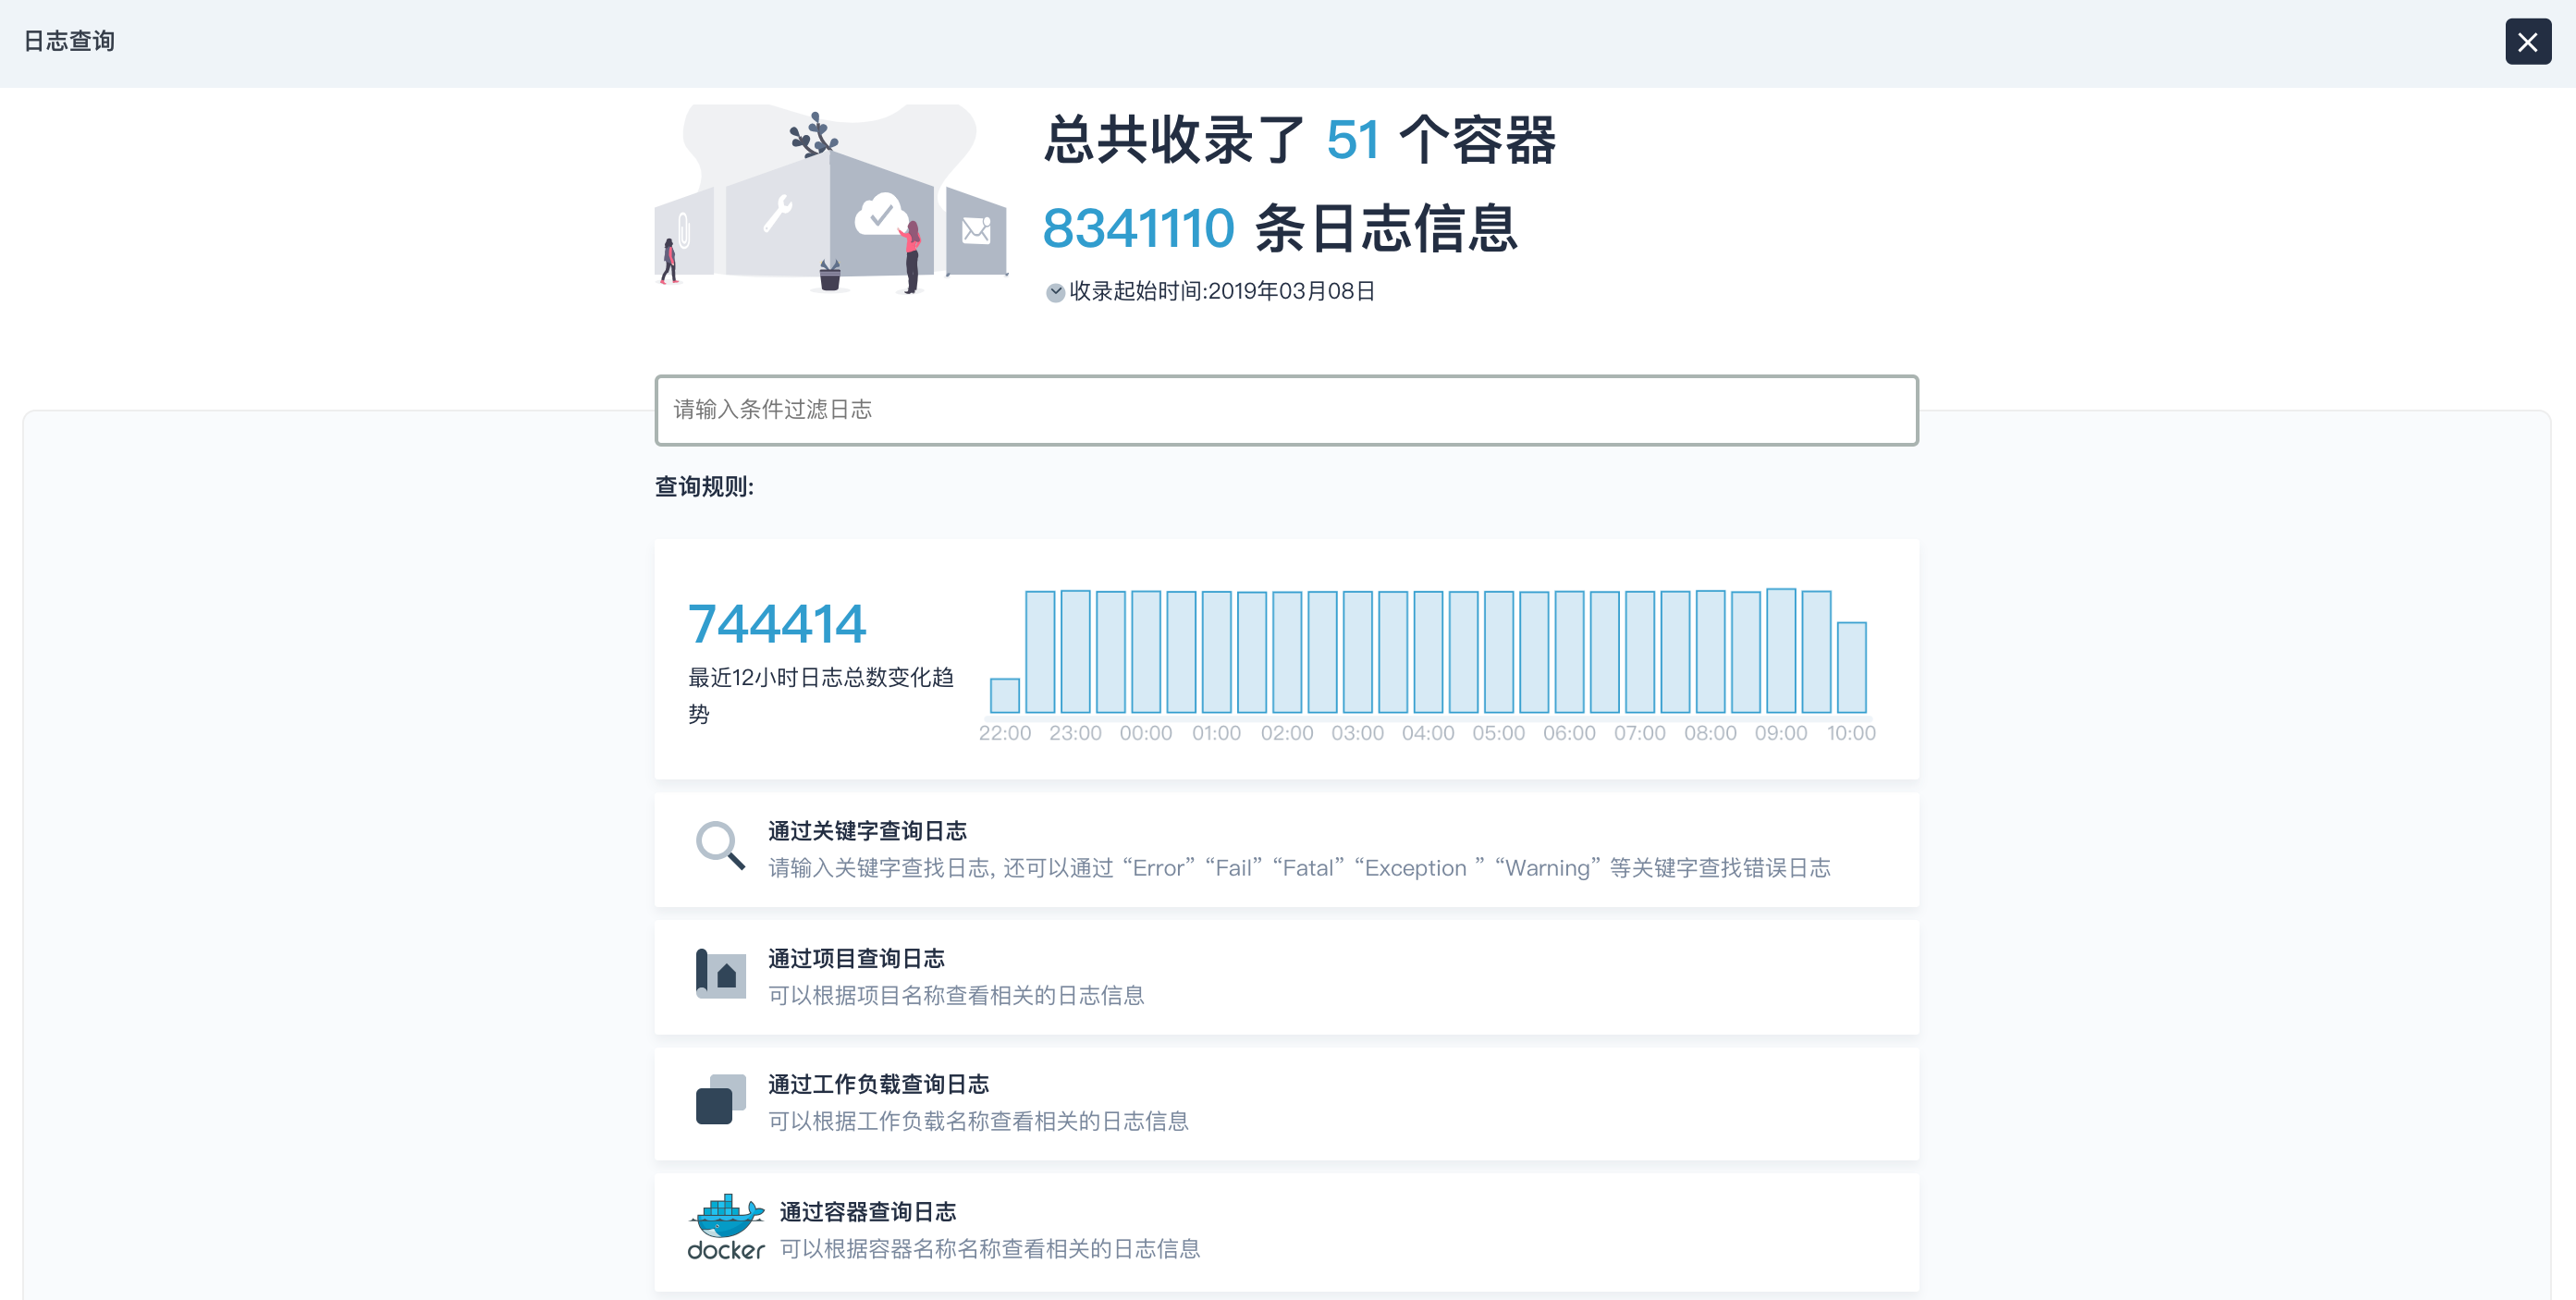
KubeSphere 支持所有用户进行日志查询,登录 KubeSphere 后,点击右下角的小锤子图标,选择 日志查询。
在弹窗的日志查询页面,即可看到搜索框和日志总数的变化趋势。目前支持以下几种查询规则,其中关键字查询可通过 “Error” “Fail” “Fatal” “Exception ” “Warning” 等关键字查找错误日志,查询条件支持组合规则查询,并支持精确匹配和模糊匹配。模糊查询支持大小写模糊匹配,以及通过单词或短语的前半部分检索完整词条(下划线属于单词的一部分)。由于 Elasticsearch 分词的缘故,您可以通过 nodecpu 检索出 nodecpu_totoal,但无法通过 cpu 检索到。
- 关键字
- 项目名称
- 工作负载名称
- 容器组名称
- 容器名称
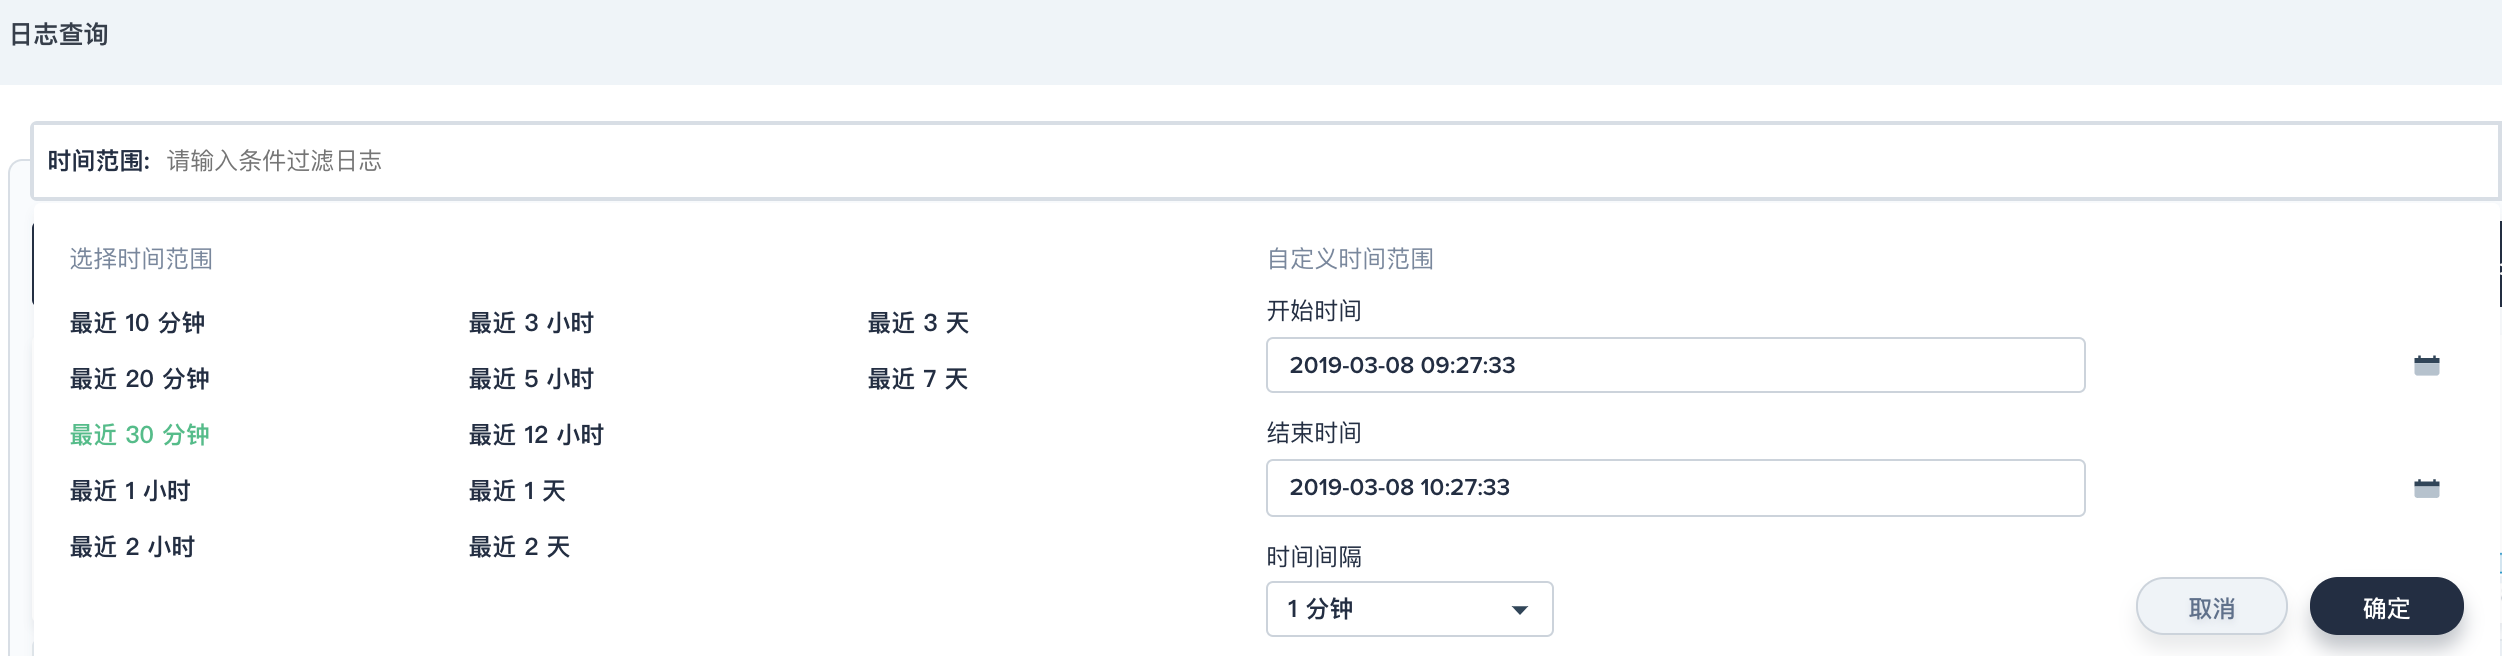
- 时间范围
查询支持自定义时间范围,默认可查询近 7 天的日志信息,也可以修改日志保留的时间。
日志查询示例
例如,查询在最近 1 小时内,kubesphere-system 项目中包含 error 关键字的日志信息,返回了 22 条搜索结果。
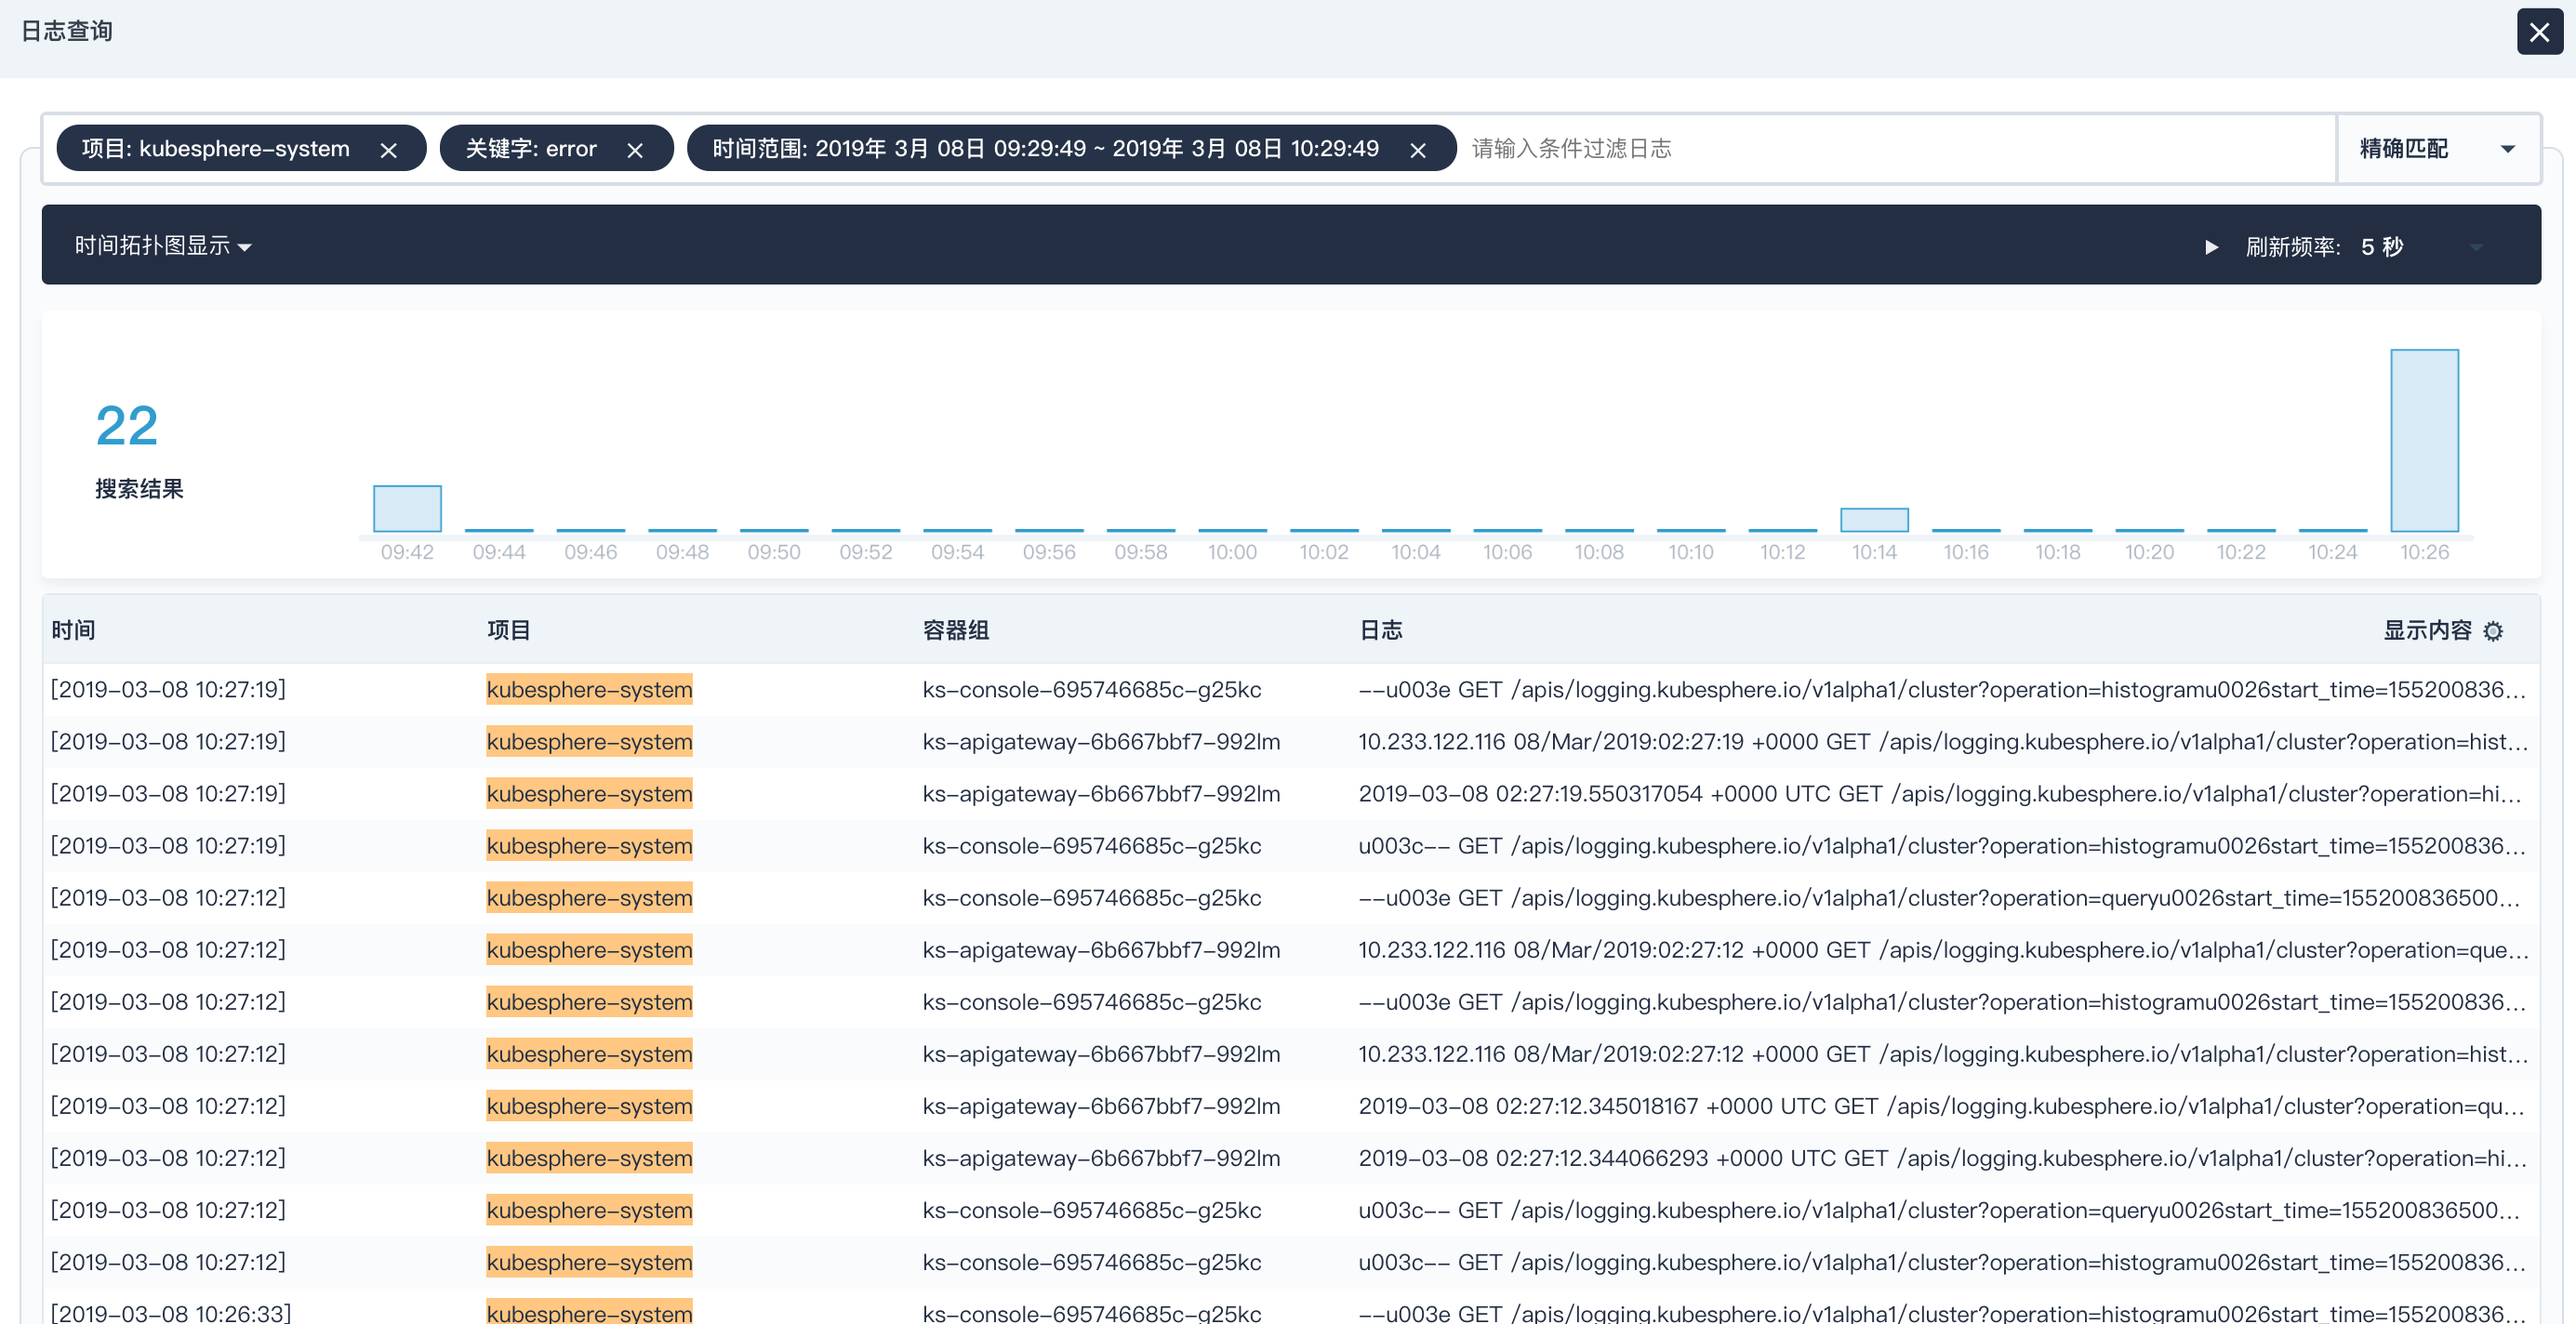
用户可以看到相应日志的收集时间、所属项目、容器组和容器等信息。
点击其中一条日志条目,可查看该项目具体的容器日志信息,包含这条日志相关的上下文信息,用户可以在这个页面查看这条错误发生时所在容器的上下文日志,这里的日志具体信息可以帮助用户快速的定位和分析问题。
提示:日志查询支持动态加载,刷新频率为 5 秒、10 秒或 15 秒。
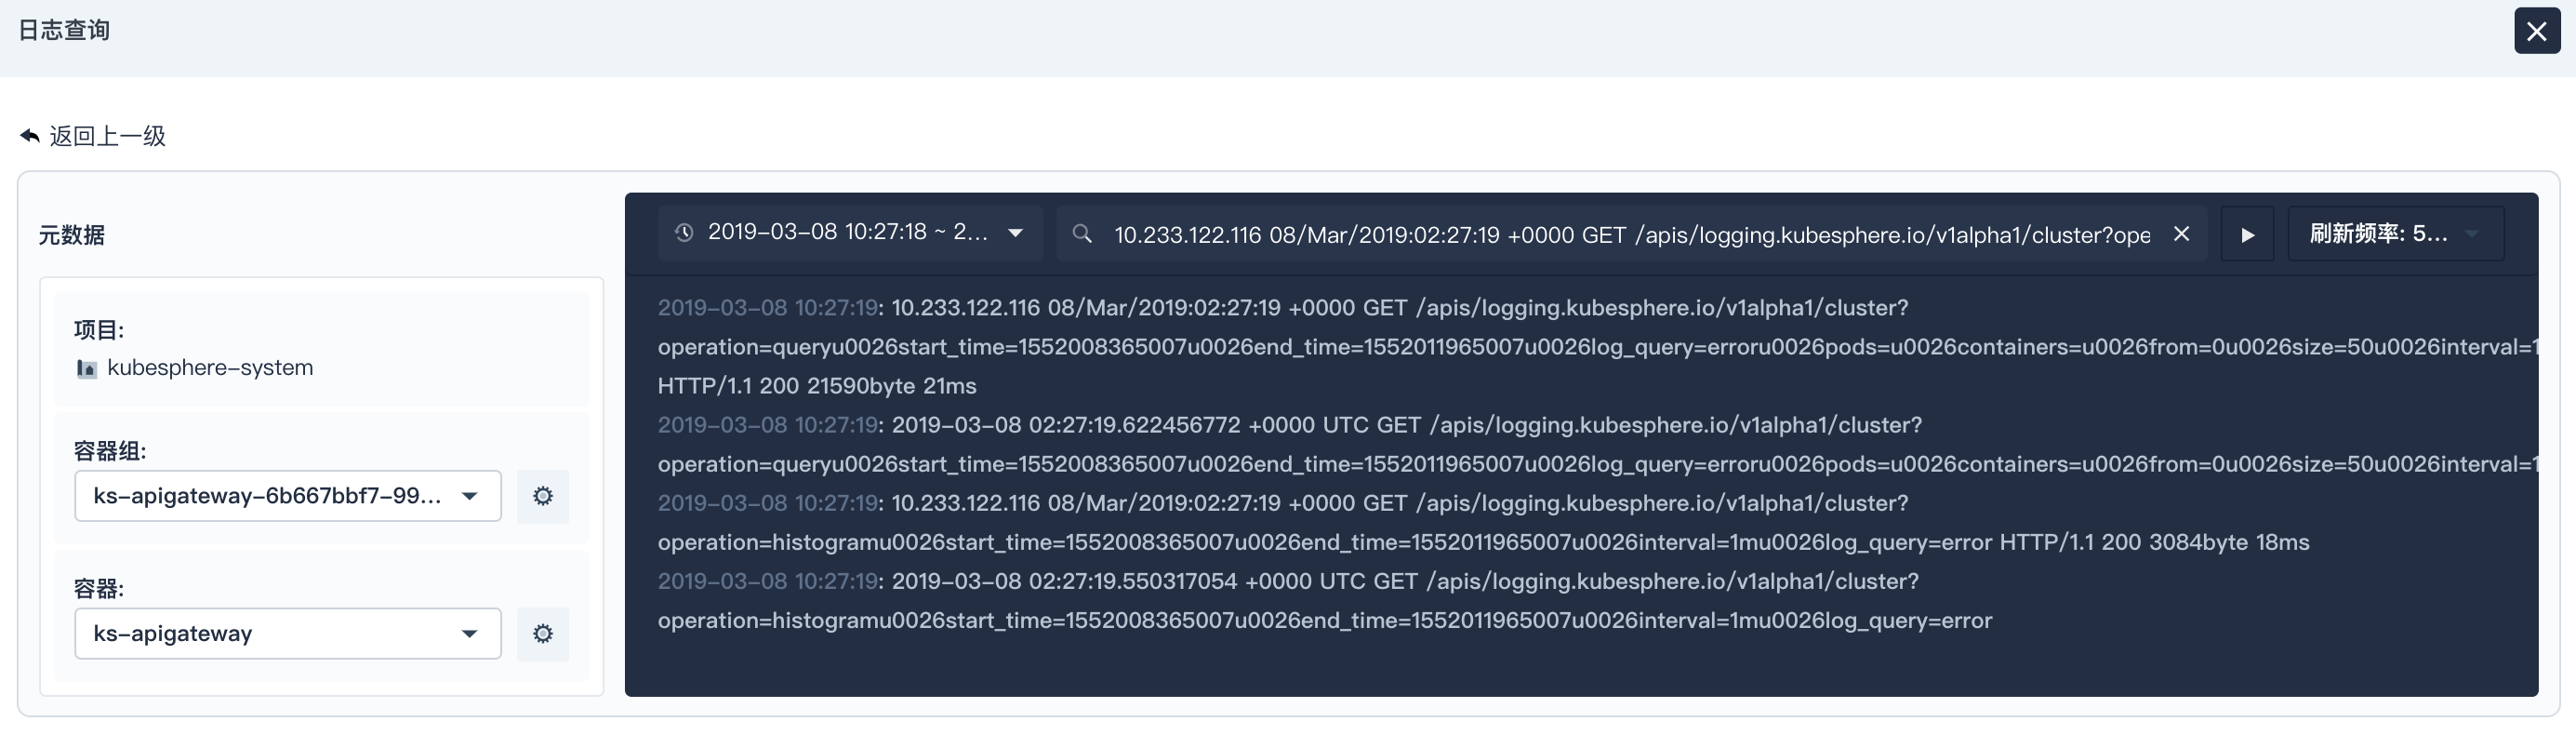
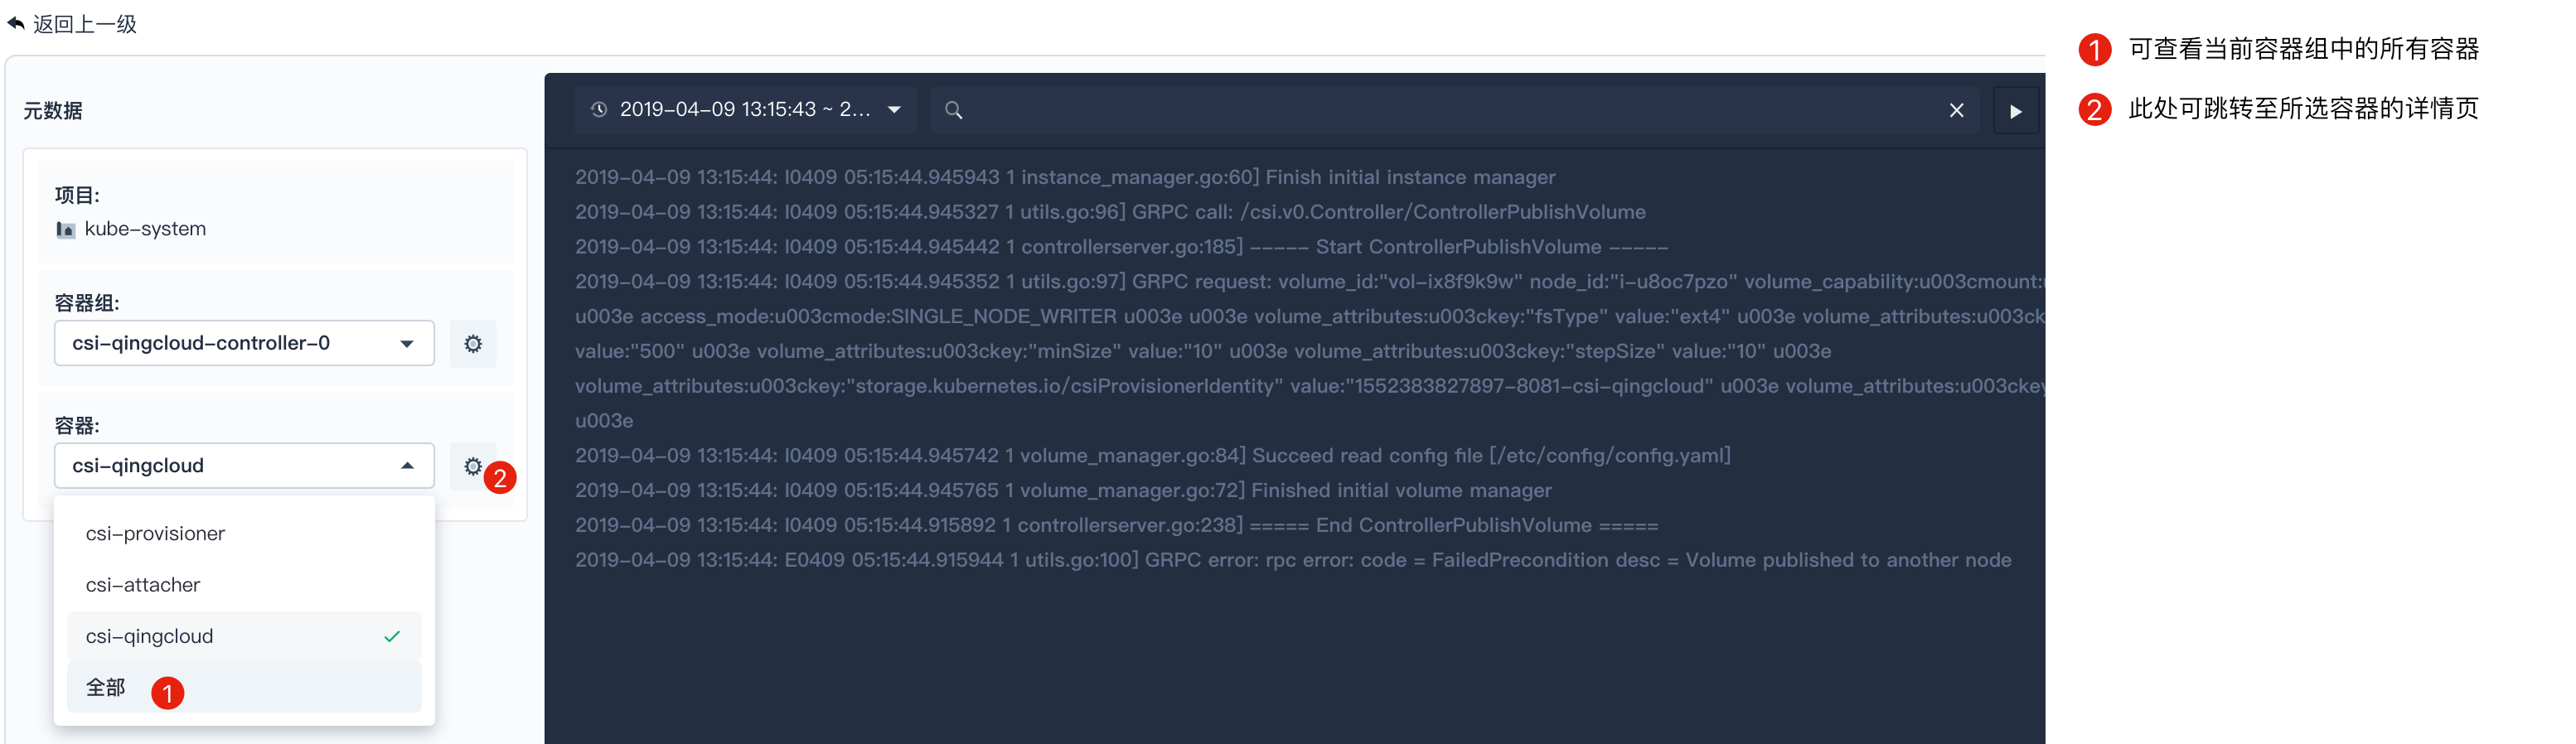
可以看到在日志查询详情页面左侧有元数据的选项。用户可以在容器一栏选择其他容器,或者同一个容器组中的全部容器;还可以选择同一个项目下的其他容器组或所有容器组,这样就可以看到是否其他容器或容器组会对当前错误产生影响了。日志的错误有可能会和 CPU,内存等的用量有关系,比如内存不够。
支持一键定位
若通过日志输出信息发现问题后,用户可以一键跳转容器、容器组、项目的详情页,进一步查看监控信息和资源状态。同时,用户可以在容器的详情页进入容器终端定位问题。
单击项目也可以转到项目页面查看相应监控信息;
点击元信息相应容器/容器组右侧的定位按钮,就可以转到相应的容器/容器组页面。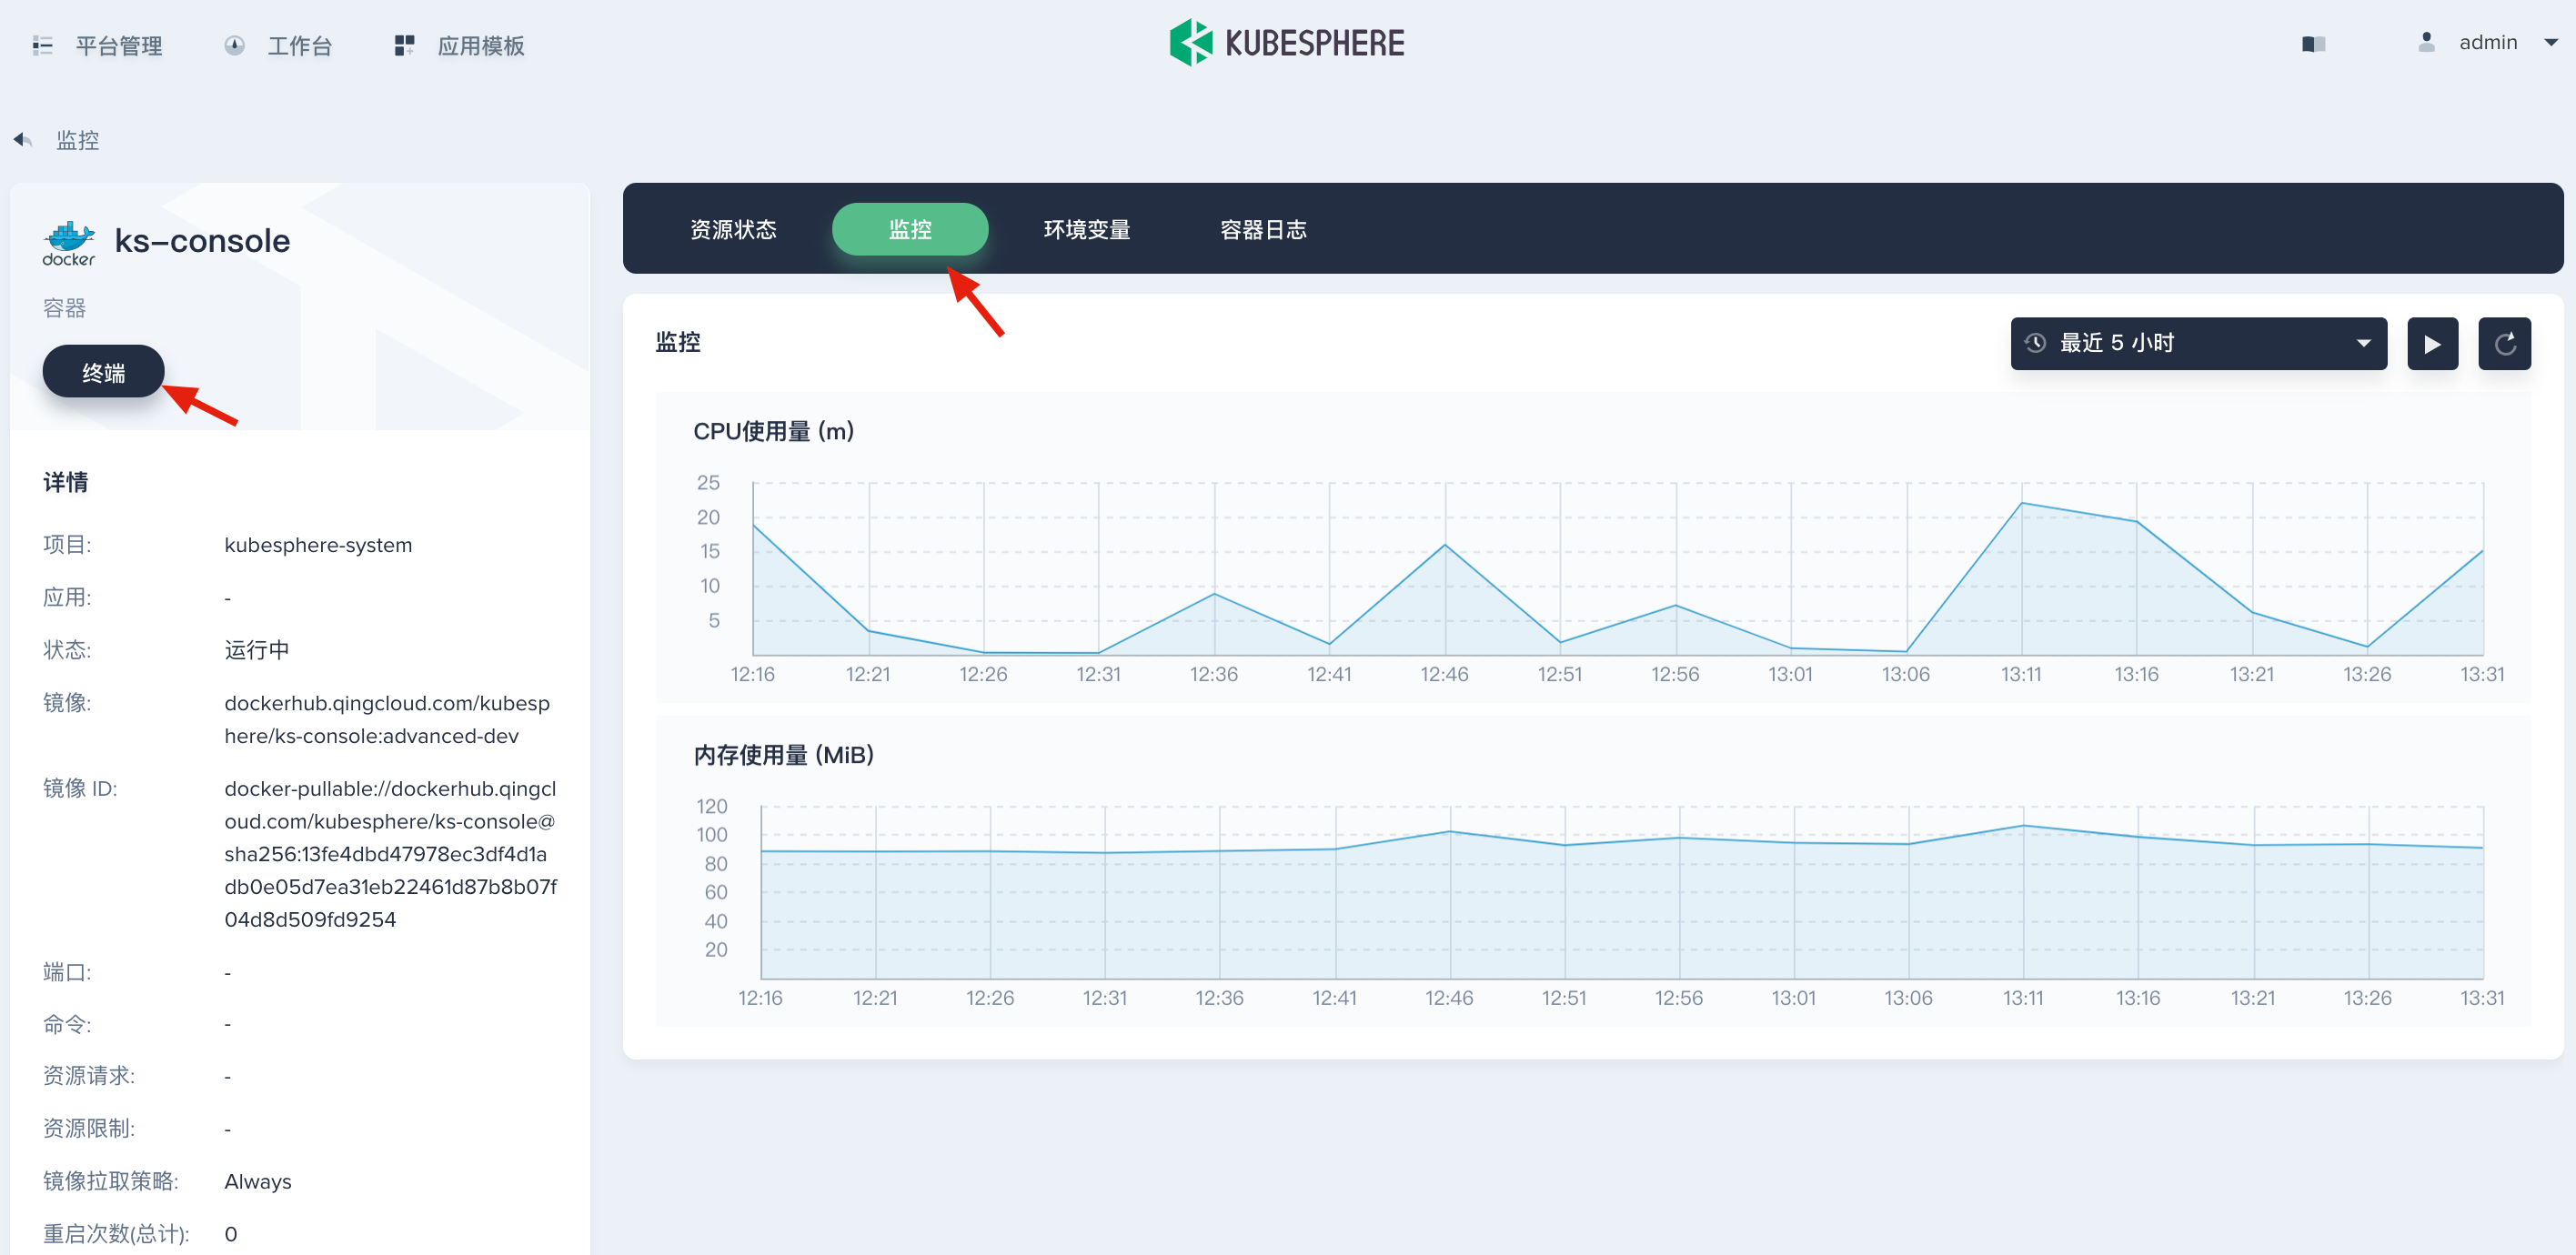
日志查询后端接口
tenant.kubesphere.io.v1alpha2/logs
Log Query
get
operation
string
Default: "query"
Operation type. This can be one of four types: query (for querying logs), statistics (for retrieving statistical data), histogram (for displaying log count by time interval) and export (for exporting logs). Defaults to query.
namespaces
string
A comma-separated list of namespaces. This field restricts the query to specified namespaces. For example, the following filter matches the namespace my-ns and demo-ns: my-ns,demo-ns
namespace_query
string
A comma-separated list of keywords. Differing from namespaces, this field performs fuzzy matching on namespaces. For example, the following value limits the query to namespaces whose name contains the word my(My,MY,...) OR demo(Demo,DemO,...): my,demo.
workloads
string
A comma-separated list of workloads. This field restricts the query to specified workloads. For example, the following filter matches the workload my-wl and demo-wl: my-wl,demo-wl
workload_query
string
A comma-separated list of keywords. Differing from workloads, this field performs fuzzy matching on workloads. For example, the following value limits the query to workloads whose name contains the word my(My,MY,...) OR demo(Demo,DemO,...): my,demo.
pods
string
A comma-separated list of pods. This field restricts the query to specified pods. For example, the following filter matches the pod my-po and demo-po: my-po,demo-po
pod_query
string
A comma-separated list of keywords. Differing from pods, this field performs fuzzy matching on pods. For example, the following value limits the query to pods whose name contains the word my(My,MY,...) OR demo(Demo,DemO,...): my,demo.
containers
string
A comma-separated list of containers. This field restricts the query to specified containers. For example, the following filter matches the container my-cont and demo-cont: my-cont,demo-cont
container_query
string
A comma-separated list of keywords. Differing from containers, this field performs fuzzy matching on containers. For example, the following value limits the query to containers whose name contains the word my(My,MY,...) OR demo(Demo,DemO,...): my,demo.
log_query
string
A comma-separated list of keywords. The query returns logs which contain at least one keyword. Case-insensitive matching. For example, if the field is set to err,INFO, the query returns any log containing err(ERR,Err,...) OR INFO(info,InFo,...).
interval
string
Default: "15m"
Time interval. It requires operation is set to histogram. The format is [0-9]+[smhdwMqy]. Defaults to 15m (i.e. 15 min).
start_time
string
Start time of query. Default to 0. The format is a string representing seconds since the epoch, eg. 1559664000.
end_time
string
End time of query. Default to now. The format is a string representing seconds since the epoch, eg. 1559664000.
sort
string
Default: "desc"
Sort order. One of asc, desc. This field sorts logs by timestamp.
from
integer
Default: 0
The offset from the result set. This field returns query results from the specified offset. It requires operation is set to query. Defaults to 0 (i.e. from the beginning of the result set).
size
integer
Default: 10
Size of result to return. It requires operation is set to query. Defaults to 10 (i.e. 10 log records).
返回
{
  "histogram": {
    "histograms": [
      {
        "count": 0,
        "time": 0
      }
    ],
    "total": 0
  },
  "query": {
    "records": [
      {
        "container": "string",
        "log": "string",
        "namespace": "string",
        "pod": "string",
        "time": "string"
      }
    ],
    "total": 0
  },
  "statistics": {
    "containers": 0,
    "logs": 0
  }
}
查询参数的时间格式必须是 Unix 时间戳(自 Unix Epoch 以来已经过去的秒数)。不再支持使用毫秒。该变更影响 start_time 和 end_time 参数。

 浙公网安备 33010602011771号