

Grafana简介
Grafana是一个跨平台的开源的度量分析和可视化工具,可以通过将采集的数据查询然后可视化的展示,并及时通知。它主要有以下六大特点:
1、展示方式:快速灵活的客户端图表,面板插件有许多不同方式的可视化指标和日志,官方库中具有丰富的仪表盘插件,比如热图、折线图、图表等多种展示方式;
2、数据源:Graphite,InfluxDB,OpenTSDB,Prometheus,Elasticsearch,CloudWatch和KairosDB等;
3、通知提醒:以可视方式定义最重要指标的警报规则,Grafana将不断计算并发送通知,在数据达到阈值时通过Slack、PagerDuty等获得通知;
4、混合展示:在同一图表中混合使用不同的数据源,可以基于每个查询指定数据源,甚至自定义数据源;支持白天和夜间模式;
5、注释:使用来自不同数据源的丰富事件注释图表,将鼠标悬停在事件上会显示完整的事件元数据和标记;
6、过滤器:Ad-hoc过滤器允许动态创建新的键/值过滤器,这些过滤器会自动应用于使用该数据源的所有查询。
Github地址:https://github.com/grafana/grafana
官网地址:https://grafana.com
官网文档地址:http://docs.grafana.org/
Grafana安装
wget https://dl.grafana.com/oss/release/grafana-6.6.2-1.x86_64.rpm
sudo yum install grafana-6.6.2-1.x86_64.rpm
or
rpm -Uvh grafana-6.6.2-1.x86_64.rpm
服务操作:
刚安装完需要重载systemd配置:systemctl daemon-reload
启动服务:systemctl start grafana-server
查看状态:systemctl status grafana-server
设置开机启动: systemctl enable grafana-server.service
Grafana简单使用
1、 centos6
[root@localhost ~]#service grafana-server start
[root@localhost ~]#service grafana-server restart
[root@localhost ~]#service grafana-server status
[root@localhost ~]#/sbin/chkconfig --add grafana-server
2、 centos7
[root@localhost ~]#systemctl daemon-reload
[root@localhost ~]#systemctl start grafana-server
[root@localhost ~]#systemctl stop grafana-server
[root@localhost ~]#systemctl restart grafana-server
[root@localhost ~]#systemctl status grafana-server
启动服务,打开浏览器,输入IP+端口: http://ip:3000,3000为Grafana的默认侦听端口。
系统默认用户名和密码为admin/admin,第一次登陆系统会要求修改密码,修改密码后登陆,界面显示如下:

相关文件位置
1、 访问地址 IP:3000
2、 账号密码 admin/admin
3、 环境文件 /etc/sysconfig/grafana-server
4、 日志文件 /var/log/grafana
5、 数据库 /var/lib/grafana/grafana.db
6、 配置文件 /etc/grafana/grafana.ini
安装包信息:
二进制文件: /usr/sbin/grafana-server init.d
脚本: /etc/init.d/grafana-server
环境变量文件: /etc/sysconfig/grafana-server
配置文件: /etc/grafana/grafana.ini
启动项: grafana-server.service
日志文件:/var/log/grafana/grafana.log
默认配置的sqlite3数据库:/var/lib/grafana/grafana.db
Grafana使用方法
1、添加数据源
首先是添加数据源,点击左上角的grafana图标,示例如下:
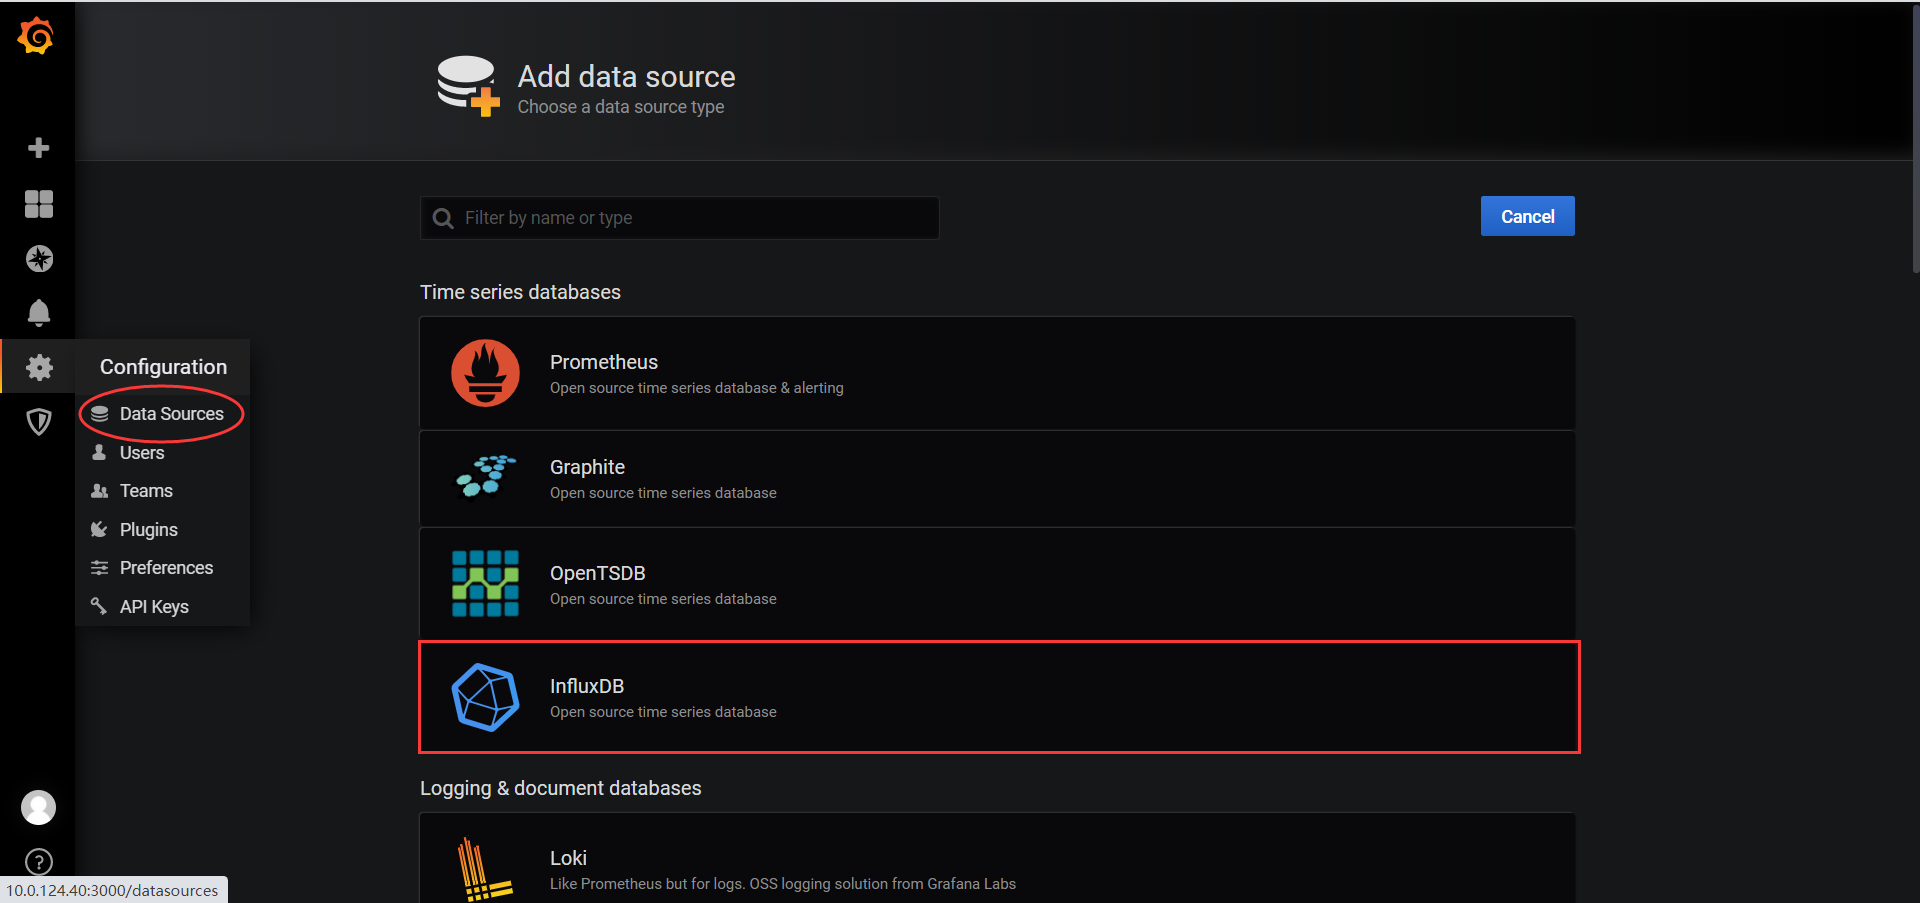
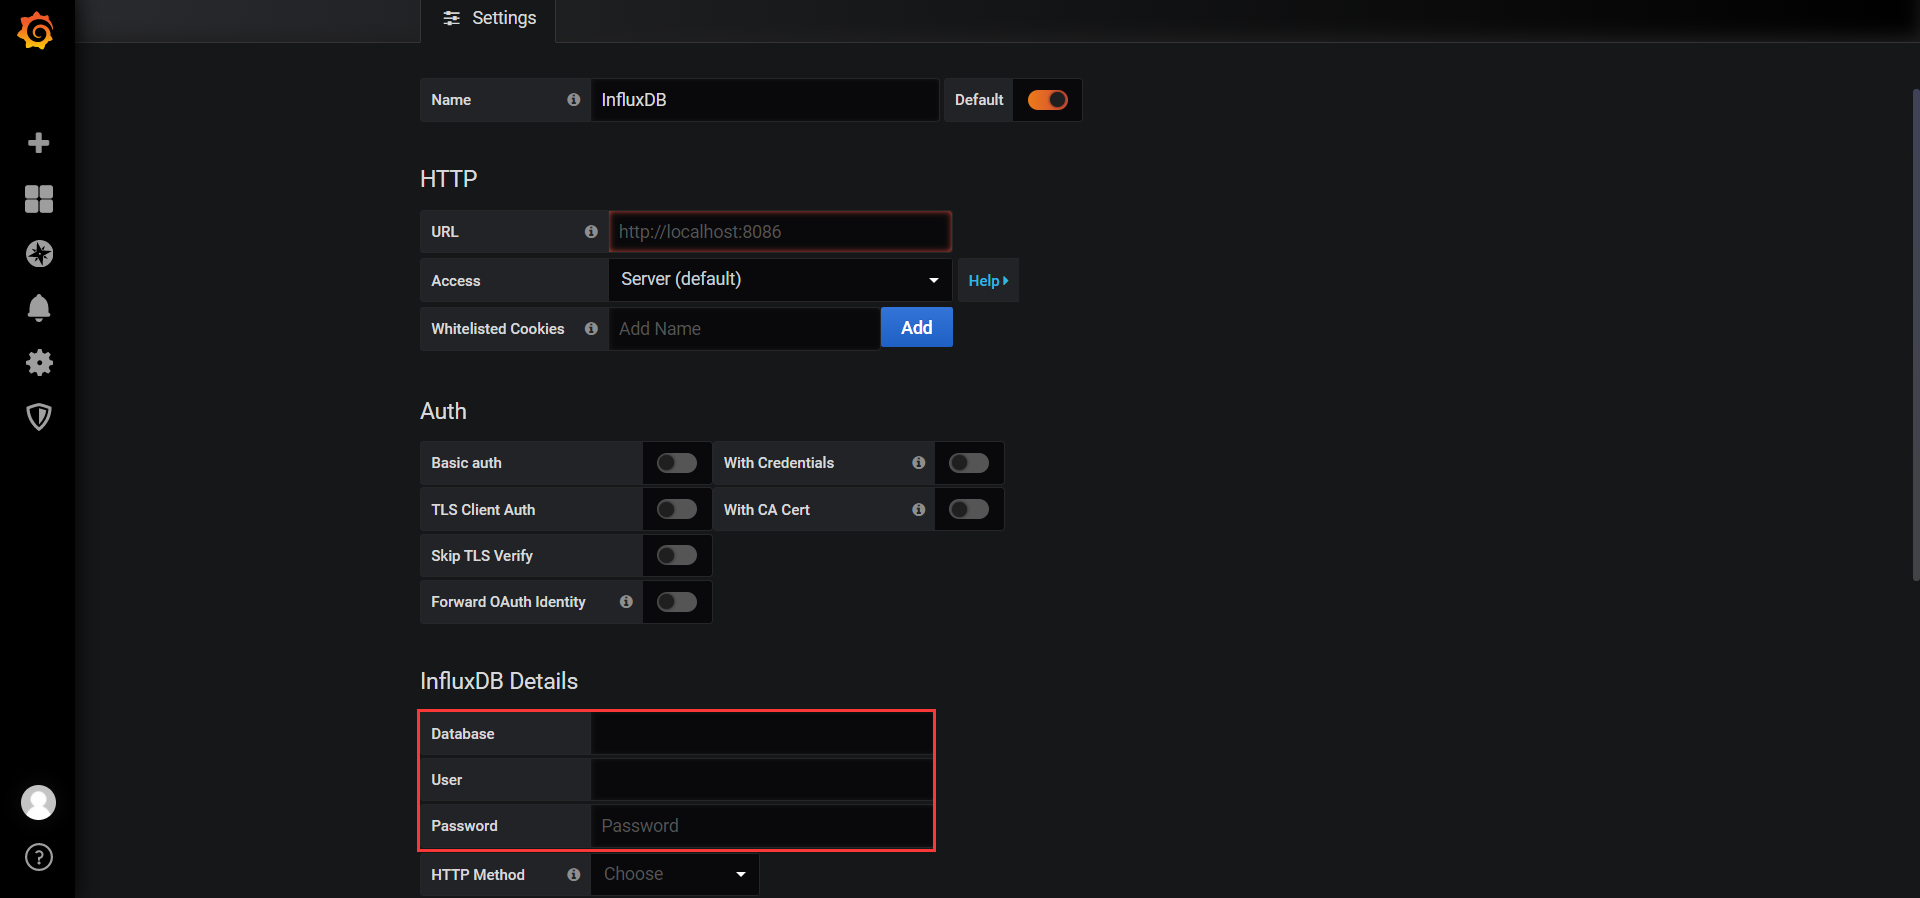
**选择influxdb作为数据源,需要在influxdb中创建该用户以及对应的数据库!
2、创建DashBoard
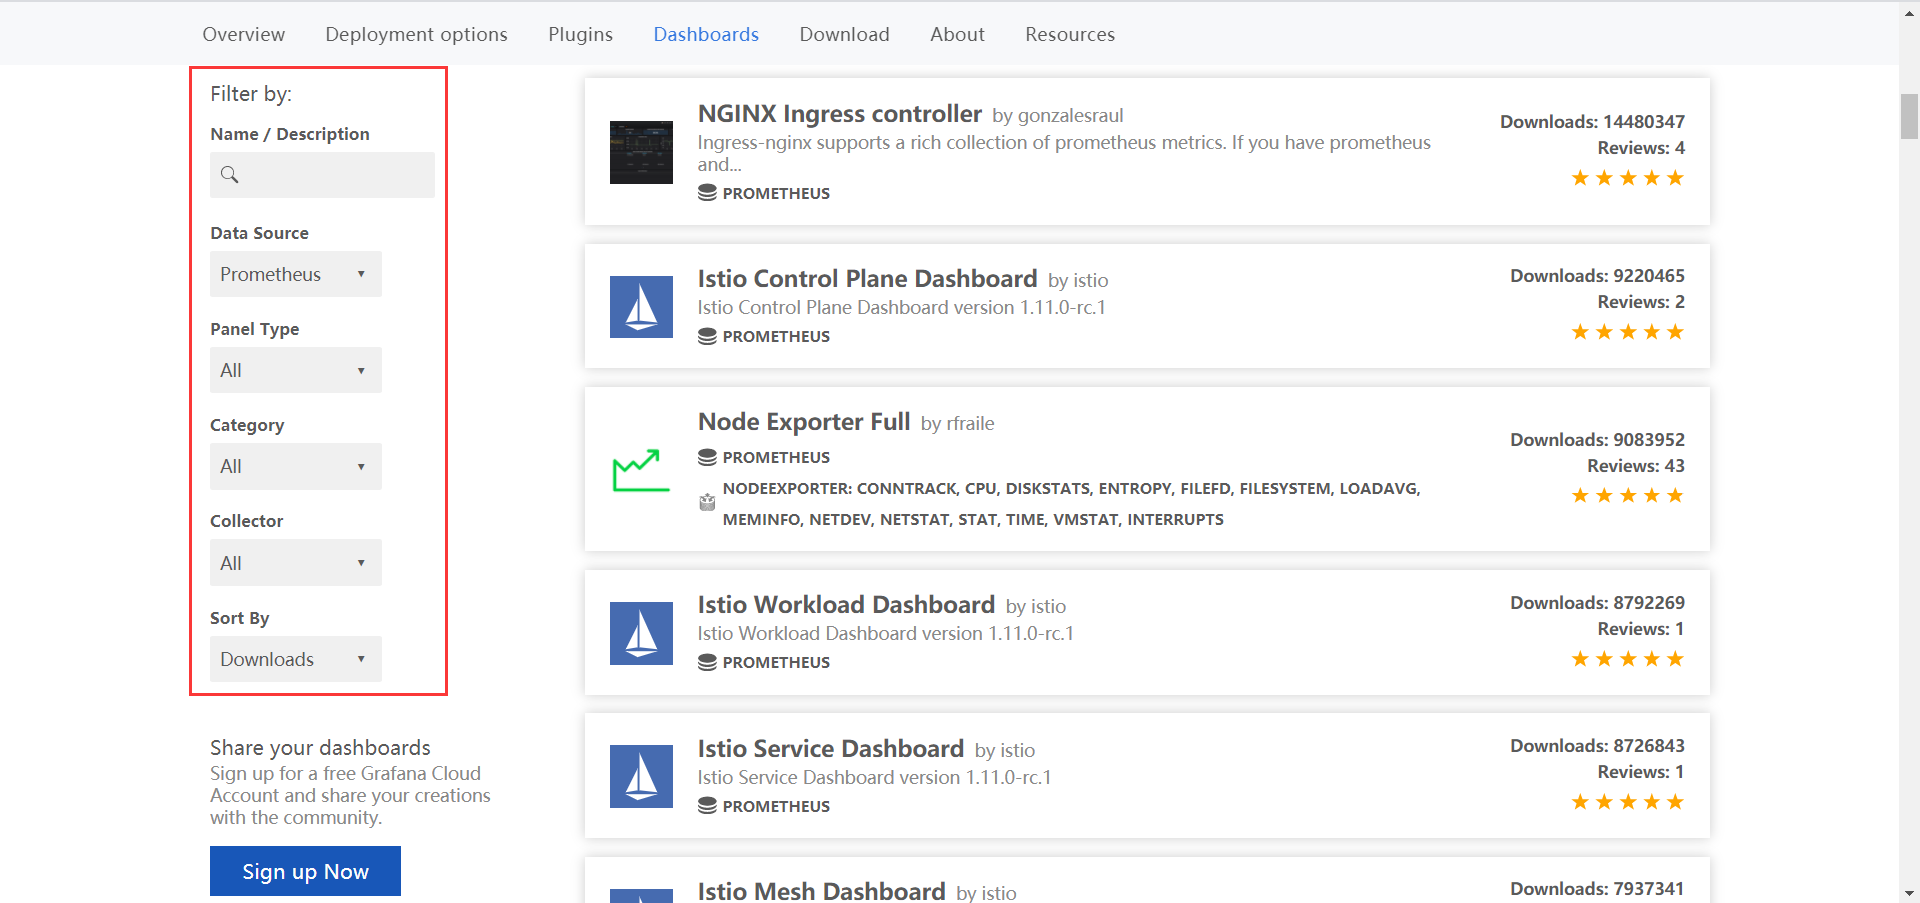
创建好数据源之后,就需要创建DashBoard(仪表盘),可以自定义,也可以导入你需要的仪表盘,官方提供了很多的可选仪表盘。
BashBoard地址:BashBoard,选择数据源,按最多使用排序:
这里选择相关的仪表盘,选择导入,示例如下:
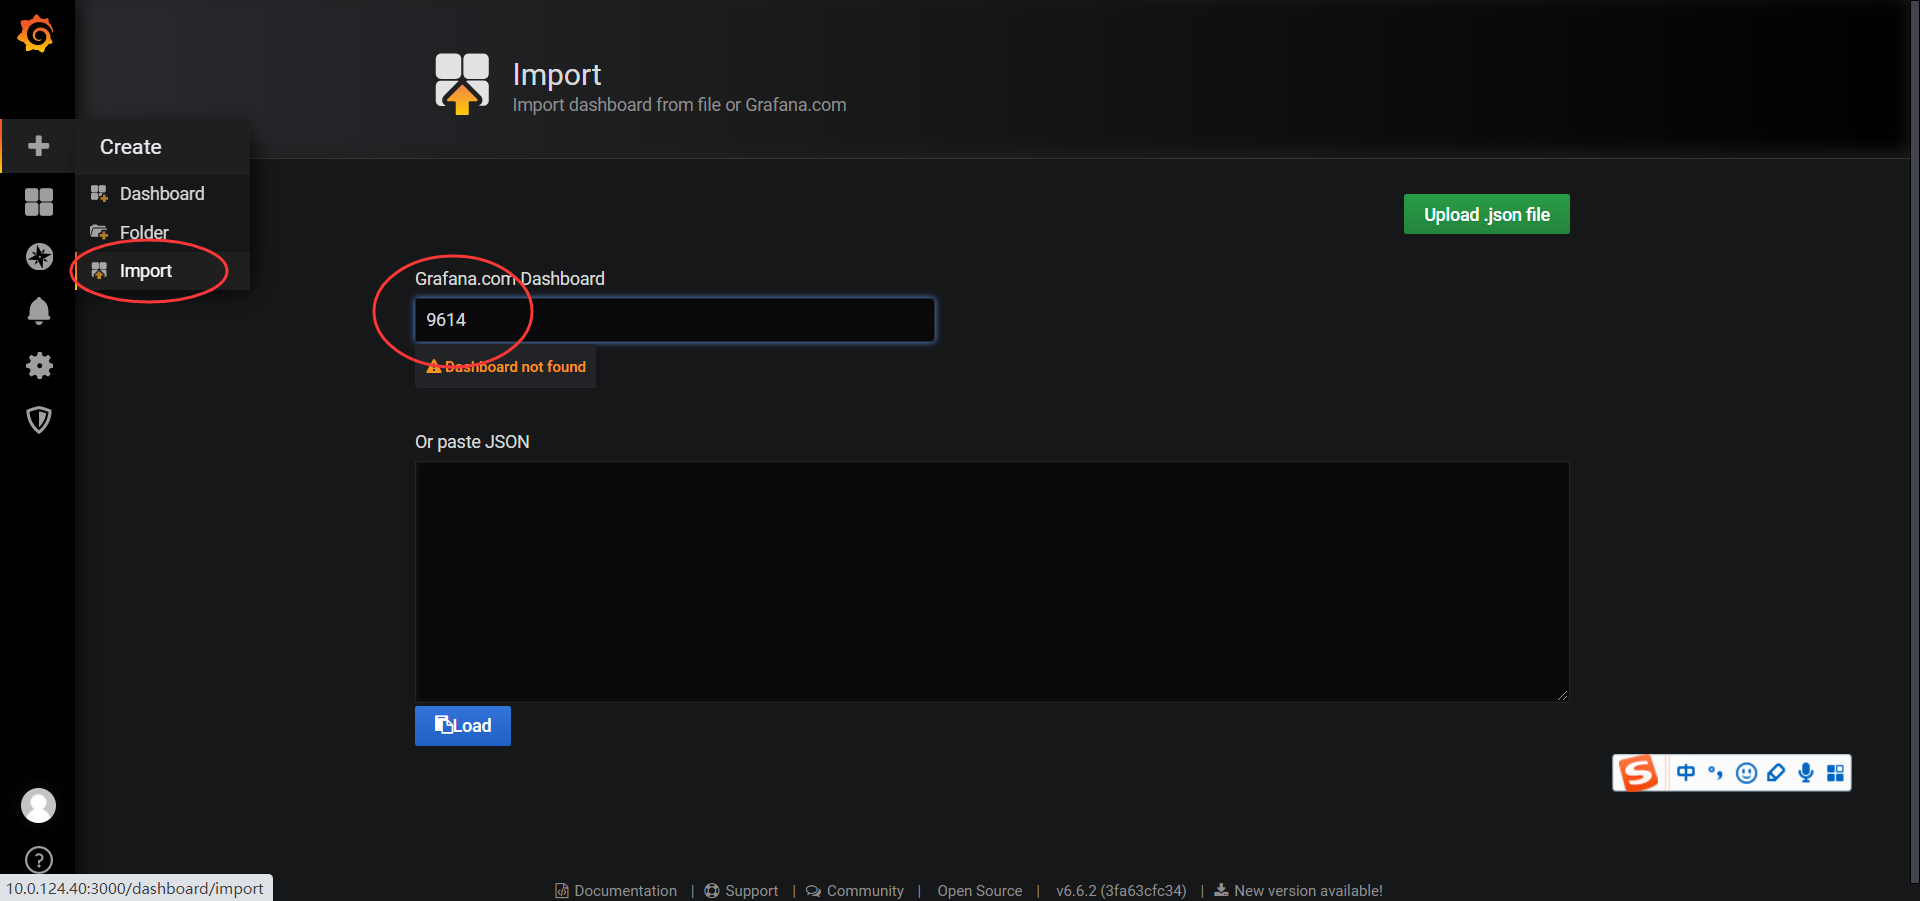
①、选相关仪表盘,这里选择NGINX Ingress controller,复制相应的仪表盘ID到剪切板:
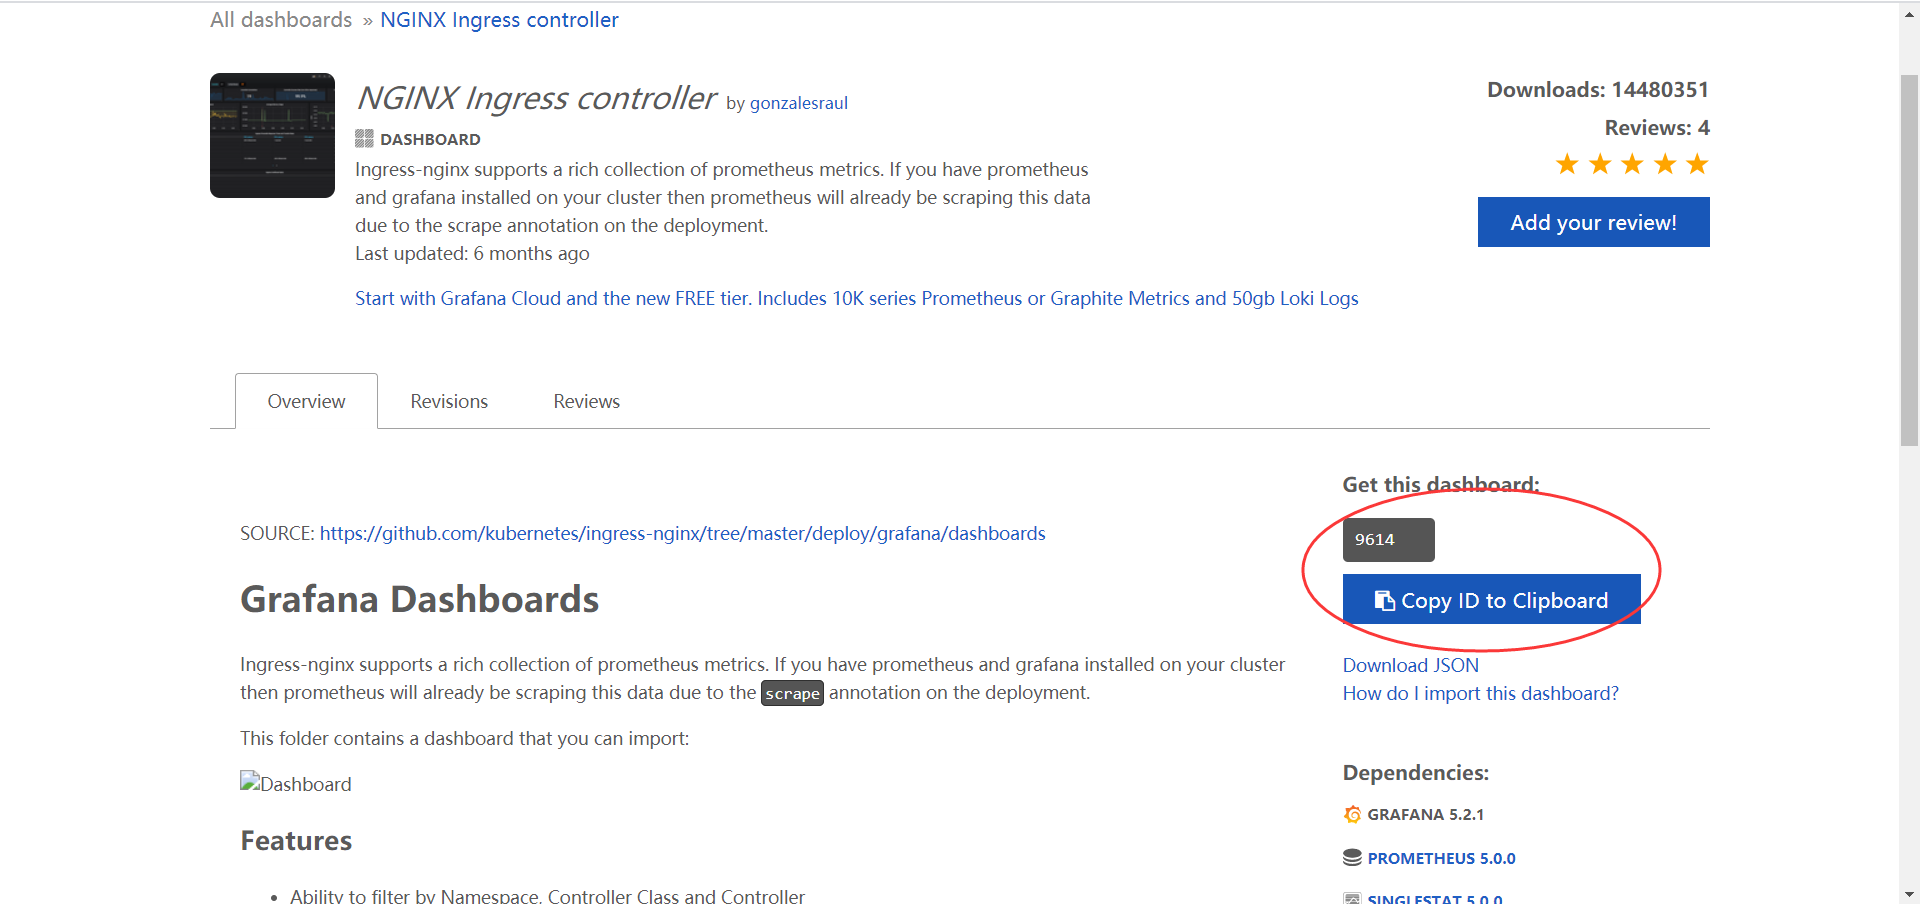
②、复制ID,填入导入界面
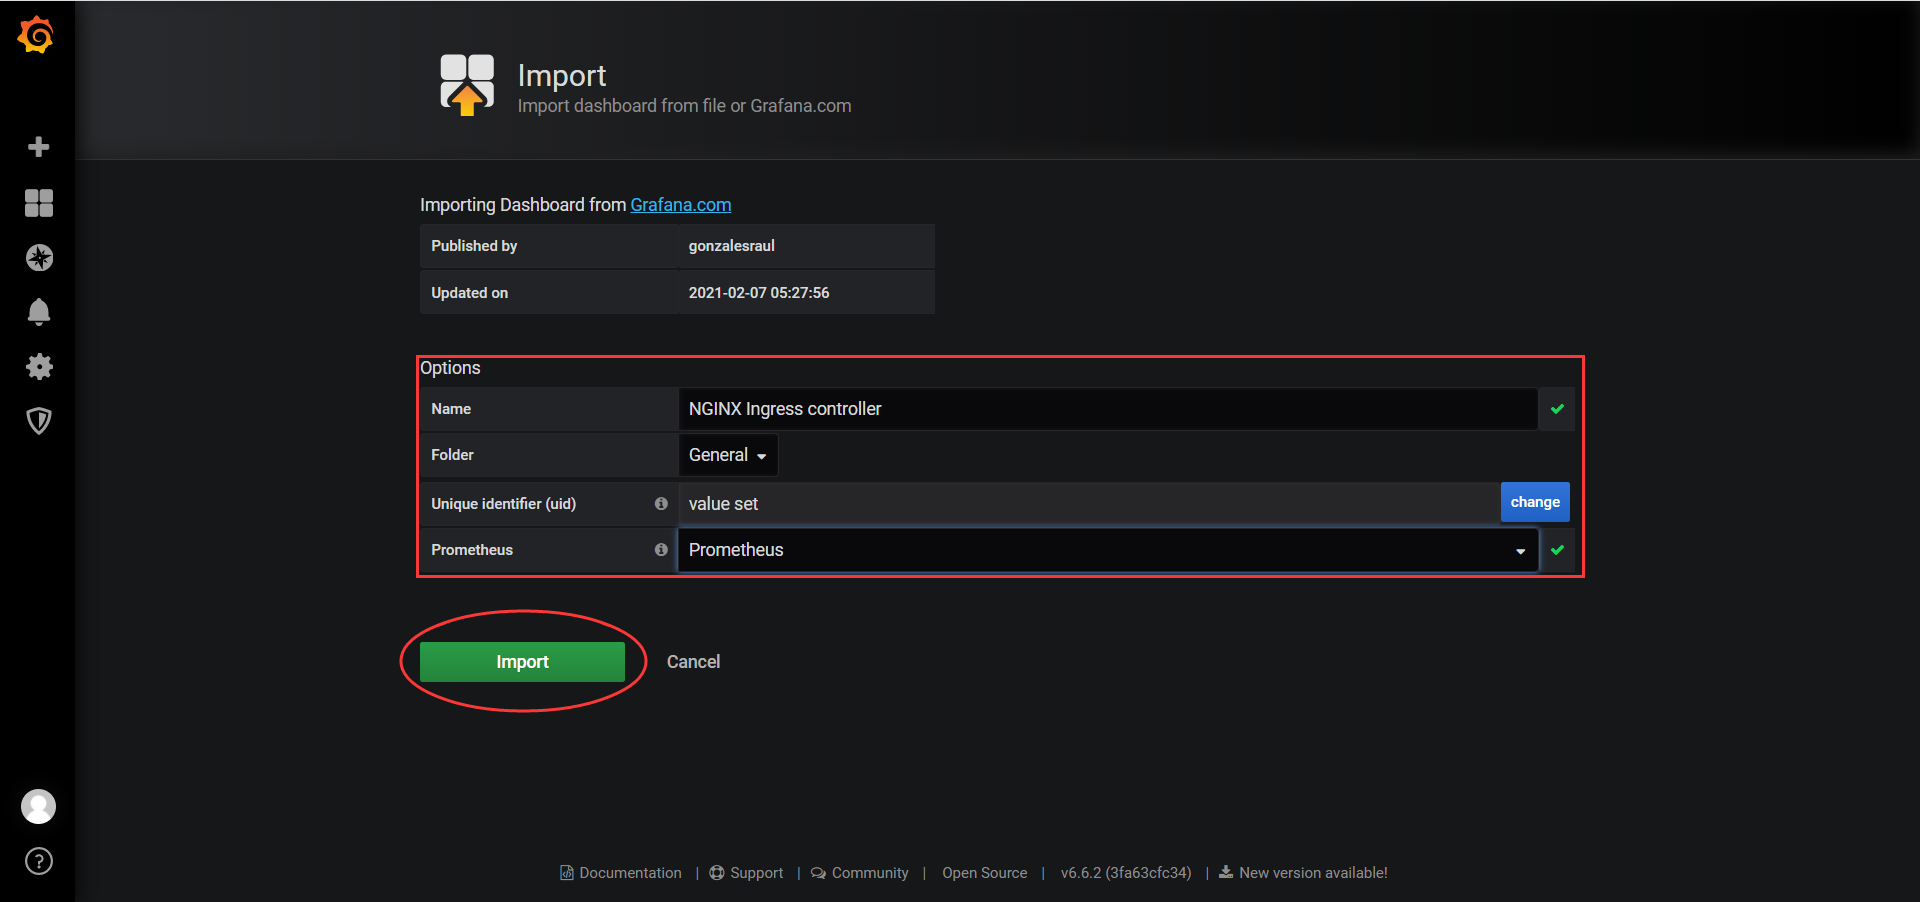
③、填入相关信息,导入
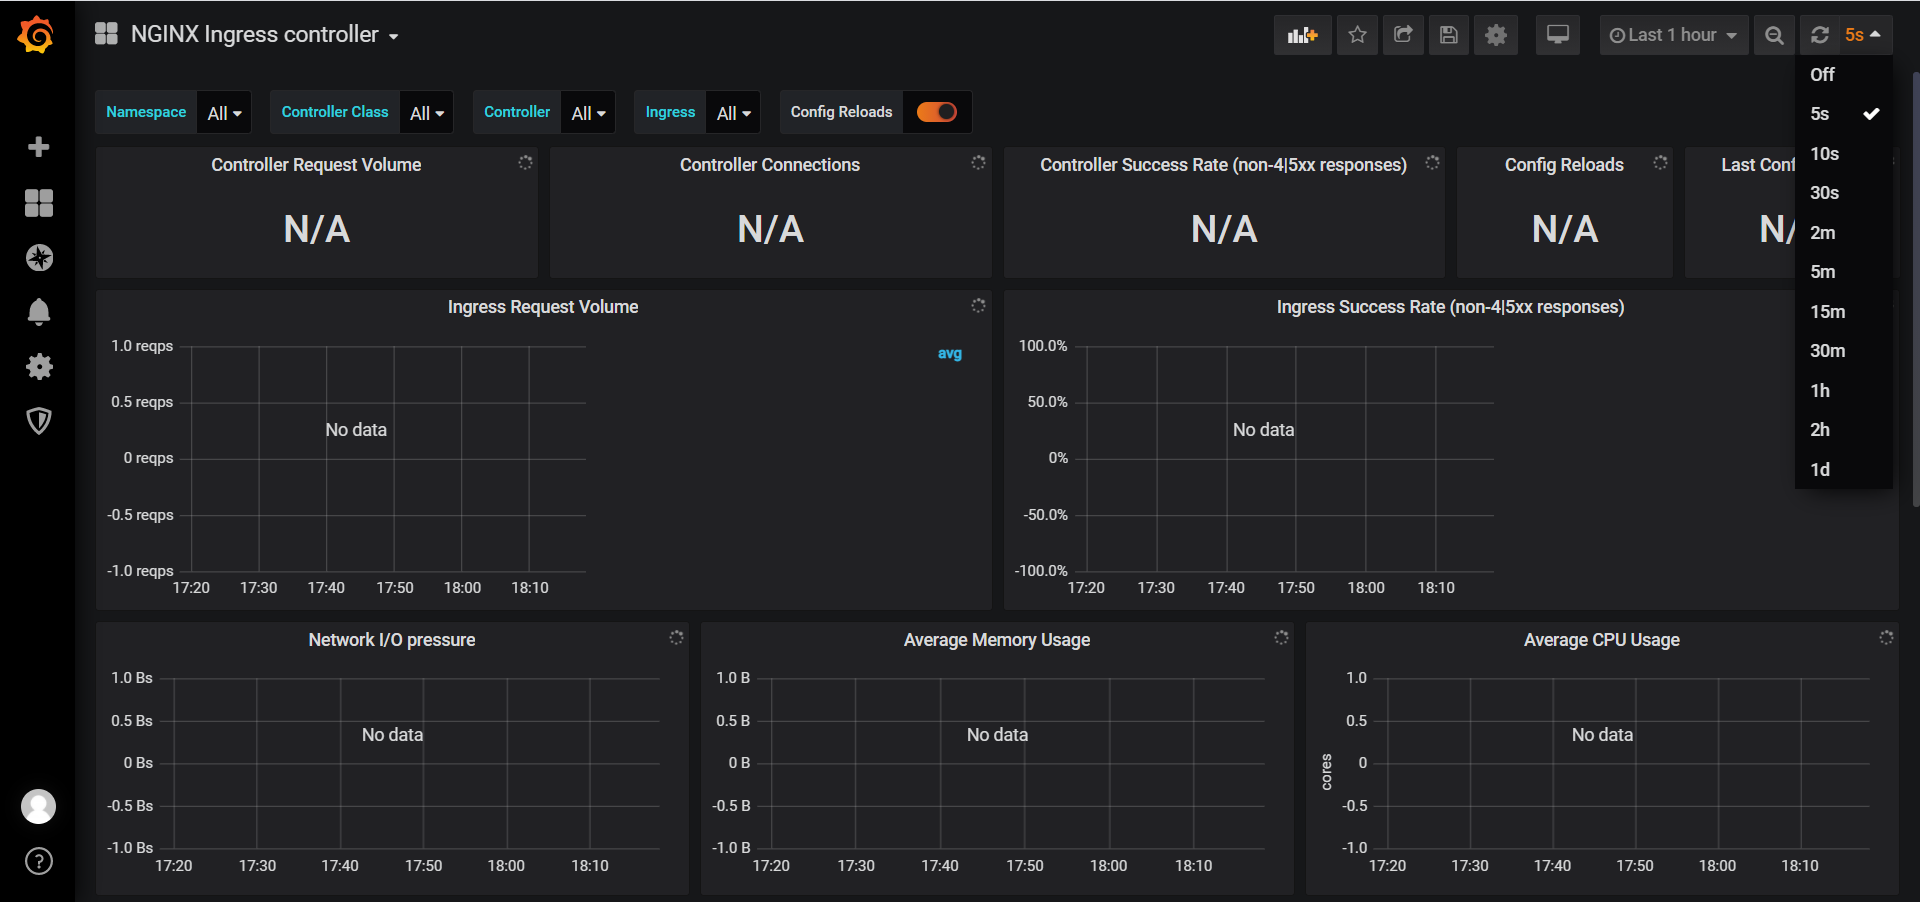
④、展示仪表盘
**右上角可以选择数据展示的时间段和刷新频次!
其它操作:
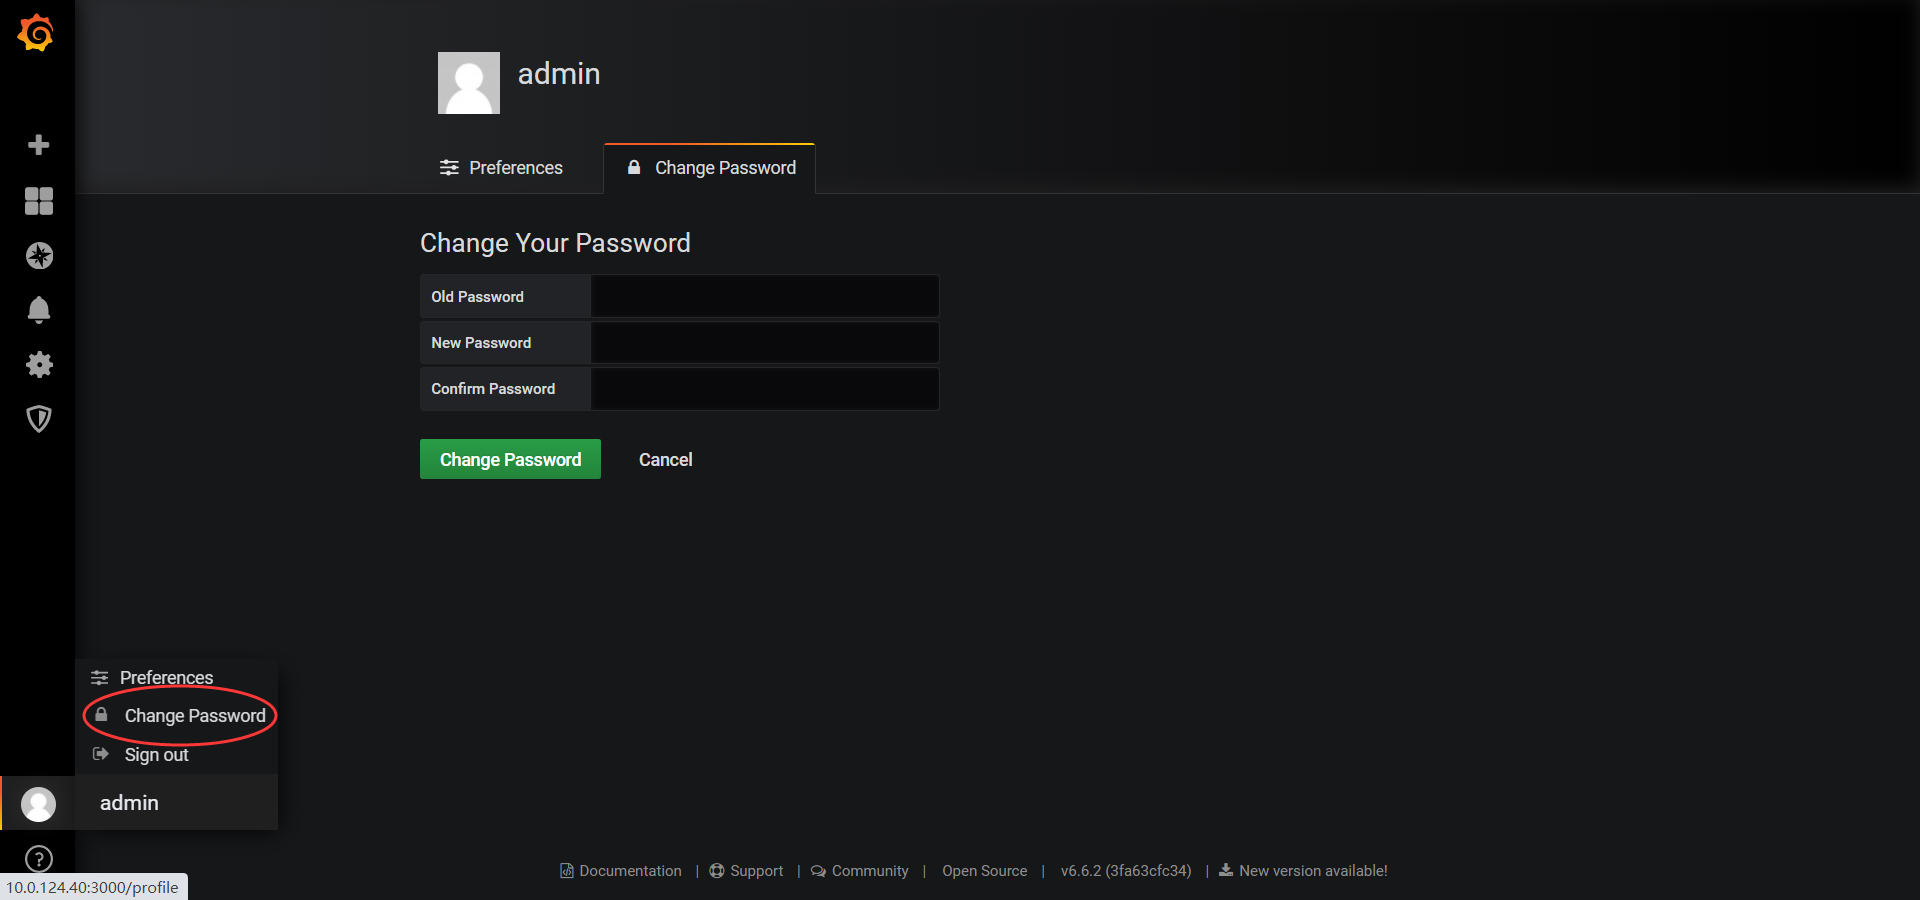
1、修改密码:(数据添加完成请谨慎操作)
2、修改端口
可以直接修改配置文件
[root@localhost ~]# vim /etc/grafana/grafana.ini
http_port = 30000

是否允许非admin用户创建组织
allow_org_create = false

是否允许匿名登录
[auth.anonymous]
# enable anonymous access
enabled = false
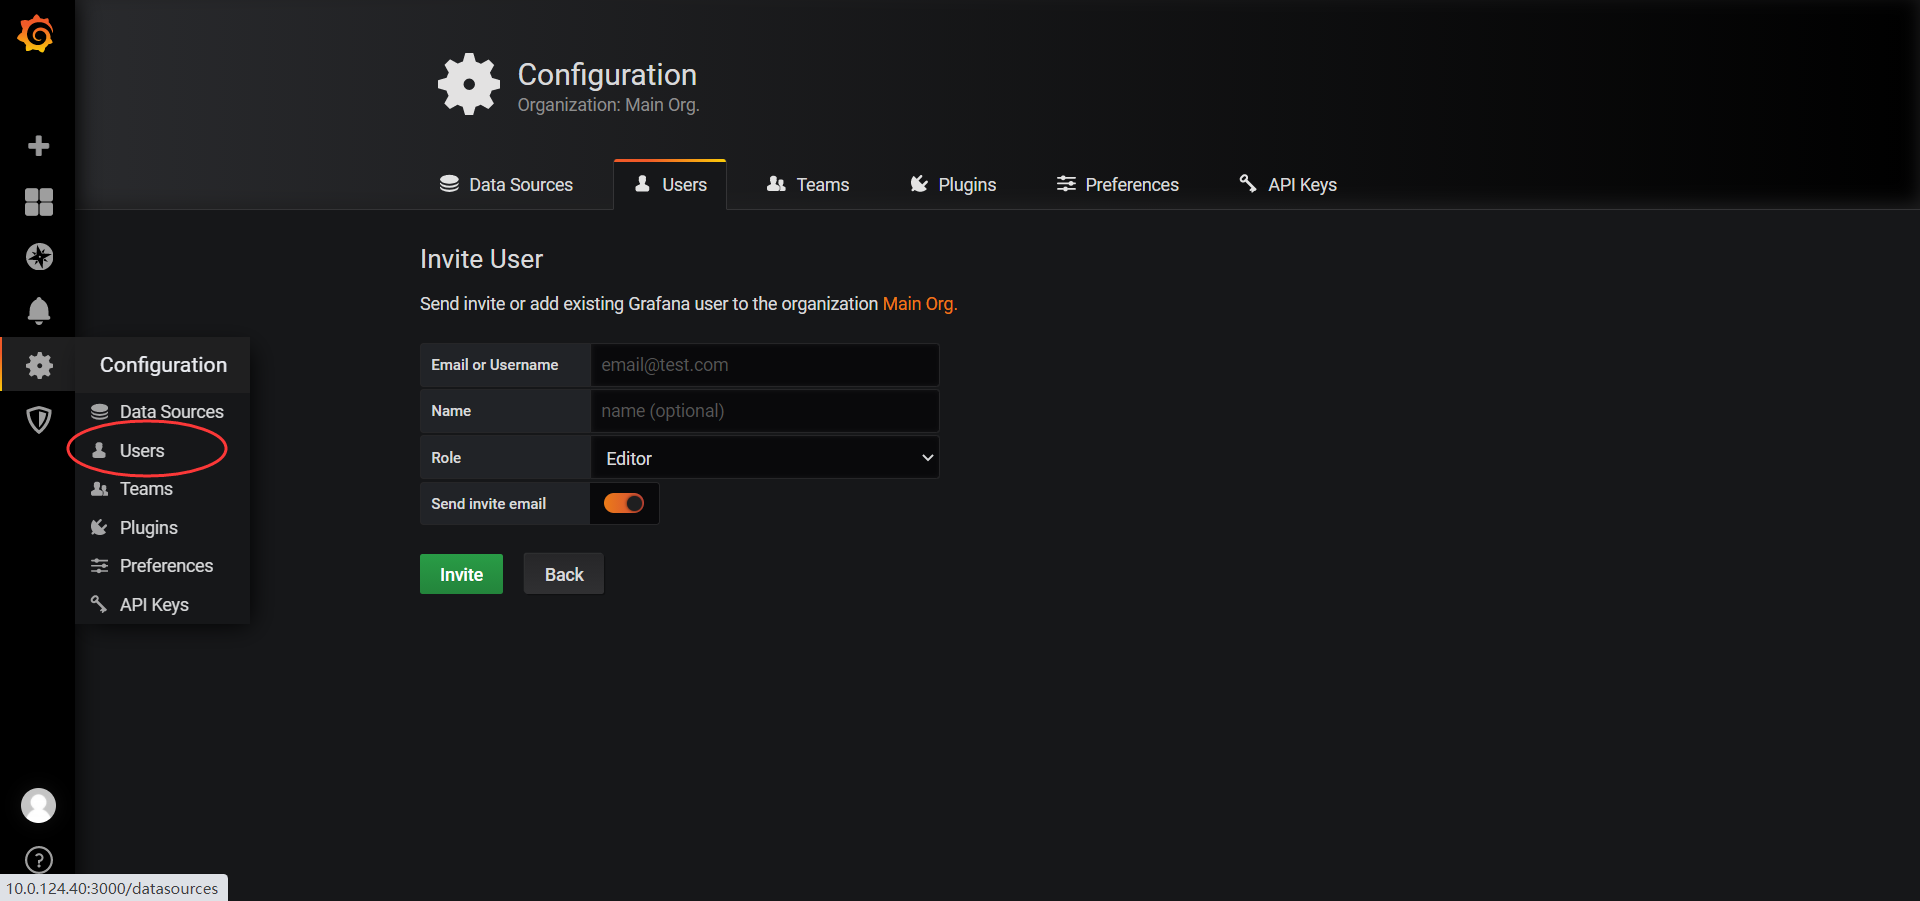
3、 添加用户
4、grafana服务端默认访问端口是3000,访问地址为ip:3000,初次访问时打不开,查了下防火墙,发现3000端口没有打开。
# 给防火墙添加3000端口
[root@localhost grafana]# firewall-cmd --add-port=3000/tcp --zone=public --permanent
Success
[root@localhost grafana]# firewall-cmd --reload
success
[root@localhost grafana]# firewall-cmd --list-ports
安装完毕。

 浙公网安备 33010602011771号