pycharm中的matplotlib错误
 本章主要是解决pycharm在运行代码时的问题,执行相关的matplotlib的代码报错的解决方法
pycharm中的matplotlib错误
程序源代码
import matplotlib.pyplot as plt
import numpy as np

# 定义x的取值范围和步长
x = np.linspace(-10, 10, 400)  # 从-10到10生成400个点

# 计算对应的y值
y = 2 * x**2 + 1

# 创建图形
plt.figure(figsize=(8, 6))  # 设置图形大小
plt.plot(x, y, label="$y=2x^2+1$")  # 绘制曲线,并添加图例标签
plt.title("Graph of $y=2x^2+1$")  # 添加标题
plt.xlabel("x")  # 添加x轴标签
plt.ylabel("y")  # 添加y轴标签
plt.grid(True)  # 显示网格
plt.legend()  # 显示图例
plt.show()  # 显示图形
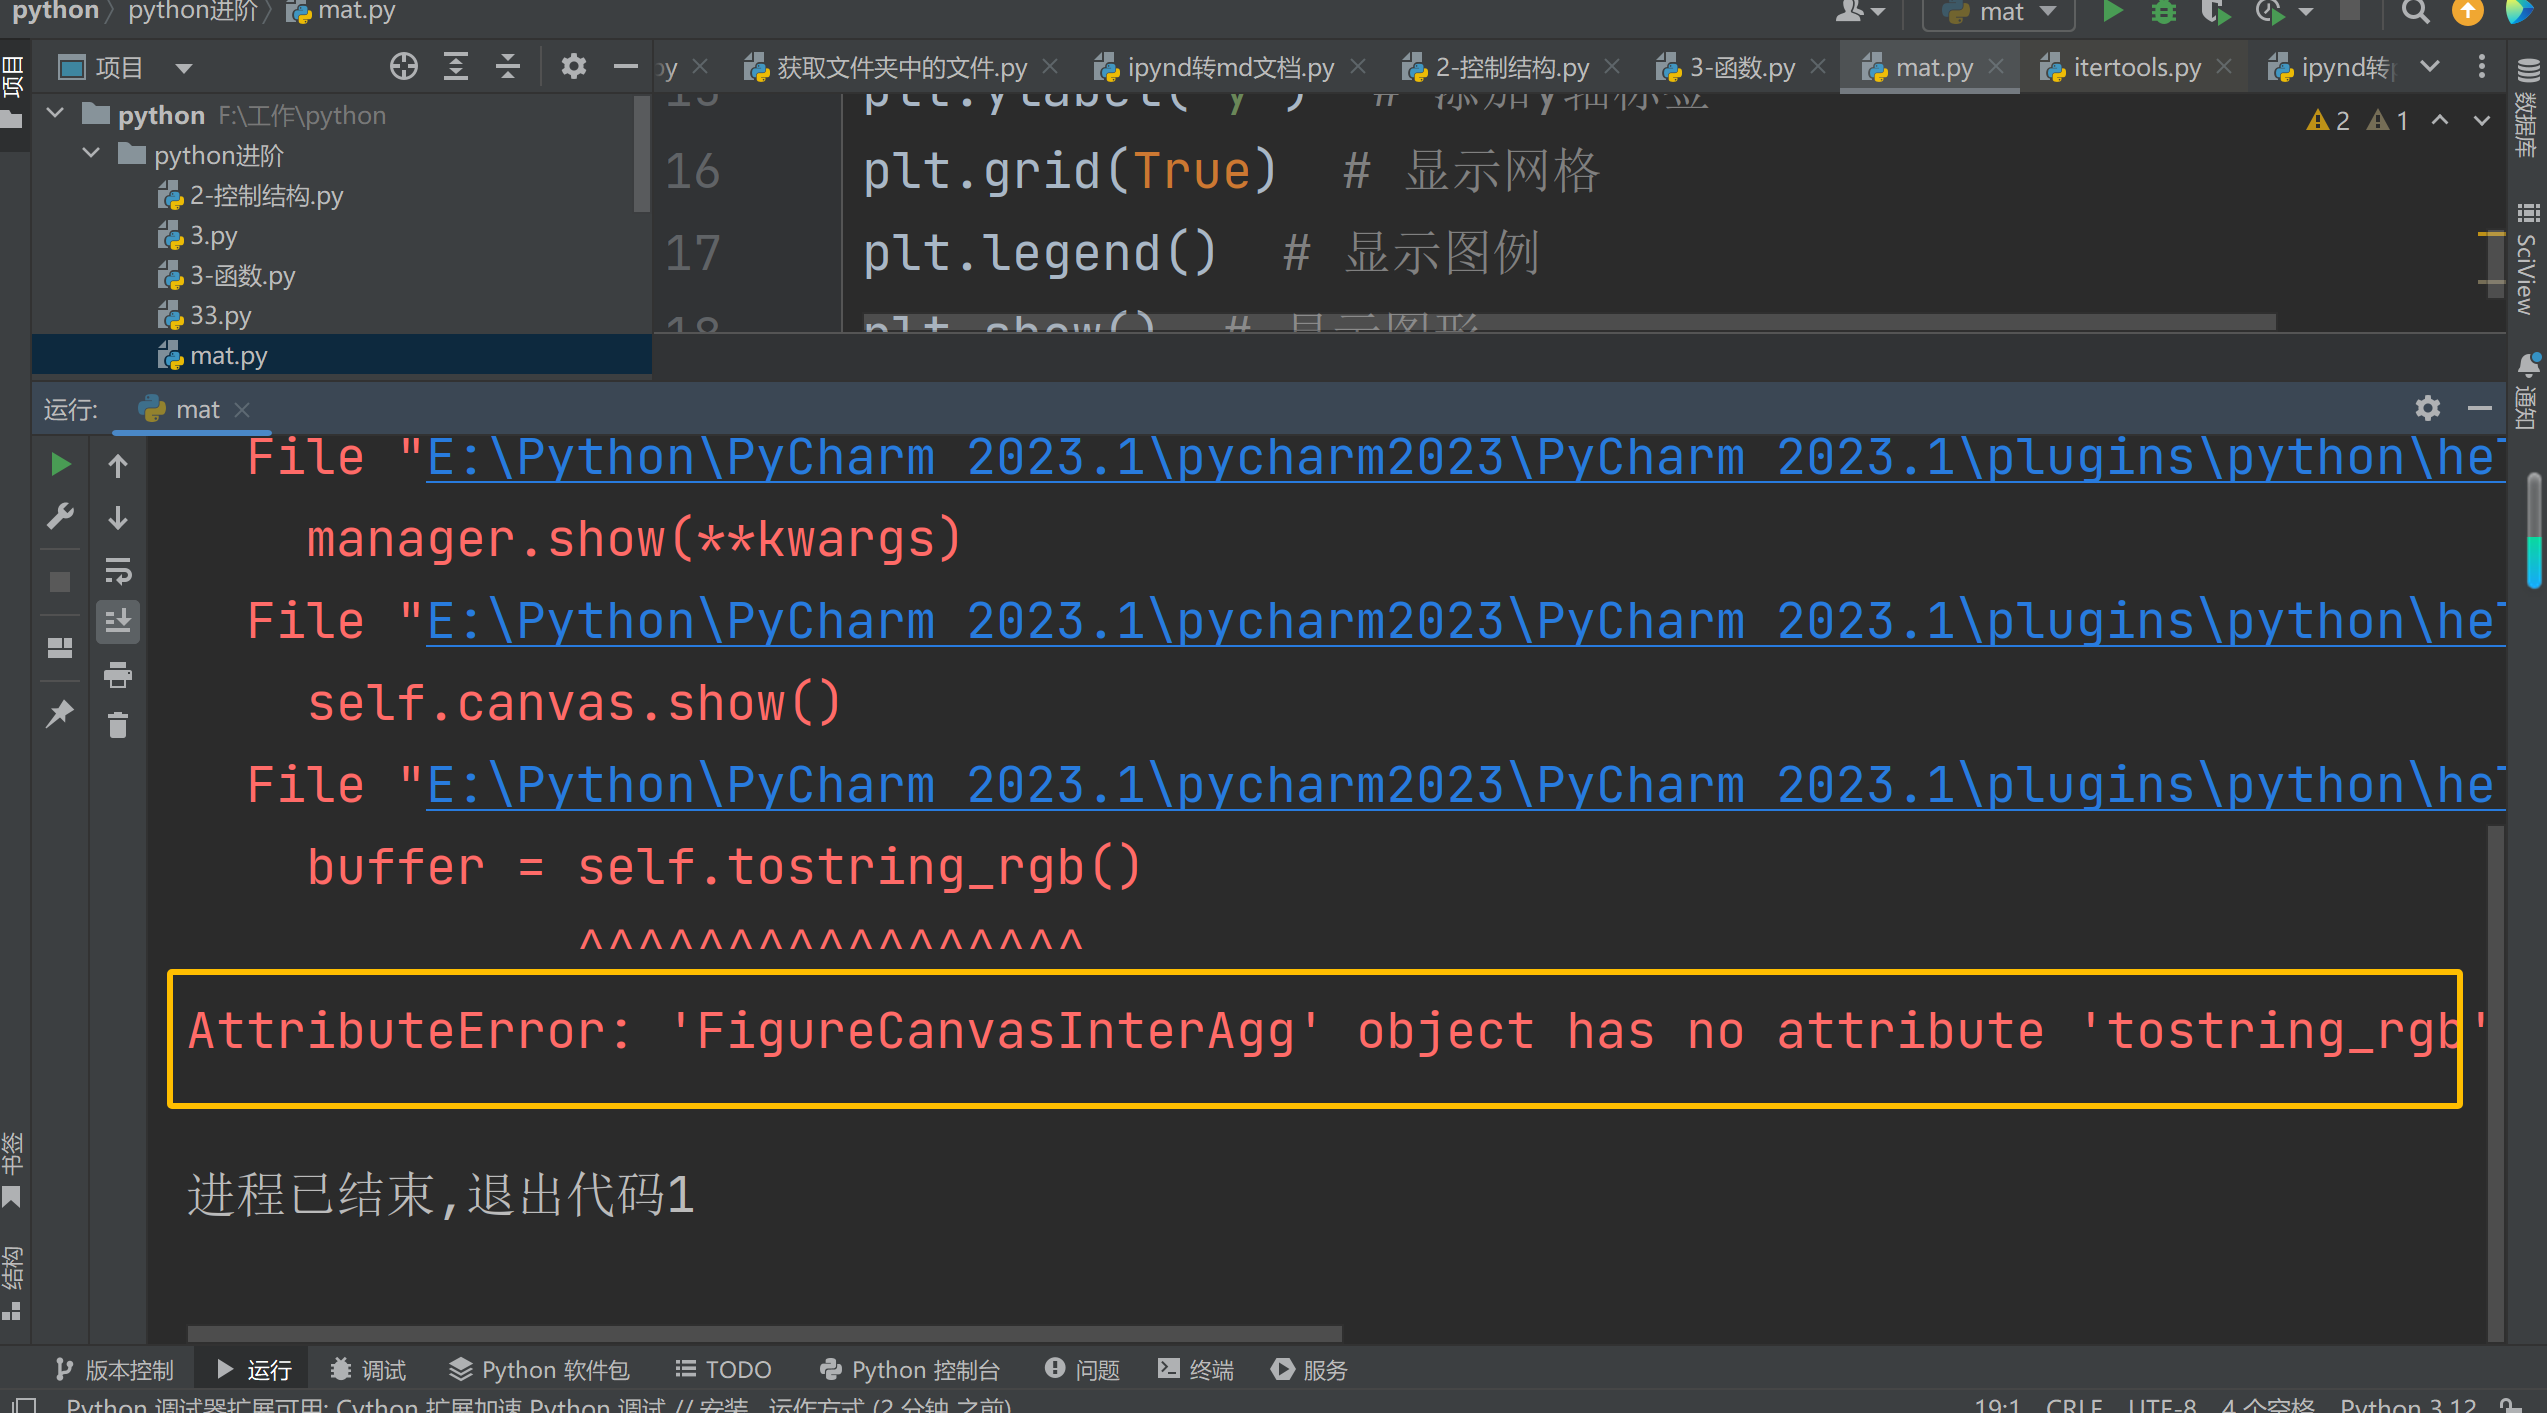
1.错误代码和截图
AttributeError: 'FigureCanvasInterAgg' object has no attribute 'tostring_rgb'. Did you mean: 'tostring_argb'?
2.解决方法
方法1
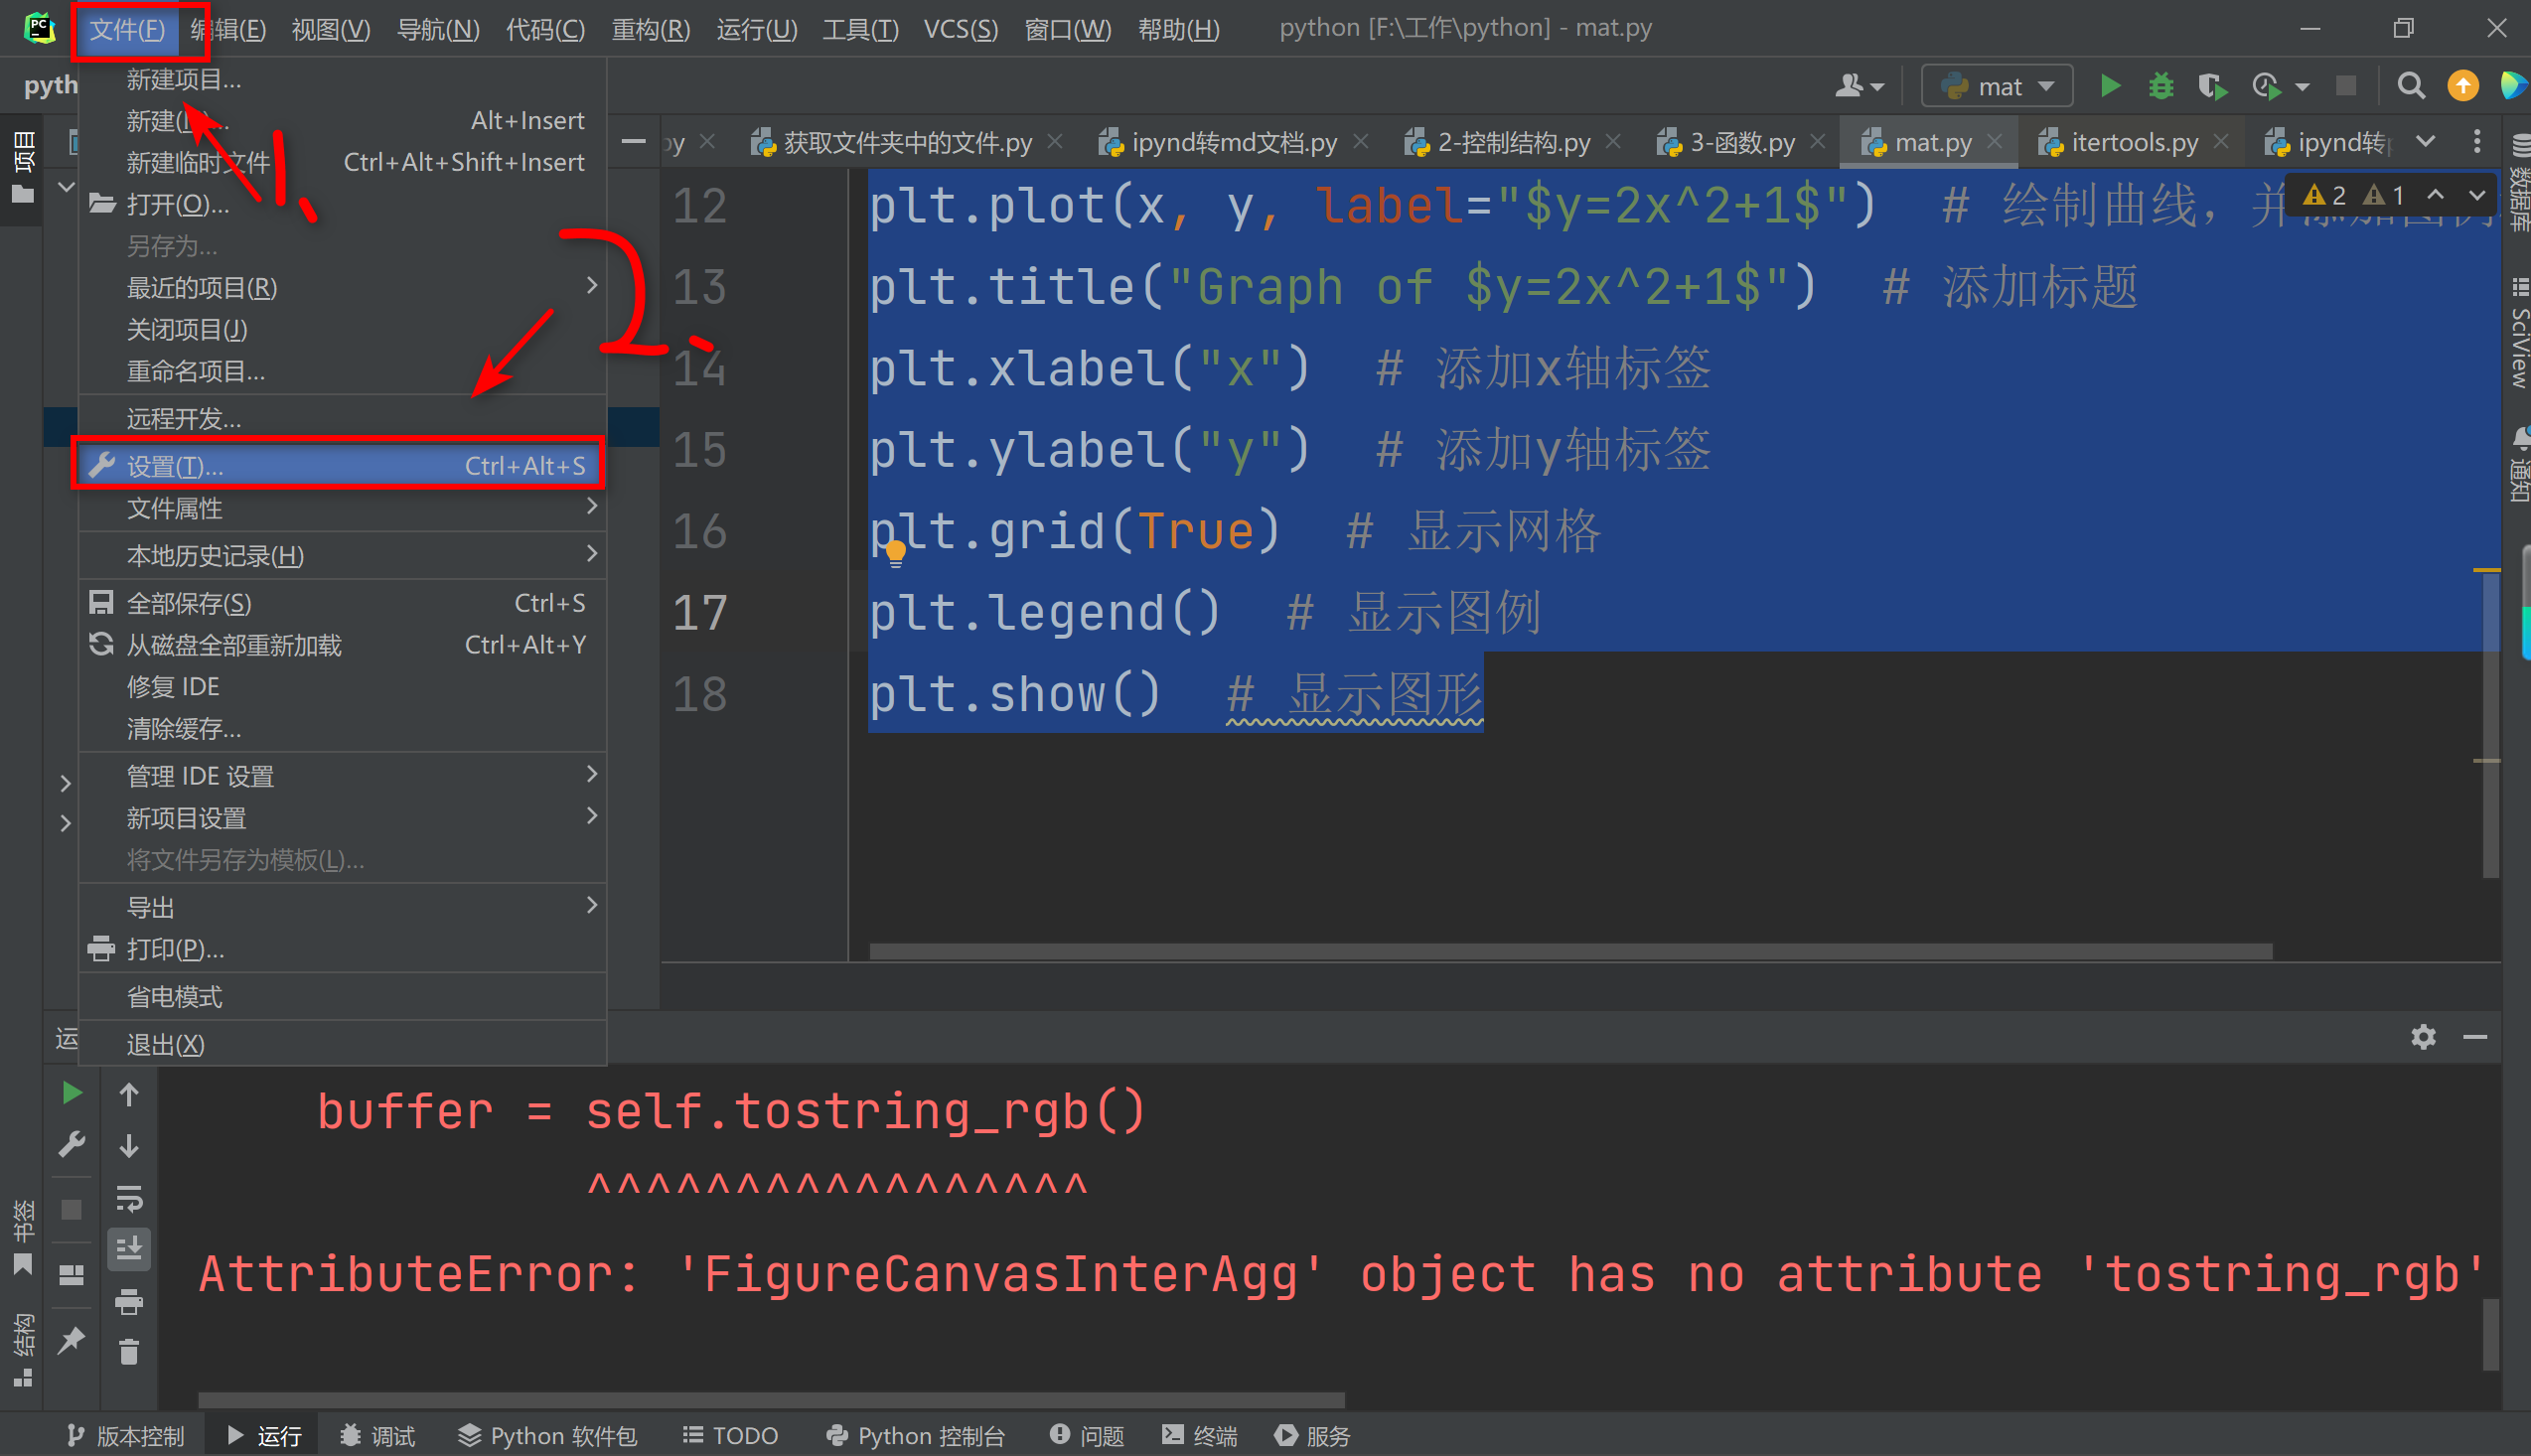
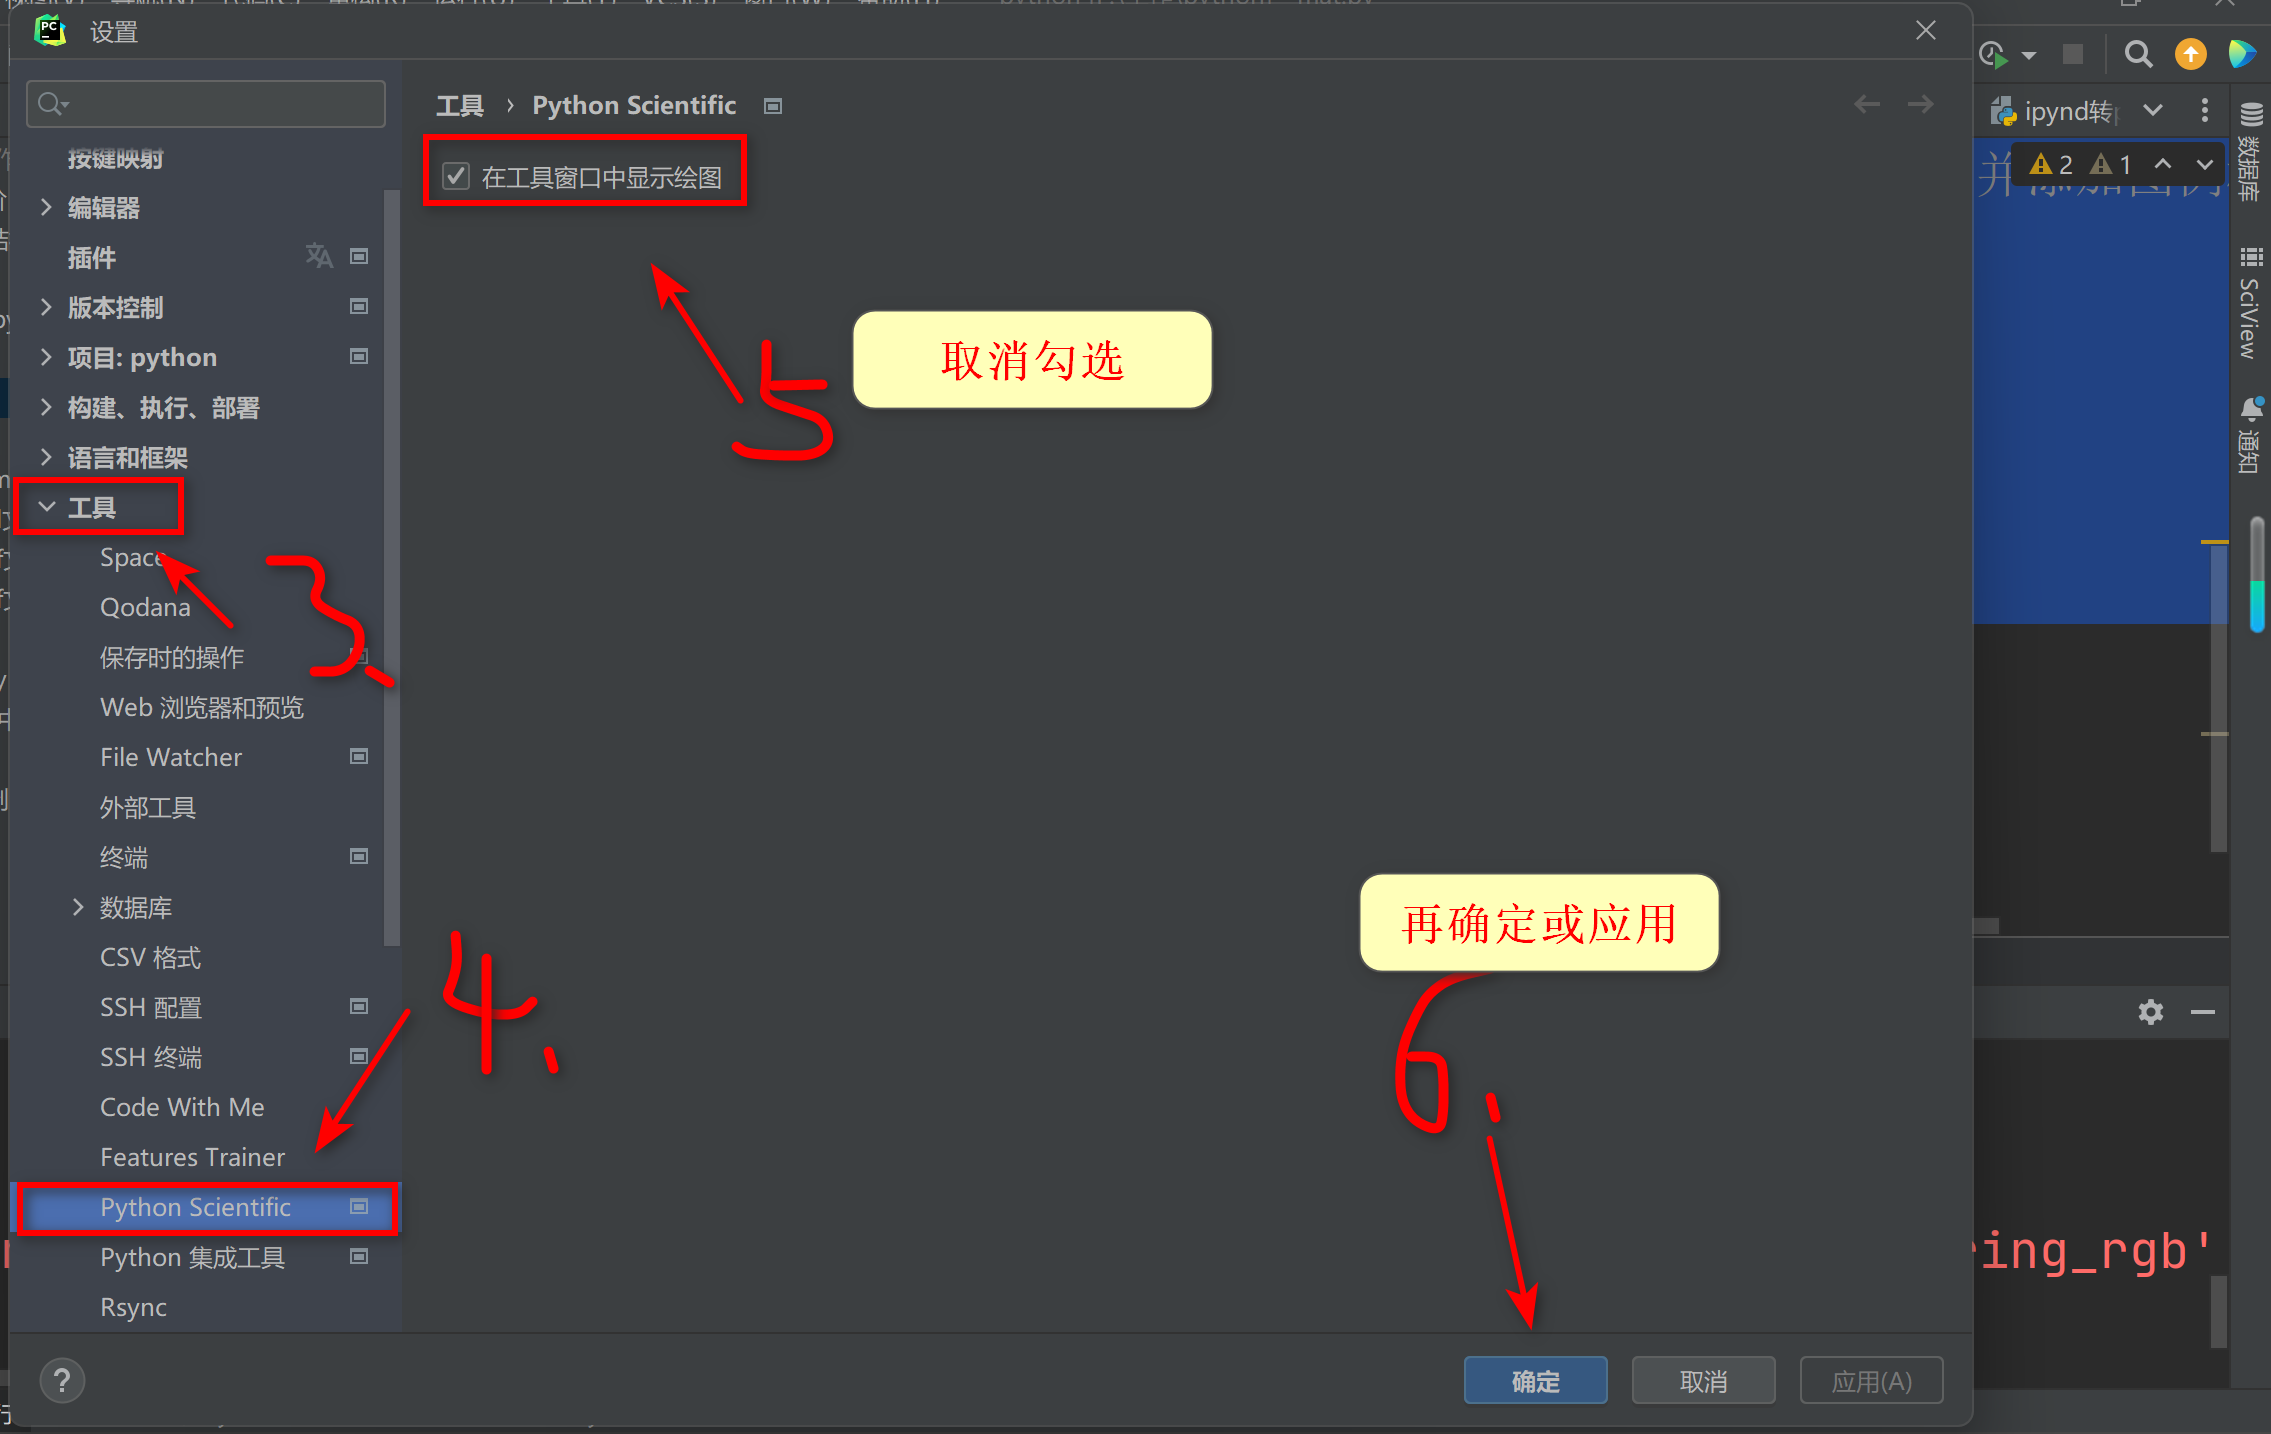
更改 PyCharm 设置:打开 PyCharm,依次点击 File -> Settings -> Tools -> Python Scientific,去掉 “Show plots in tool window” 复选项
也就是:文件 --> 设置 --> 工具 --> Python Scientific
去掉 “Show plots in tool window” 复选项
方法2
使用 TkAgg 后端:在代码文件头部添加以下代码,将 Matplotlib 后端设置为 TkAgg
import matplotlib
matplotlib.use('TkAgg')
更改后的源代码如下:
import matplotlib.pyplot as plt
import numpy as np

# 添加下面这两句也可以解决问题
import matplotlib
matplotlib.use('TkAgg')

# 定义x的取值范围和步长
x = np.linspace(-10, 10, 400)  # 从-10到10生成400个点

# 计算对应的y值
y = 2 * x**2 + 1

# 创建图形
plt.figure(figsize=(8, 6))  # 设置图形大小
plt.plot(x, y, label="$y=2x^2+1$")  # 绘制曲线,并添加图例标签
plt.title("Graph of $y=2x^2+1$")  # 添加标题
plt.xlabel("x")  # 添加x轴标签
plt.ylabel("y")  # 添加y轴标签
plt.grid(True)  # 显示网格
plt.legend()  # 显示图例
plt.show()  # 显示图形
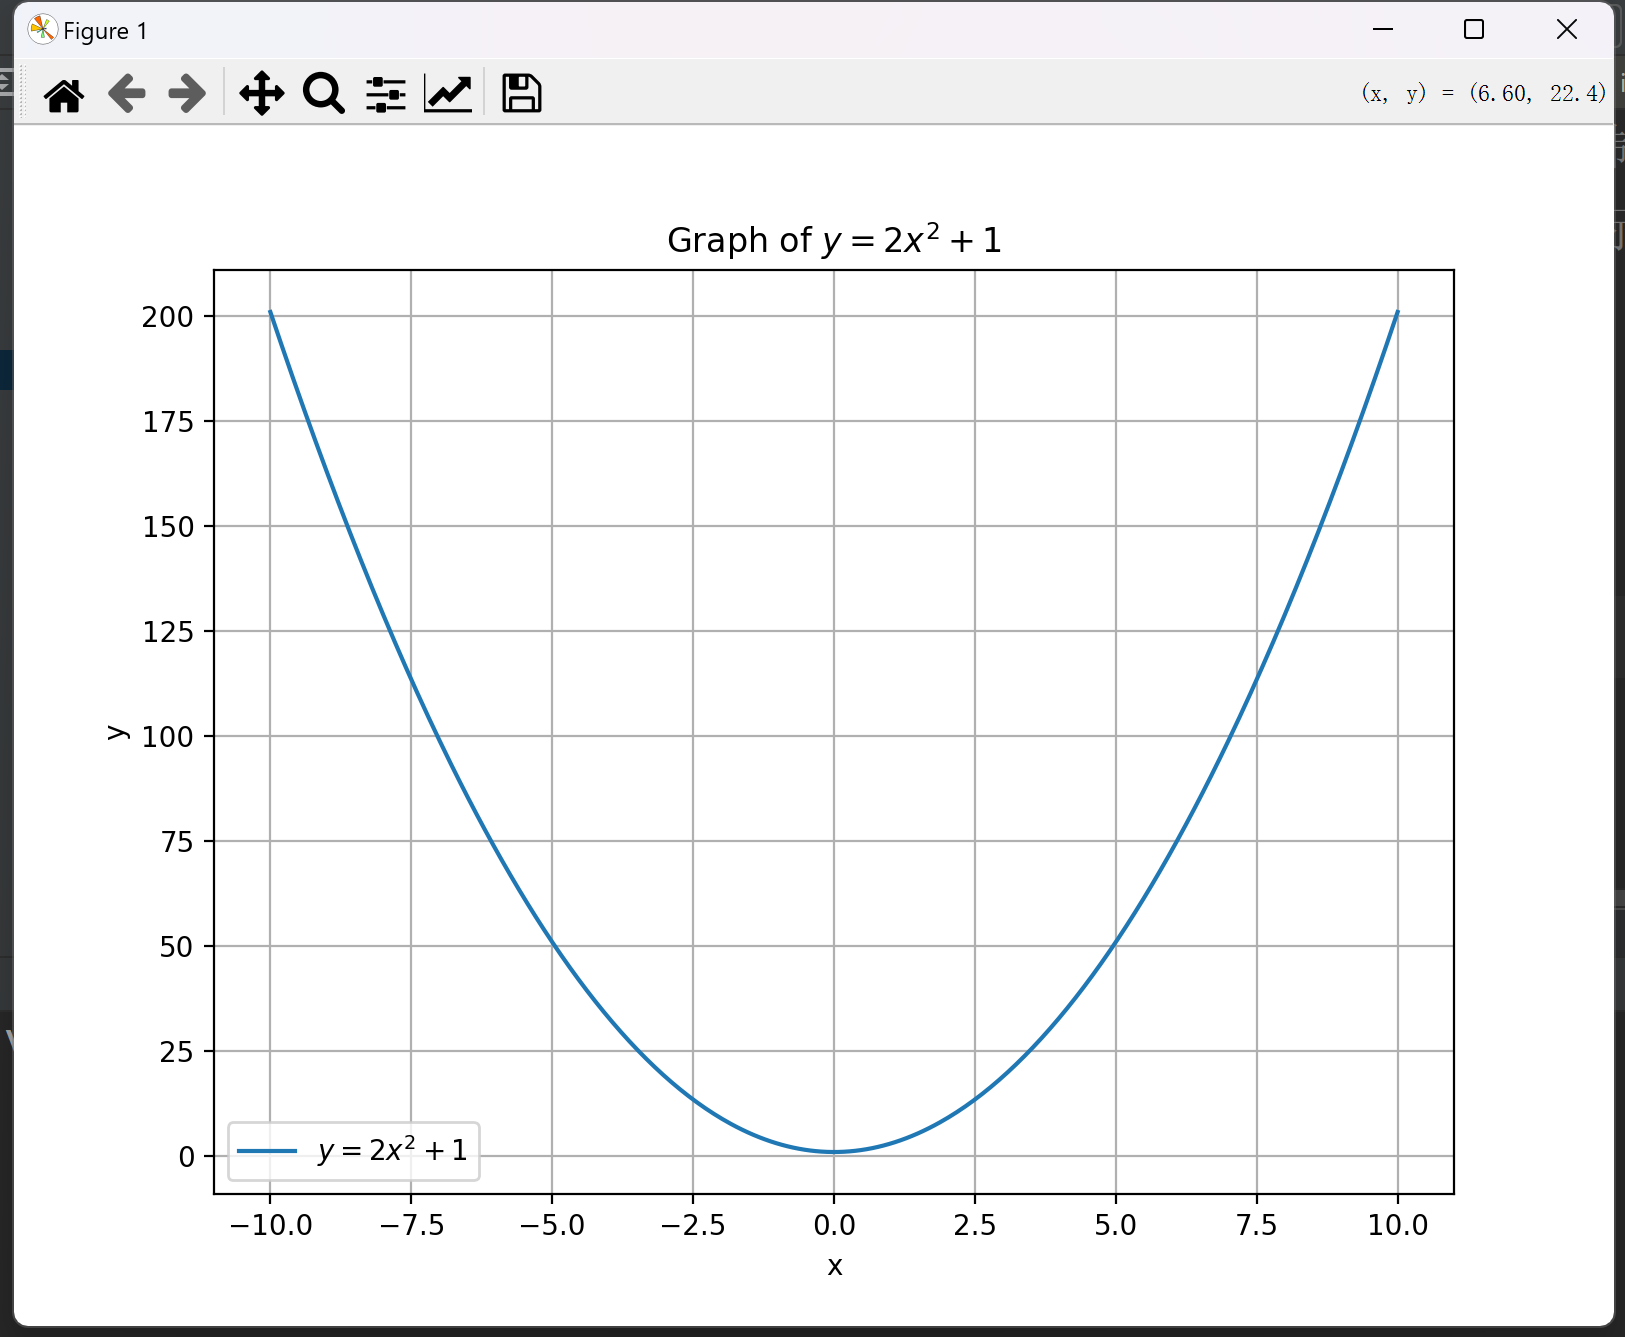
3.成功解决
使用上述两个方法其中之一即可解决问题
重新运行代码后显示如下:

 浙公网安备 33010602011771号