
D3——散点图Scatterplot
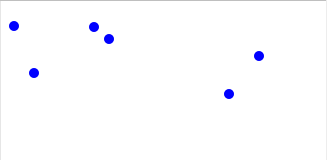
散点图
//Width and height
var w = 500;
var h = 100;
var barPadding = 3;

var dataset = [
      [5, 20], [480, 90], [250, 50], [100, 33], [330, 95],
      [410, 12], [475, 44], [25, 67], [85, 21], [220, 88]
];

//Create SVG element
var svg = d3.select("body")
    .append("svg")
    .attr("width", w)
    .attr("height", h);

svg.selectAll("circle")
   .data(dataset)
   .enter()
   .append("circle")
   .attr("cx", function(d) {
        return d[0];
   })
   .attr("cy", function(d) {
        return d[1];
   })
   .attr("r", 5)
   .attr("fill", "rgb(0,0,255)");
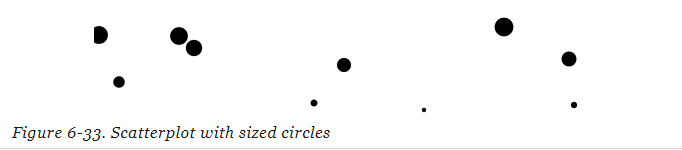
.attr("r", function(d) {
    return Math.sqrt(h - d[1]);
});
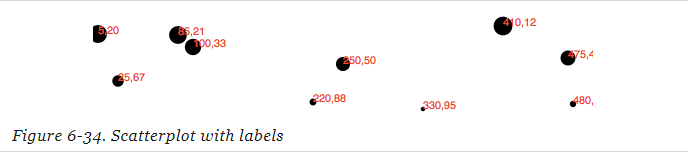
添加labels
svg.selectAll("text")
   .data(dataset)
   .enter()
   .append("text")
   .text(function(d) {
        return d[0] + "," + d[1];
   })
   .attr("x", function(d) {
        return d[0];
   })
   .attr("y", function(d) {
        return d[1];
   })
   .attr("font-family", "sans-serif")
   .attr("font-size", "11px")
   .attr("fill", "red");

 浙公网安备 33010602011771号