
Spring Boot + Spring Cloud 构建微服务系统(五):熔断监控面板(Hystrix Dashboard)
Hystrix Dashboard
Hystrix-dashboard是一款针对Hystrix进行实时监控的工具,通过Hystrix Dashboard我们可以在直观地看到各Hystrix Command的请求响应时间, 请求成功率等数据。
添加依赖
我们新建一个工程 spring-cloud-consul-monitor,修改 pom 文件,添加相关依赖。
pom.xml
    <dependencies>
        <dependency>
            <groupId>org.springframework.boot</groupId>
            <artifactId>spring-boot-starter-actuator</artifactId>
        </dependency>
        <dependency>
            <groupId>org.springframework.cloud</groupId>
            <artifactId>spring-cloud-starter-netflix-hystrix-dashboard</artifactId>
        </dependency>
    </dependencies>
启动类
在启动类中添加注解 @EnableHystrixDashboard 开启熔断监控支持。
ConsuleMonitorApplication.java
package com.louis.spring.cloud.consul.monitor;

import org.springframework.boot.SpringApplication;
import org.springframework.boot.autoconfigure.SpringBootApplication;
import org.springframework.cloud.netflix.hystrix.dashboard.EnableHystrixDashboard;

@EnableHystrixDashboard
@SpringBootApplication
public class ConsuleMonitorApplication {

    public static void main(String[] args) {
        SpringApplication.run(ConsuleMonitorApplication.class, args);
    }
}
修改配置
修改配置文件,配置启动端口和应用名称。
application.yml
server:
  port: 8531
spring:
  application:
    name: spring-cloud-consul-monitor
配置监控路径
注意,如果你使用的是2.x等比较新的版本,需要在 Hystrix 的消费端配置监控路径,我们这里消费端是 spring-cloud-consul-consumer, 所以修改它的启动类。
ConsuleConsumerApplication.java
    // 此配置是为了服务监控而配置,与服务容错本身无关,
    // ServletRegistrationBean因为springboot的默认路径不是"/hystrix.stream",
    // 只要在自己的项目里配置上下面的servlet就可以了
    @Bean
    public ServletRegistrationBean getServlet() {
        HystrixMetricsStreamServlet streamServlet = new HystrixMetricsStreamServlet();
        ServletRegistrationBean registrationBean = new ServletRegistrationBean(streamServlet);
        registrationBean.setLoadOnStartup(1);
        registrationBean.addUrlMappings("/hystrix.stream");
        registrationBean.setName("HystrixMetricsStreamServlet");
        return registrationBean;
    }
测试效果
先后启动 spring-cloud-consul-producer、 spring-cloud-consul-consumer、spring-cloud-consul-monitor 服务。
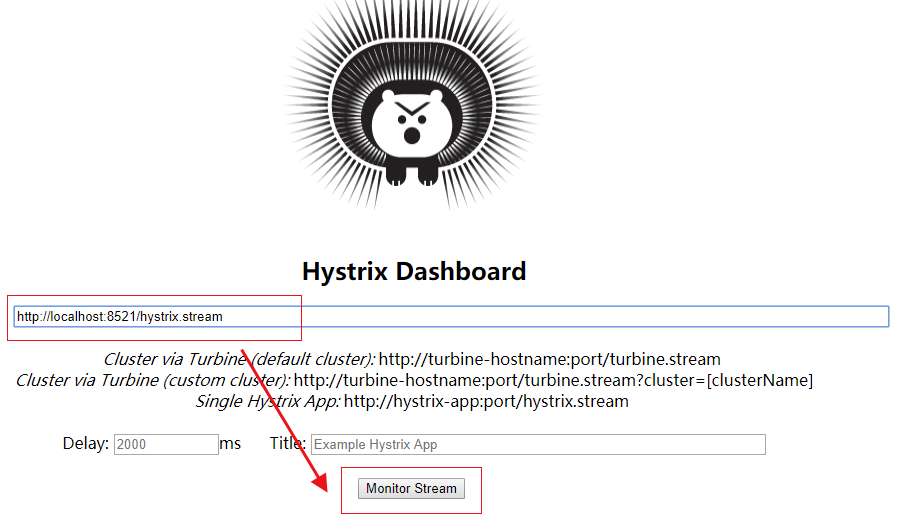
访问 http://localhost:8531/hystrix,会看到如下图所示界面。

此时没有任何具体的监控信息,需要输入要监控的消费者地址及监控信息的轮询时间和标题。
Hystrix Dashboard 共支持三种不同的监控方式:
单体Hystrix 消费者:通过URL http://hystrix-app:port/hystrix.stream 开启,实现对具体某个服务实例的监控。
默认集群监控:通过URL http://turbine-hostname:port/turbine.stream 开启,实现对默认集群的监控。
自定集群监控:通过URL http://turbine-hostname:port/turbine.stream?cluster=[clusterName] 开启,实现对clusterName集群的监控。
我们这里现在是对单体 Hystrix 消费者的监控,后面整合 Turbine 集群的时候再说明后两种的监控方式。
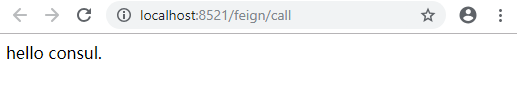
我们先访问 http://localhost:8521/feign/call, 查看要监控的服务是否可以正常访问。
确认服务可以正常访问之后,在监控地址内输入 http://localhost:8521/hystrix.stream,然后点击 Monitor Stream 开始监控。
刚进去,页面先显示 loading... 信息, 多次访问 http://localhost:8521/feign/call 之后,统计图表信息如下图所示。
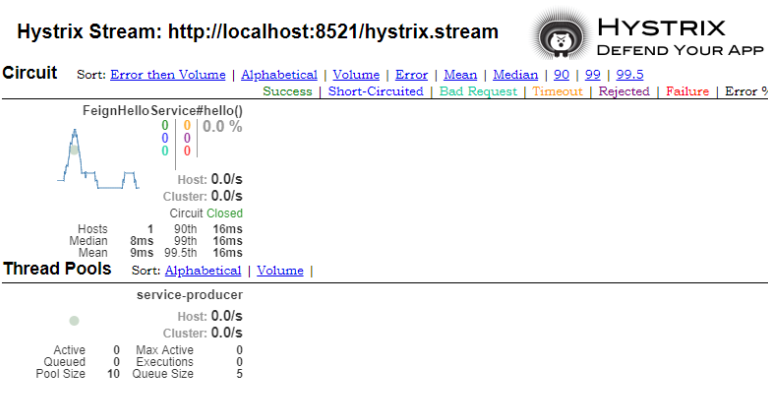
各个指标的含义参见下图。

源码下载
码云:https://gitee.com/liuge1988/spring-cloud-demo.git
作者:朝雨忆轻尘
出处:https://www.cnblogs.com/xifengxiaoma/
版权所有,欢迎转载,转载请注明原文作者及出处。

 浙公网安备 33010602011771号