功能分析
效果图
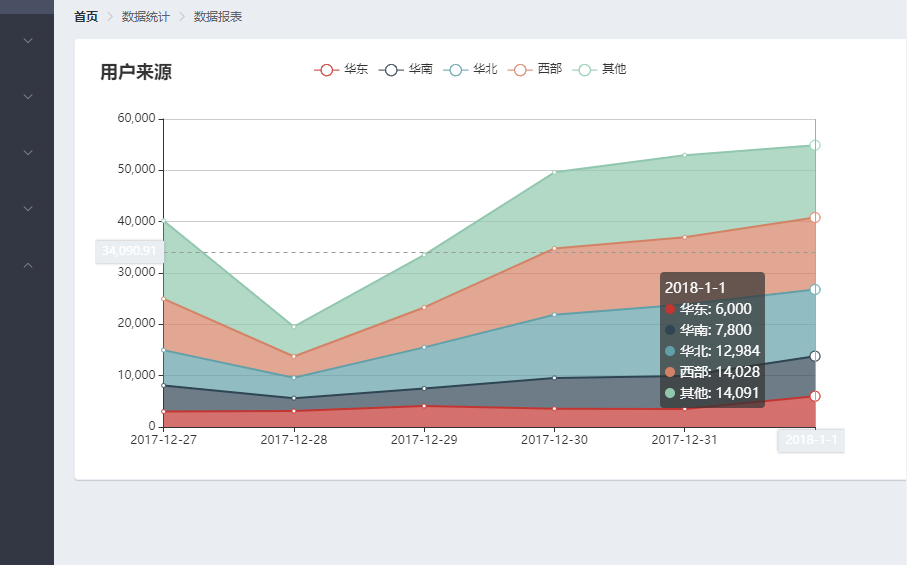
接口定义
代码reports/Report.vue
<template>
  <div>
    <el-breadcrumb separator-class="el-icon-arrow-right">
      <el-breadcrumb-item :to="{ path: '/home' }">首页</el-breadcrumb-item>
      <el-breadcrumb-item>数据统计</el-breadcrumb-item>
      <el-breadcrumb-item>数据报表</el-breadcrumb-item>
    </el-breadcrumb>

    <el-card>
      <div id="main" style="width: 750px;height:400px;"></div>
    </el-card>
  </div>
</template>

<script>
import echarts from "echarts";
import _ from "lodash";

export default {
  data() {
    return {
      option: {
        title: {
          text: "用户来源"
        },
        tooltip: {
          trigger:'axis',
          axisPointer:{
            type:'cross',
            label:{
              backgroundColor:'#E9EEF3'
            }
          }
        },
        grid: {
          left:'3%',
          right:'4%',
          bottom:'3%',
          containLabel:true
        },
        xAxis: [
          {
            boundaryGap:false
          }
        ],
        yAxis: [
          {
            type:'value'
          }
        ]
      }
    };
  },
  async mounted() {
    // 基于准备好的dom,初始化echarts实例
    const myChart = echarts.init(document.getElementById("main"));

    const { data } = await this.$http.get("reports/type/1");
    if (data.meta.status !== 200) {
      return this.$message.error(data.meta.msg);
    }
    // 指定图表的配置项和数据
    // 使用刚指定的配置项和数据显示图表。
    const result = _.merge(data.data, this.option);
    myChart.setOption(result);
  }
};
</script>

<style lang="less" scoped></style>