
关于线性回归的矩阵格式
直接上代码:
 1 x = np.array([1,2,3,4]).reshape(-1,1)
 2 y = np.array([2,4,6,8]).reshape(-1,1)
 3 line = LinearRegression()
 4 line.fit(x, y)
 5 y_predict = line.predict(x)
 6 plt.plot(x, y_predict, "b-")
 7 print("x\n", x)
 8 print("\ny\n", y)
 9 print("line.coef_: ", line.coef_)
10 print("line.intercept_: ", line.intercept_)
x [[1] [2] [3] [4]] y [[2] [4] [6] [8]] line.coef_: [[2.]] line.intercept_: [0.]
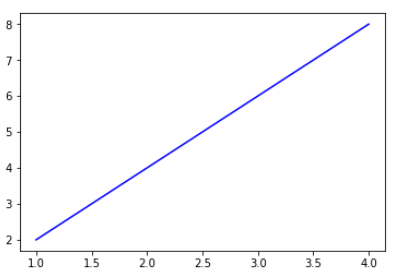
完美,这是非常标准的线性回归的参数形式;看到coef和intercept也是和我们预期是相符的。
下面的是转置之后的数据处理:
 1 x = np.array([1,2,3,4]).reshape(-1,1)
 2 y = np.array([2,4,6,8]).reshape(-1,1)
 3 line = LinearRegression()
 4 line.fit(x.T, y.T)
 5 y_predict = line.predict(x.T)
 6 plt.plot(x.T, y_predict, "r.")
 7 print("x.T\n", x.T)
 8 print("\ny.T\n", y.T)
 9 print("line.coef_: ", line.coef_)
10 print("line.intercept_: ", line.intercept_)
x.T [[1 2 3 4]] y.T [[2 4 6 8]] line.coef_: [[0. 0. 0. 0.] [0. 0. 0. 0.] [0. 0. 0. 0.] [0. 0. 0. 0.]] line.intercept_: [2. 4. 6. 8.]
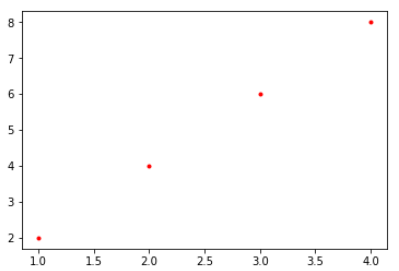
从图上可以看到,学习的结果转变成了四个点(如果plot的参数改为"r-"则什么也不会画出来,因为仅仅是四个点)。学习的结果也和预期完全不一样,权重W为0,截距是y值。
下面继续,我本意是希望x代表月份,y代表销售额,我手头有多个产品的月份-销售额数据,想要一次性把多个多个产品的权重求出来。但是,
 1 x = np.array([[1,2,3,4],[1,2,3,4]])
 2 y = np.array([[2,4,6,8],[4,6,8,10]])
 3 line = LinearRegression()
 4 line.fit(x, y)
 5 y_predict = line.predict(x)
 6 #plt.plot(x.T, y_predict.T)
 7 print("x\n", x)
 8 print("\ny\n", y)
 9 print("line.coef_: ", line.coef_)
10 print("line.intercept_: ", line.intercept_)
x [[1 2 3 4] [1 2 3 4]] y [[ 2 4 6 8] [ 4 6 8 10]] line.coef_: [[0. 0. 0. 0.] [0. 0. 0. 0.] [0. 0. 0. 0.] [0. 0. 0. 0.]] line.intercept_: [3. 5. 7. 9.]
乱了,这里全乱了,尤其是W,怎么成了一个4*4的格式,因为这个是两个产品的月份,我其实期待的是一个两行一列的数据结构。
这里其实就要回到初心了,要明白线性回归本质是矩阵计算,目标Y是一个2*4矩阵,x是一个2*4的矩阵,Y=X.dot(W),这意味着,W要是一个4*4的矩阵,这样X和W相乘才能够保证Y的shape是2*4。
回想一下第一个例子,之所以W实现了1*1,是因为X是4*1,y是4*1,所以W的shape是1*1。
这样,对于线性回归而言我们只能一次性分析一行,无法实现一次性学习多个。


 浙公网安备 33010602011771号