


ELK7.4+filebeat+Redis分析nginx服务访问日志---转载
版本控制
| 版本 | 作者 | 日期 | 修改记录 | 备注 |
|---|---|---|---|---|
| V1.0 | Mr.Wu | 2019-10-13 | 初始创建 | |
一、部署规划
| Ip地址 | 主机名 | 内存配置 | 角色 | 软件版本(yum安装JDK环境即可) |
|---|---|---|---|---|
| 10.1.1.21 | kibana | ≥ 2G | kibana | kibana-7.4.0-x86_64.rpm |
| 10.1.1.22 | elk1 | ≥ 2G | elasticsearch01+es-head插件 | elasticsearch-7.4.0-linux-x86_64.tar |
| 10.1.1.23 | elk2 | ≥ 2G | elasticsearch02 | elasticsearch-7.4.0-linux-x86_64.tar |
| 10.1.1.24 | logs | ≥ 2G | logstash | logstash-7.4.0.rpm |
| 10.1.1.25 | redis | ≥ 1G | redis | yum安装即可 |
| 10.1.1.26 | fbeat | ≥ 1G | nginx+filebeat | filebeat-7.4.0-x86_64.rpm nginx可通过yum安装 |
二、环境说明
1. 系统版本
CentOS Linux release 7.6.1810 (Core) x86_642. 软件版本
2.1 kibana 版本
kibana-7.4.0-x86_64.rpm2.2 elasticsearch 版本
elasticsearch-7.4.0-linux-x86_64.tar2.3 logstash 版本
logstash-7.4.0.rpm2.4 filebeat 版本
filebeat-7.4.0-x86_64.rpm3. 系统初始化
3.1 关闭防火墙及selinx
在所有虚拟机上进行以下操作:
# systemctl stop iptables
# sed -i '/SELINUX=enforcing/cSELINUX=disabled' /etc/selinux/config
3.2 关闭 NetworkManager 服务
在所有虚拟机上进行以下操作:
# systemctl stop NetworkManager
# systemctl disable NetworkManager
3.3 配置ali网络源
在所有虚拟机上进行以下操作:
# vim /etc/yum.repos.d/aliyun.repo
[aliyun]
name=this is aliyun yum
baseurl=http://mirrors.aliyun.com/centos/6/os/x86_64/
enabled=1
gpgcheck=0
三、配置 elasticsearch 集群
1. yum安装 Java 环境
在 elk1 和 elk2 两台虚拟机上进行:
# yum install java -y
# java -version
openjdk version "1.8.0_222-ea"
OpenJDK Runtime Environment (build 1.8.0_222-ea-b03)
OpenJDK 64-Bit Server VM (build 25.222-b03, mixed mode)
2. 下载 elasticsearch 二进制安装包并解压安装
在 elk1 和 elk2 两台虚拟机上进行:
# wget https://artifacts.elastic.co/downloads/elasticsearch/elasticsearch-7.4.0-linux-x86_64.tar.gz
# tar xf elasticsearch-7.4.0-linux-x86_64.tar.gz -C /usr/local
# cd /usr/local
# mv elasticsearch-7.4.0/  elasticsearch
3. 修改 elk1 的配置文件
[root@elk1 /]# vim /usr/local/elasticsearch/config/elasticsearch.yml*** elk1 配置文件解析
[root@elk1 /]# grep -Ev '^$|^#' /usr/local/elasticsearch/config/elasticsearch.yml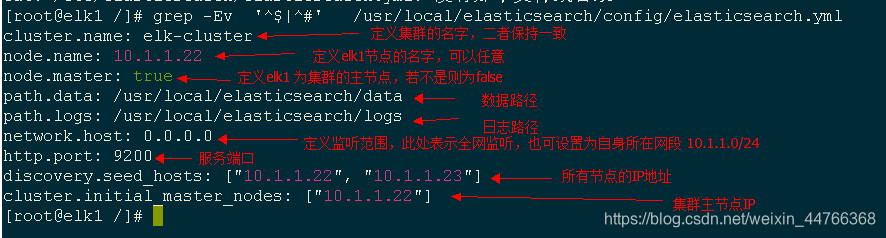
4. 修改 elk2 的配置文件
[root@elk2 /]# vim /usr/local/elasticsearch/config/elasticsearch.yml*** elk2 配置文件解析
[root@elk2 /]# grep -Ev '^$|^#' /usr/local/elasticsearch/config/elasticsearch.yml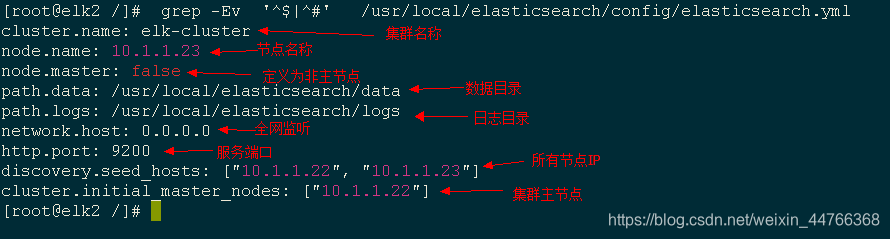
5. 启动 es 集群
在 elk1 和 elk2 两台虚拟机上进行:
# useradd -s /sbin/nologin -r elk
# chown -R elk. /usr/local/elasticsearch/
# sudo -u elk /usr/local/elasticsearch/bin/elasticsearch -d

查看端口
# netstat -ntlup |grep java
*** 服务启动故障排错
故障1: [1]: max file descriptors [4096] for elasticsearch process is too low, increase to at least [65535]
排除: 修改/etc/security/limits.conf文件,增加以下两行配置,重新执行启动任务
*    soft    nofile          65536
*    hard    nofile          65536

故障2: [2]: max virtual memory areas vm.max_map_count [65530] is too low, increase to at least [262144]
排除:	修改/etc/sysctl.conf文件,增加配置vm.max_map_count=262144,保存退出后执行 sysctl -p 生效

故障3: [3]: max number of threads [3795] for user [elk] is too low, increase to at least [4096]
排除: 修改配置文件/etc/security/limits.conf(和问题1是一个文件),增加以下两行配置,保存退出
*    soft    noproc          4096
*    hard    noproc          4096
6. 测试集群状态
在任意 elk1 或 elk2 虚拟机上执行以下命令或通过浏览器访问 [elk1.ip:9200  / elk2.ip:9200]
# curl http://10.1.1.22:9200/_cluster/health?pretty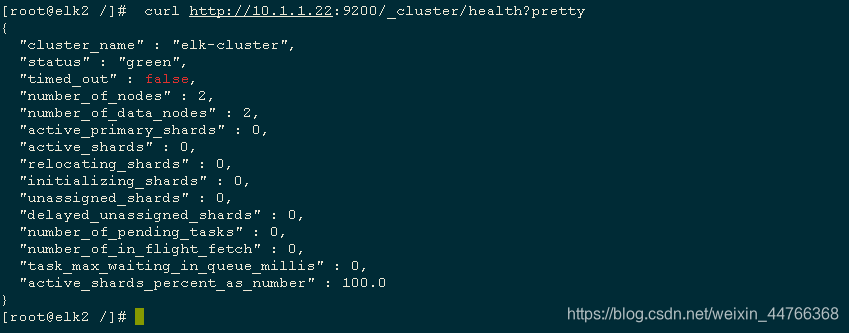
四、在 elk1 部署 elasticsearch-head 插件
1. 下载安装 nodejs 以获取 npm 模块
[root@elk1 ~]# wget https://nodejs.org/dist/v10.16.3/node-v10.16.3-linux-x64.tar.xz
[root@elk1 ~]# tar xf node-v10.15.0-linux-x64.tar.xz -C /usr/local/
[root@elk1 ~]# cd /usr/local/
[root@elk1 local]# mv node-v10.15.0-linux-x64/   nodejs
[root@elk1 local]# ln -s /usr/local/nodejs/bin/npm /bin/npm
[root@elk1 local]# ln -s /usr/local/nodejs/bin/node /bin/node
2. 下载 elasticsearch-head 并安装
[root@elk1 ~]# wget https://github.com/mobz/elasticsearch-head/archive/master.zip
[root@elk1 ~]# unzip master.zip -d /usr/local
[root@elk1 ~]# cd /usr/lcoal && mv elasticsearch-head-master/  es-head/
[root@elk1 local]# cd es-head/ &&  npm install -g grunt-cli
[root@elk1 es-head]# npm install
*** 错误排除
错误1: 执行 npm install -g grunt-cli 时提示 /usr/bin/env: node: 不是目录
排除: 在执行该命令时会同时调用node模块,而node模块调用的命令不在环境变量中,故将node调用命令链接至环境变量即可: ln -s /usr/local/nodejs/bin/node /bin/node

错误2: 执行 ‘ npm install’ 时出现多个 "ERR"
排除方法1: 出现该原因是因为缺省了相应的类库,执行命令 npm install phantomjs-prebuilt -save 安装缺少的类库,随后重新执行前项任务;
排除方法2: 执行 npm install phantomjs-prebuilt@2.1.16 --ignore-script 忽略相关类库,直接进行安装。
3. 配置 elasticsearch 与 es-head 软件关联并重启
[root@elk1 es-head]# echo -e http.cors.enabled: true'\n'http.cors.allow-origin: "*">>/usr/local/elasticsearch/config/elasticsearch.yml
[root@elk1 es-head]# pkill java
[root@elk1 es-head]# sudo -u elk /usr/local/elasticsearch/bin/elasticsearch -d

[root@elk2 es-head]# echo -e http.cors.enabled: true'\n'http.cors.allow-origin: "*">>/usr/local/elasticsearch/config/elasticsearch.yml
[root@elk2 es-head]# pkill java
[root@elk2 es-head]# sudo -u elk /usr/local/elasticsearch/bin/elasticsearch -d
4. 启动 es-head
必须在es-head所在的安装目录下执行以下启动命令
[root@elk1 es-head]# nohup npm run start &
[root@elk1 es-head]# lsof -i:9100
5. 测试
浏览器访问 http://es-head节点IP:9100 ,并在下面的地址里把localhost改为es-head节点IP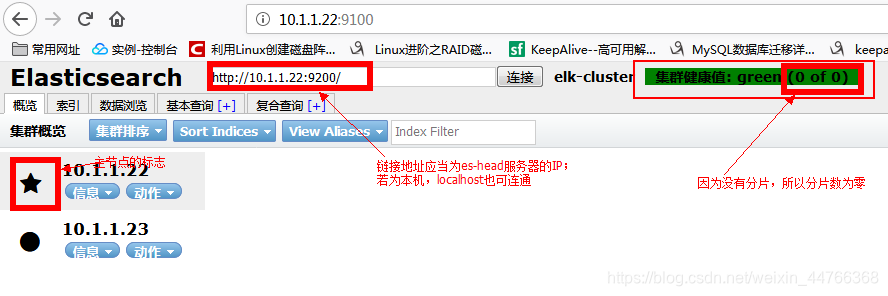
五、部署安装 logstash 并测试
1. 下载安装 logstash
[root@logs ~]# yum install java -y
[root@logs ~]# wget https://artifacts.elastic.co/downloads/logstash/logstash-7.4.0.rpm
[root@logs ~]# rpm -ivh logstash-7.4.0.rpm
2. 修改 logstash 的配置文件
[root@logs ~]# vim /etc/logstash/logstash.yml
[root@logs ~]# grep -Ev '^$|^#' /etc/logstash/logstash.yml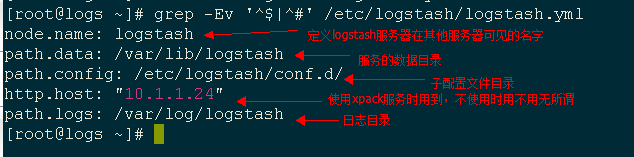
3. 启动测试
将标准输入作为标准输出进行测试
[root@logs ~]# /usr/share/logstash/bin/logstash -e 'input {stdin {}} output {stdout {}}'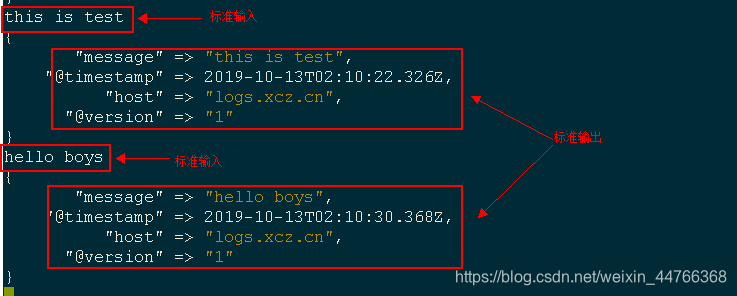
测试成功,等待数据接入
六、 部署安装 kibana 并测试
1. 下载安装 kibana
[root@kibana ~]# wget https://artifacts.elastic.co/downloads/kibana/kibana-7.4.0-x86_64.rpm
[root@kibana ~]# rpm -ivh kibana-7.4.0-x86_64.rpm
2. 修改 kibana 配置文件
[root@kibana ~]# vim /etc/kibana/kibana.yml
[root@kibana ~]# grep -Ev '^$|^#' /etc/kibana/kibana.yml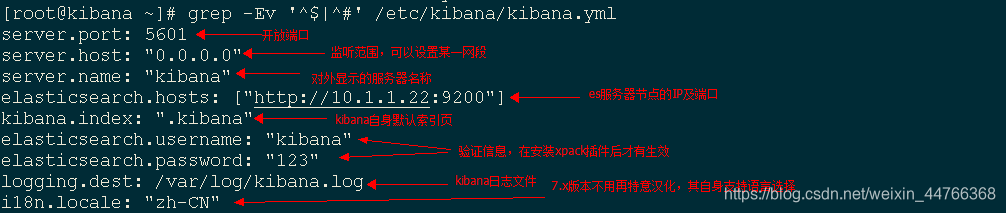
kibana软件安装时默认添加系统用户 kibana ,不自动创建日志文件
创建日志文件
[root@kibana ~]# id kibana
uid=997(kibana) gid=995(kibana) 组=995(kibana)
[root@kibana ~]# touch /var/log/kibana.log
[root@kibana ~]# chown kibana.   /var/log/kibana.log
3. 启动服务
[root@kibana ~]# systemctl start kibana
[root@kibana ~]# lsof -i:5601
4. web访问进行启动测试
通过浏览器访问 http://10.1.1.21:5601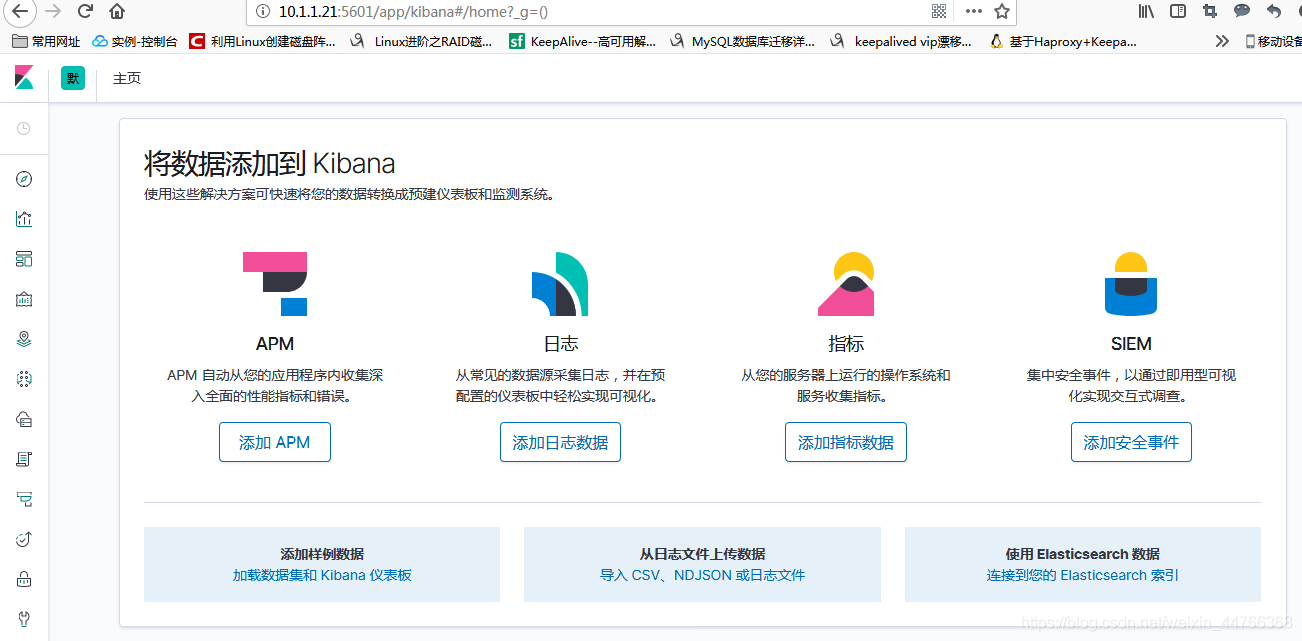
5. 通过 es-head 查看es集群与 kibana 的连接性
浏览器访问 es-head 节点服务器IP及对应端口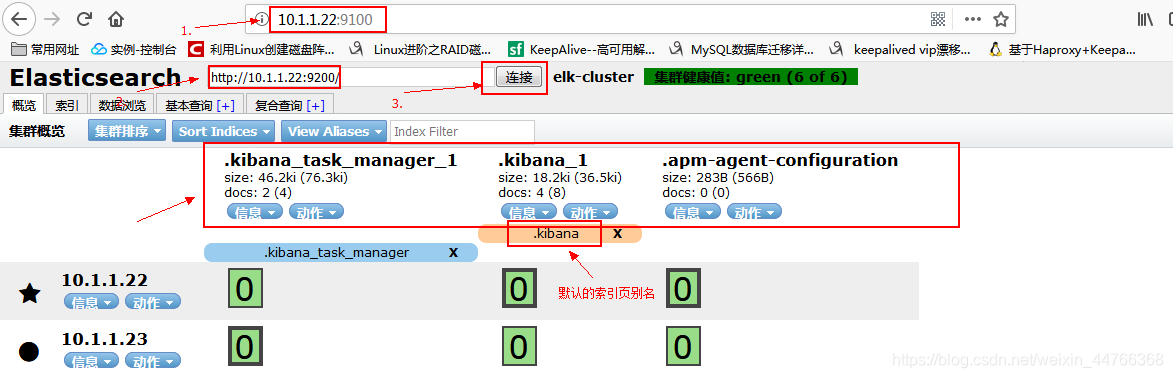
测试成功,等待数据接入
七、 部署安装 redis
1. yum安装redis
配置epel源
[root@redis ~]# wget -O /etc/yum.repos.d/epel.repo http://mirrors.aliyun.com/repo/epel-7.repo

安装redis
[root@redis ~]# yum install redis -y
2. 修改redis配置文件
[root@redis ~]# vim /etc/redis.conf[root@redis ~]# grep -Ev '^$|^#' /etc/redis.conf
bind 0.0.0.0 # 绑定IP,在这里可仅指定filebeat服务器IP,此处指向全网
protected-mode yes # 保护模式,需配置bind ip或者设置访问密码
port 6379 # 开放端口
tcp-backlog 511 # 确定TCP连接中已完成队列(完成三次握手之后)的长度,默认是511
timeout 0
tcp-keepalive 300 # 死链接检测
daemonize yes # 作为守护进程运行
supervised no
pidfile /var/run/redis_6379.pid # 当Redis以守护进程方式运行时,Redis默认会把pid写入/var/run/redis_6379.pid文件
loglevel notice # 日志记录级别
logfile /var/log/redis/redis.log # 日志文件
databases 16 # redis的数据库数量,排序从0到15
save 900 1 # 数据每900s内变化一次时做一次快照,快照功能默认开启
save 300 10 # 数据每300s内变化10次时做一次快照,快照功能默认开启
save 60 10000 # 数据每一分钟内变化10000次时做一次快照,快照功能默认开启
stop-writes-on-bgsave-error yes # 当bgsave快照操作出错时停止写数据到磁盘
rdbcompression yes # 对于存储到磁盘中的快照进行压缩存储
rdbchecksum yes # 使用CRC64算法来进行数据校验
dbfilename dump.rdb # 快照的文件名
dir /var/lib/redis # 快照文件存放目录
slave-serve-stale-data yes
slave-read-only yes
repl-diskless-sync no
repl-diskless-sync-delay 5
repl-disable-tcp-nodelay no
slave-priority 100
requirepass 123
appendonly no
appendfilename "appendonly.aof"
appendfsync everysec
no-appendfsync-on-rewrite no
auto-aof-rewrite-percentage 100
auto-aof-rewrite-min-size 64mb
aof-load-truncated yes
lua-time-limit 5000
slowlog-log-slower-than 10000
slowlog-max-len 128
latency-monitor-threshold 0
notify-keyspace-events ""
hash-max-ziplist-entries 512
hash-max-ziplist-value 64
list-max-ziplist-size -2
list-compress-depth 0
set-max-intset-entries 512
zset-max-ziplist-entries 128
zset-max-ziplist-value 64
hll-sparse-max-bytes 3000
activerehashing yes
client-output-buffer-limit normal 0 0 0
client-output-buffer-limit slave 256mb 64mb 60
client-output-buffer-limit pubsub 32mb 8mb 60
hz 10
aof-rewrite-incremental-fsync yes具体redis配置详解参考,链接:https://www.cnblogs.com/pqchao/p/6558688.html
此处针对redis的配置只需要进行绑定 IP 操作,其他配置默认即可。
3. 启动redis服务
[root@redis /]# systemctl start redis
[root@redis /]# lsof -i:6379
*** 可能出现的错误
错误: Job for redis.service failed because the control process exited with error code. See "systemctl status redis.service" and "journalctl -xe" for details.
排除: 执行 "journalctl -xe" 命令,发现错误字段 "Can't open the log file: Permission denied",修改日志文件的用户信息"chown redis. /var/log/redis/redis.log",重新执行启动任务
八、 yum安装nginx及rpm安装filebeat
1. 安装 nginx 并测试
1.1 yum安装nginx
[root@fbeat ~]# wget -O /etc/yum.repos.d/epel.repo http://mirrors.aliyun.com/repo/epel-7.repo
[root@fbeat ~]# yum install nginx
1.2 启动 nginx 服务
[root@fbeat ~]# systemctl start nginx
[root@fbeat ~]# lsof -i:80
1.3 web访问测试
浏览器访问nginx服务器IP地址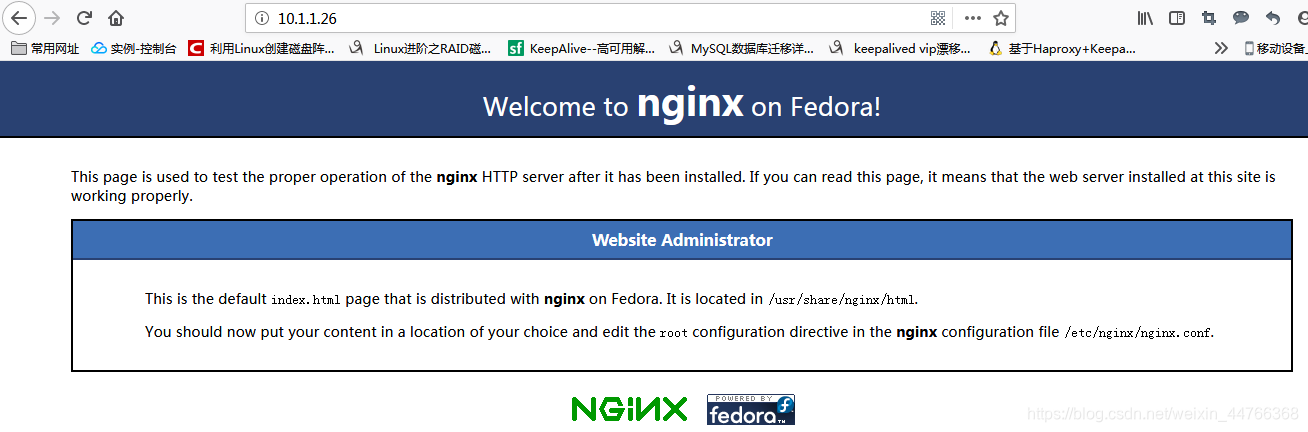
2. 安装并启动测试 filebeat
2.1 下载安装 filebeat
[root@fbeat ~]# wget https://artifacts.elastic.co/downloads/beats/filebeat/filebeat-7.4.0-x86_64.rpm
[root@fbeat ~]# rpm -ivh filebeat-7.4.0-x86_64.rpm
2.2 启动测试
[root@fbeat filebeat]# systemctl start filebeat
[root@fbeat filebeat]# ps -ef |grep filebeat
*** 关于端口
filebeat 是没有指定的端口的,filebeat 通过post 方式将日志推送至指定的output对象。但是当filebeat与传输对象建立连接时,其推送端口与接收日志的服务器端口保持一致。
九、测试filebeat传输 nginx 访问日志给 elasticsearch 集群
提示;
鉴于后面还需要做其他的日志传输测试,这里建议拍摄快照
1. 修改 filebeat 配置文件,将nginx访问日志输出到 es 集群
[root@fbeat filebeat]# vim /etc/filebeat/filebeat.yml
[root@fbeat filebeat]# cat /etc/filebeat/filebeat.yml | grep -v "#" | grep -v "^$"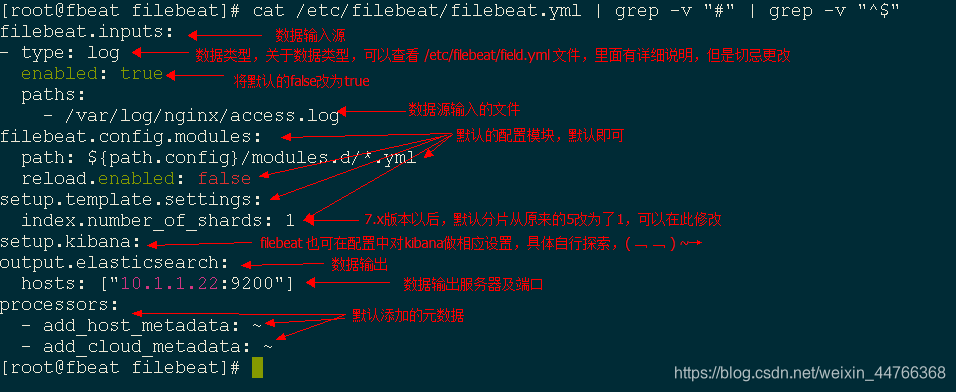
2. 重启 filebeat 服务
[root@fbeat filebeat]# systemctl restart filebeat
[root@fbeat filebeat]# lsof -i:9200
3. 测试 filebeat 与es集群的连接
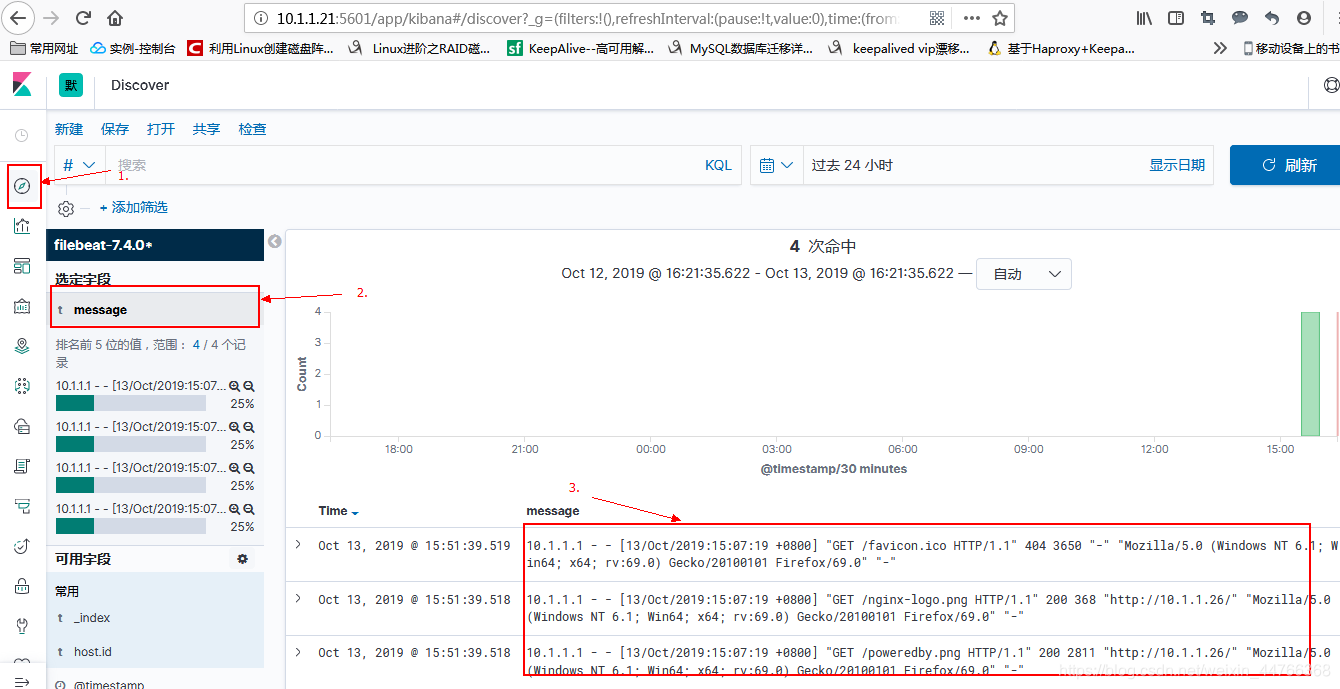
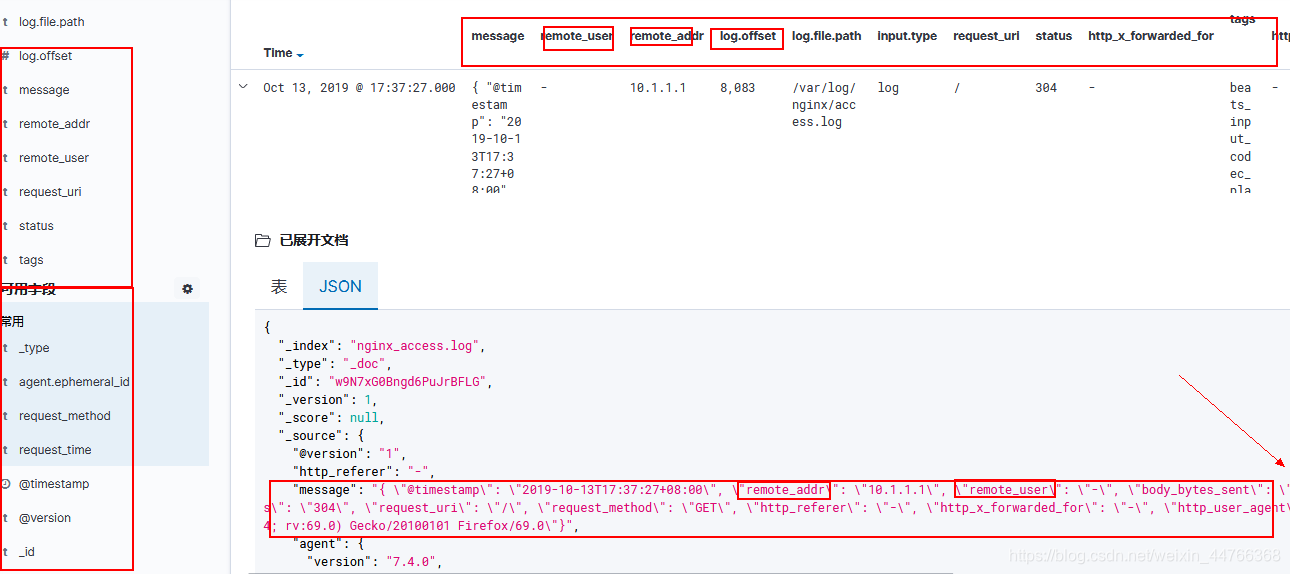
查看 es-head 的web 界面http://10.1.1.22:9100,可以发现以 filebeat命名的新索引页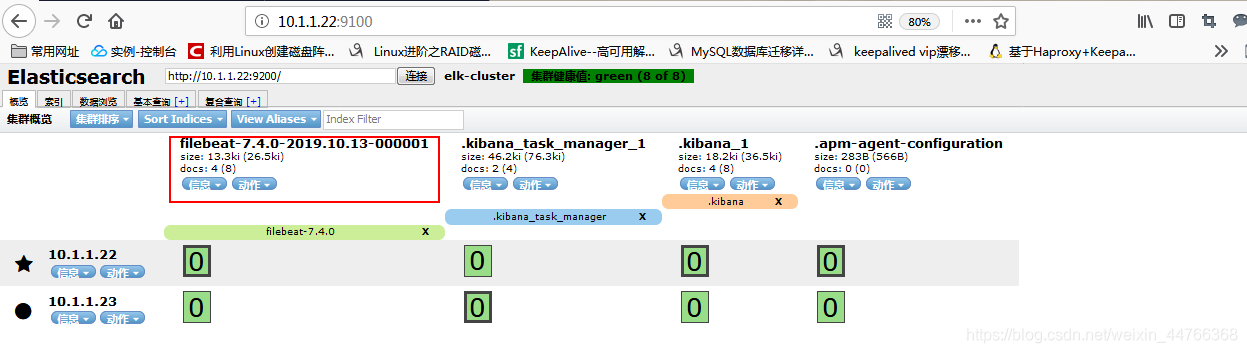
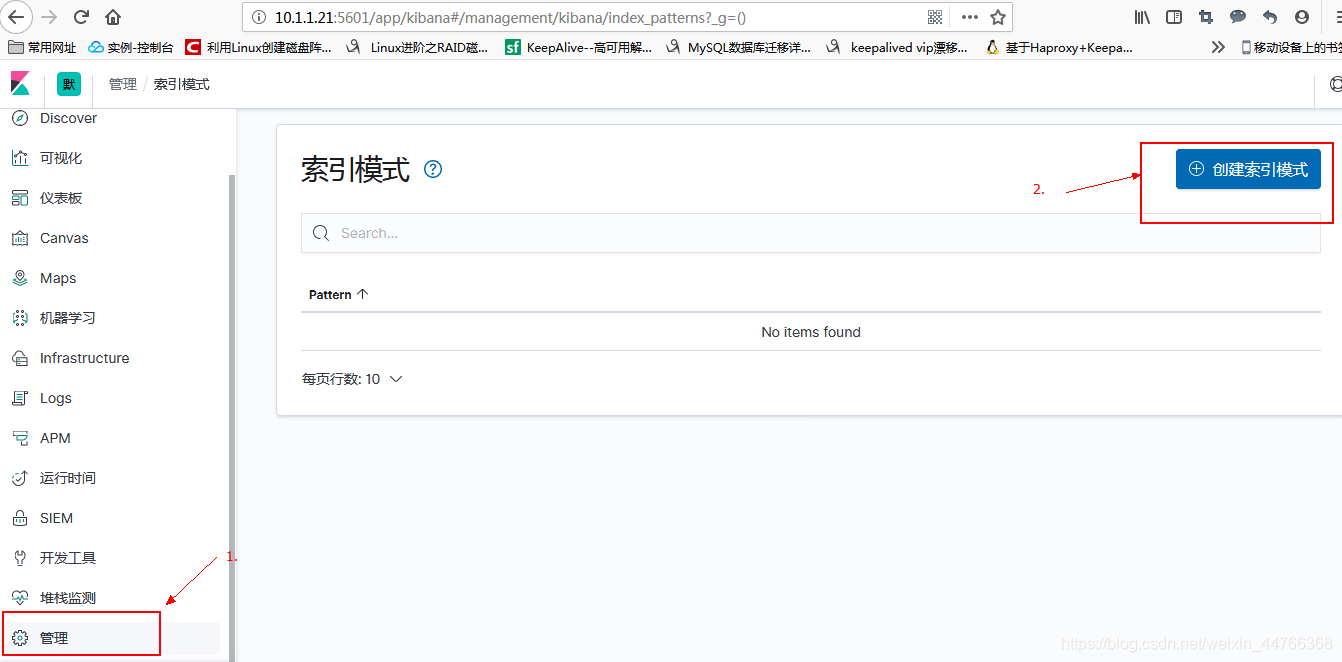
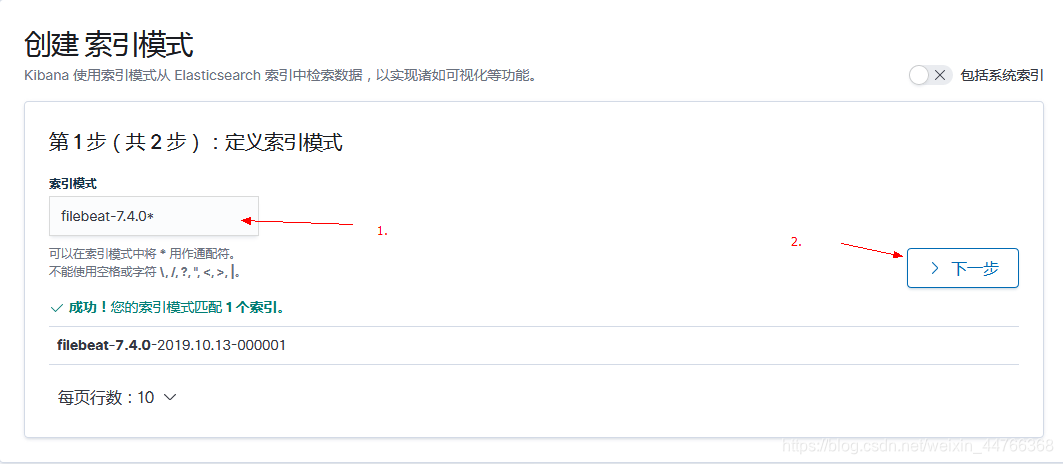
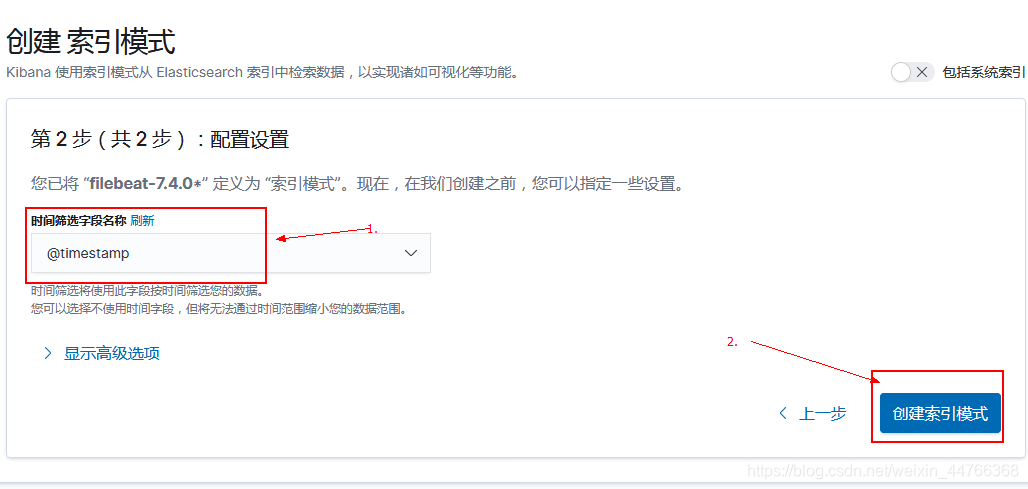
4. 通过 kibana 建立 kibana 索引
十、测试filebeat通过 logstash 传输日志给 es 集群(json插件的应用)
1. 恢复快照,修改filebeat 配置文件
[root@fbeat filebeat]# vim /etc/filebeat/filebeat.yml
[root@fbeat filebeat]# grep -Ev '^$|#'  filebeat.yml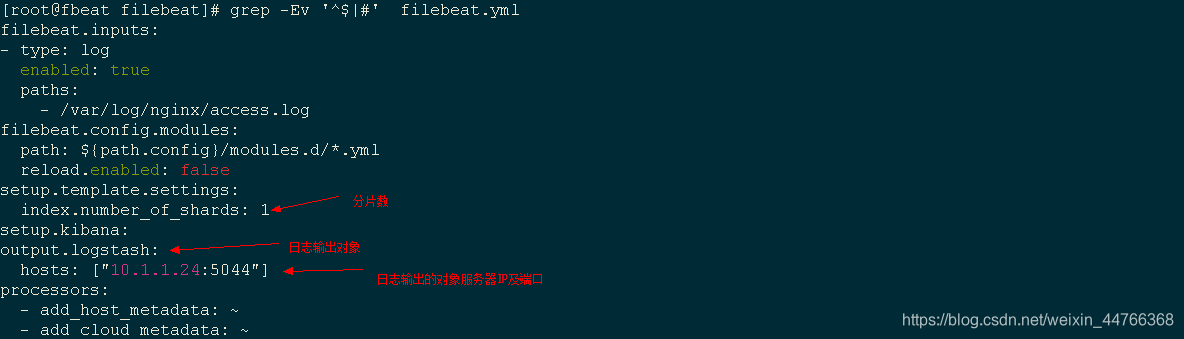
2. 添加 logstash 子配置文件,将日志转化为json格式并传递给es集群
[root@logs /]# vim /etc/logstash/conf.d/nginx_grok.conf
[root@logs /]# cat /etc/logstash/conf.d/nginx_grok.conf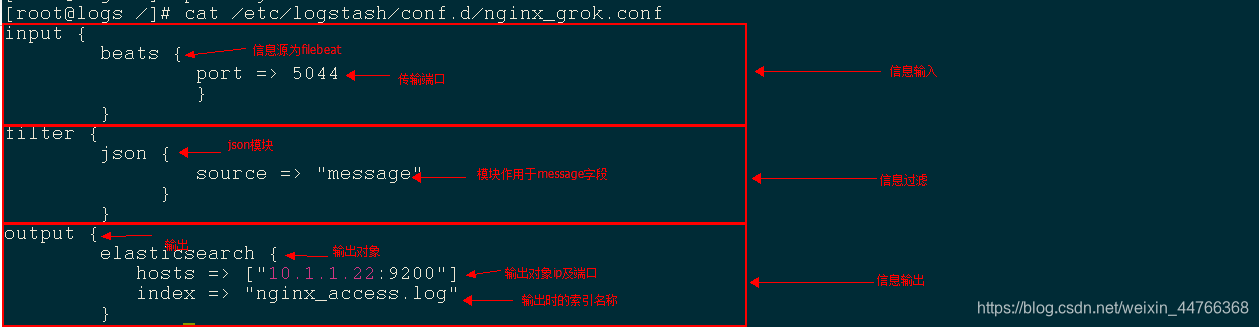
3. 重新定义 nginx 服务的访问日志格式
[root@fbeat nginx]# vim /etc/nginx/nginx.conf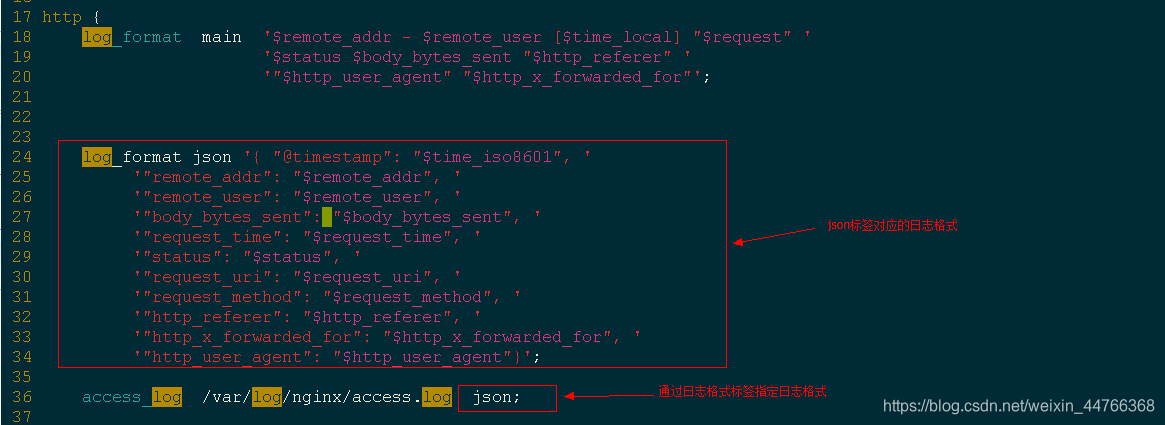
4. 重启nginx --> 启动logstash --> es-head 查看验证
[root@fbeat nginx]# systemctl restart nginx
[root@fbeat nginx]# systemctl restart filebeat
[root@logs /]# /usr/share/logstash/bin/logstash --path.settings /etc/logstash/  -f /etc/logstash/conf.d/nginx_grok.conf &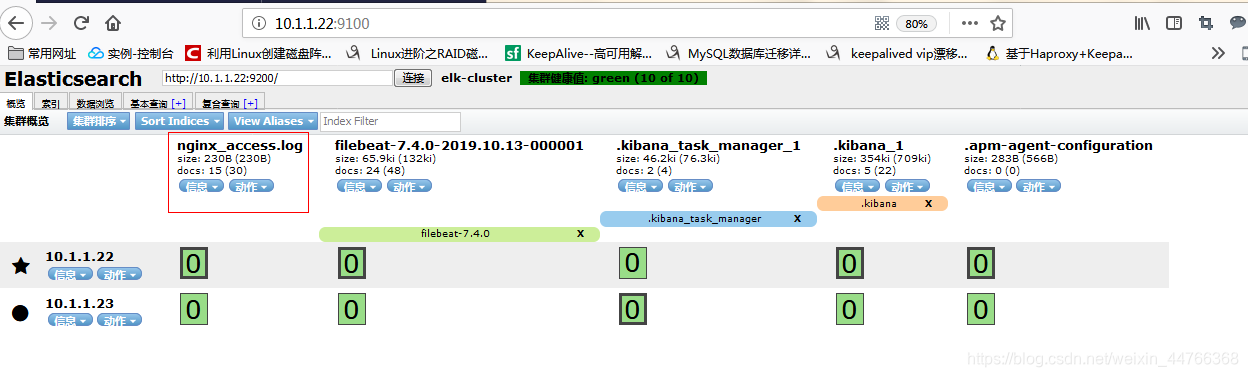
5. kibana 建立索引并查看
十一、ELK+redis+filebeat可视化nginx 独立访客地理位置(geoip与grok插件的应用)
1. 思路;
filebeat 将nginx 访问日志传递给redis --> 创建 logstash 子配置文件定义信息输入源、过滤及输出对象 --> es-head 验证全局连通性 --> kibana 建立可视化图像
2. 还原 nginx 配置文件
将之前测试的 json 形式的日志格式修改为原来的 main
[root@fbeat filebeat]# vim /etc/nginx/nginx.conf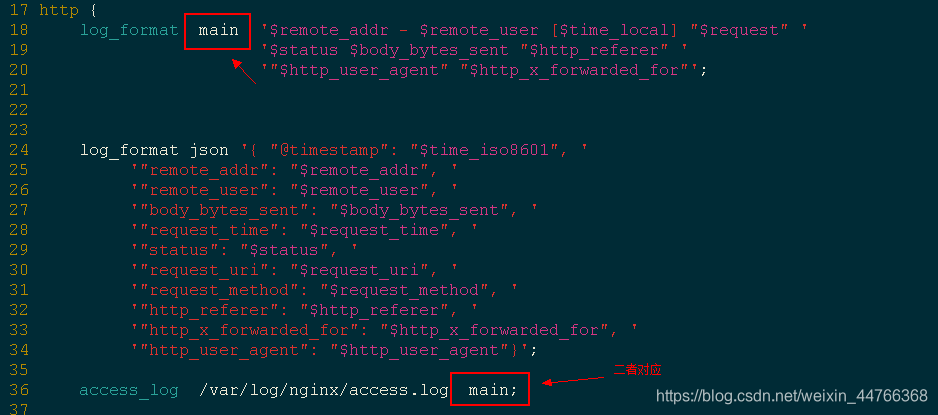
3. 修改 filebeat 配置文件
filebeat 软件支持 redis 作为日志的输出对象,但是默认的配置文件中没有默认的 redis 配置信息,所以需要自己进行添加,添加时注意 .yml 文本的格式对称。
[root@fbeat filebeat]# vim /etc/filebeat/filebeat.yml
[root@fbeat filebeat]# cat /etc/filebeat/filebeat.yml | grep -v "#" | grep -v "^$"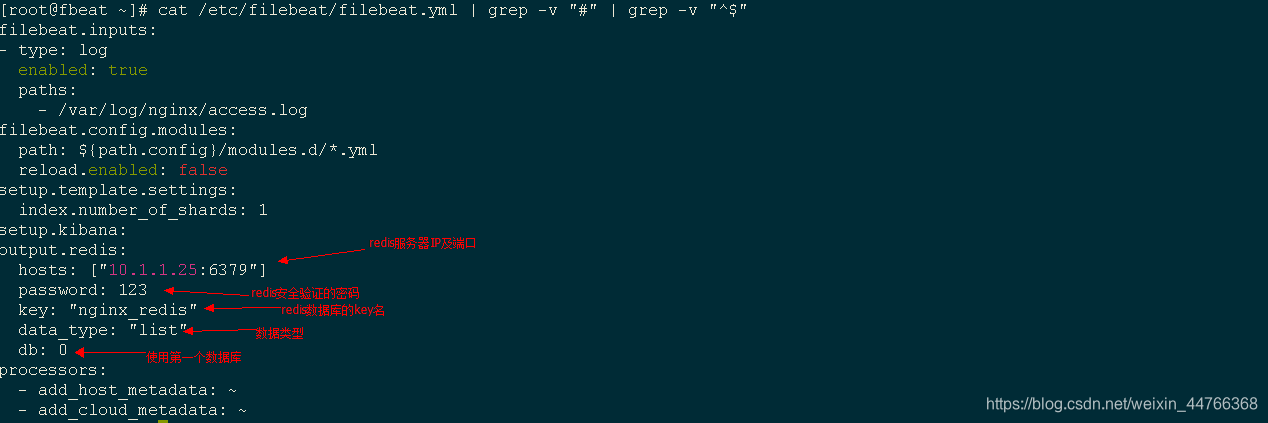
4. logstash 过滤访客地理位置依赖 IP地址库
安装 IP地址库
[root@logs ~]# wget https://geolite.maxmind.com/download/geoip/database/GeoLite2-City.tar.gz
[root@logs ~]# tar xf GeoLite2-City.tar.gz
[root@logs ~]# cd GeoLite2-City_20190625
[root@logs GeoLite2-City_20190625]# cp GeoLite2-City.mmdb   /opt/
4. 创建 logstash 子配置文件
[root@logs /]# vim /etc/logstash/conf.d/nginx_redis.conf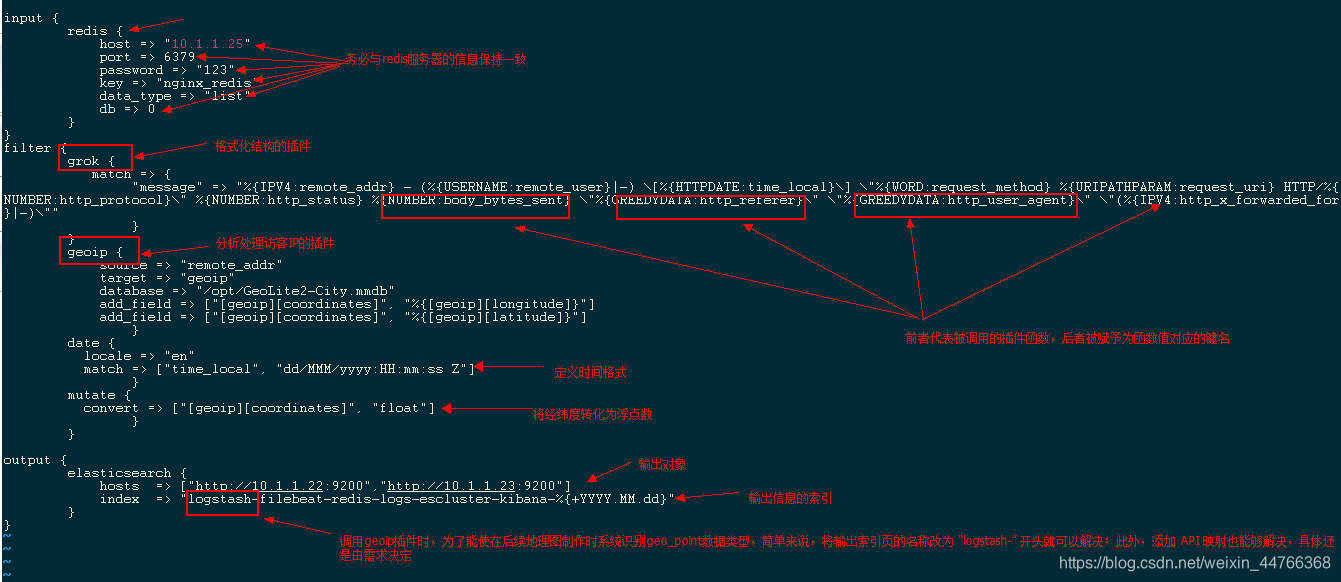
5. 依次重启/启动服务
5.1 重启nginx
[root@fbeat nginx]# systemctl restart nginx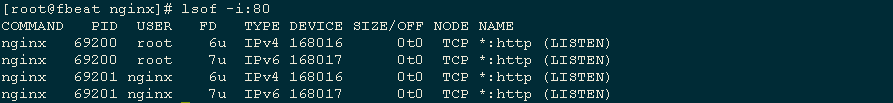
5.2 启动 redis
[root@redis /]# systemctl restart redis
5.3 重启 logstash
[root@logs /]# pkill java
[root@logs /]# /usr/share/logstash/bin/logstash --path.settings /etc/logstash/ -f /etc/logstash/conf.d/nginx_redis.conf &
6. es-head 查看验证
浏览器访问 http://es-head节点IP:9100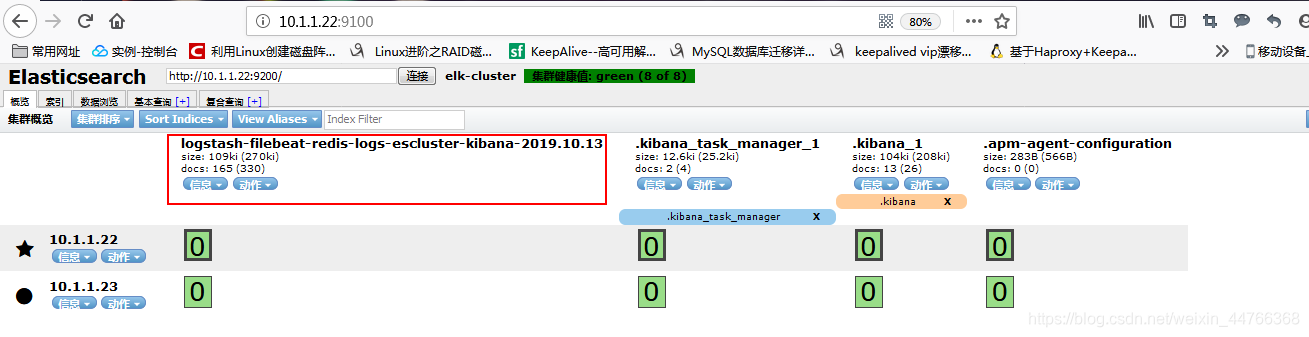
7. 模拟导入外网ip的nginx访问数据
在内网环境下,无法获取外网真实IP,所以为了模拟真实的生产环境,向nginx的访问日志中加入以下数条数据
11.22.33.250 - - [13/Oct/2019:21:07:44 +0800] "GET /poweredby.png HTTP/1.1" 304 0 "http://10.1.1.26/" "Mozilla/5.0 (Windows NT 6.1; Win64; x64; rv:69.0) Gecko/20100101 Firefox/69.0" "-"
15.26.98.54 - - [13/Oct/2019:21:07:44 +0800] "GET /poweredby.png HTTP/1.1" 304 0 "http://10.1.1.26/" "Mozilla/5.0 (Windows NT 6.1; Win64; x64; rv:69.0) Gecko/20100101 Firefox/69.0" "-"
113.224.26.35 - - [13/Oct/2019:21:07:44 +0800] "GET /poweredby.png HTTP/1.1" 304 0 "http://10.1.1.26/" "Mozilla/5.0 (Windows NT 6.1; Win64; x64; rv:69.0) Gecko/20100101 Firefox/69.0" "-"
1.5.65.88 - - [13/Oct/2019:21:07:44 +0800] "GET /poweredby.png HTTP/1.1" 304 0 "http://10.1.1.26/" "Mozilla/5.0 (Windows NT 6.1; Win64; x64; rv:69.0) Gecko/20100101 Firefox/69.0" "-"
22.65.48.97 - - [13/Oct/2019:21:07:44 +0800] "GET /poweredby.png HTTP/1.1" 304 0 "http://10.1.1.26/" "Mozilla/5.0 (Windows NT 6.1; Win64; x64; rv:69.0) Gecko/20100101 Firefox/69.0" "-"
23.65.87.44 - - [13/Oct/2019:21:07:44 +0800] "GET /poweredby.png HTTP/1.1" 304 0 "http://10.1.1.26/" "Mozilla/5.0 (Windows NT 6.1; Win64; x64; rv:69.0) Gecko/20100101 Firefox/69.0" "-"
10.1.25.26 - - [13/Oct/2019:21:07:44 +0800] "GET /poweredby.png HTTP/1.1" 304 0 "http://10.1.1.26/" "Mozilla/5.0 (Windows NT 6.1; Win64; x64; rv:69.0) Gecko/20100101 Firefox/69.0" "-"
15.26.54.79 - - [13/Oct/2019:21:07:44 +0800] "GET /poweredby.png HTTP/1.1" 304 0 "http://10.1.1.26/" "Mozilla/5.0 (Windows NT 6.1; Win64; x64; rv:69.0) Gecko/20100101 Firefox/69.0" "-"
25.49.59.68 - - [13/Oct/2019:21:07:44 +0800] "GET /poweredby.png HTTP/1.1" 304 0 "http://10.1.1.26/" "Mozilla/5.0 (Windows NT 6.1; Win64; x64; rv:69.0) Gecko/20100101 Firefox/69.0" "-"
8. 制作 UV 地理位置图
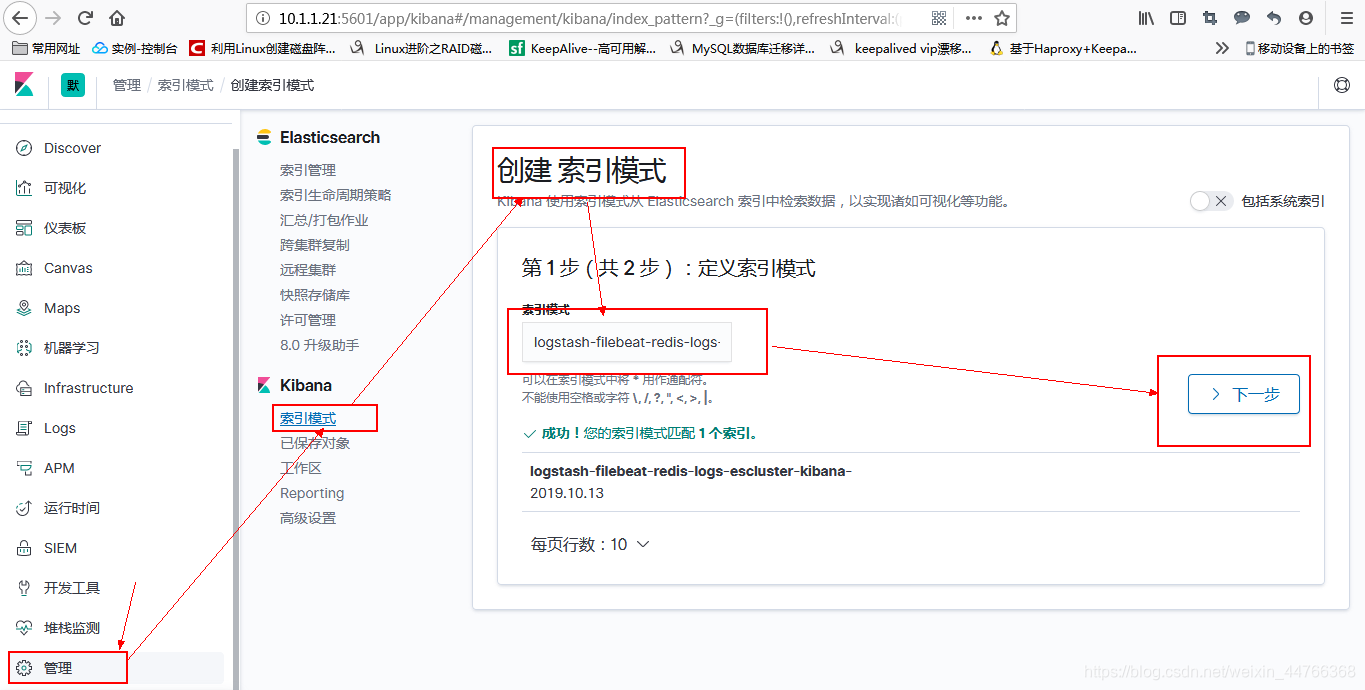
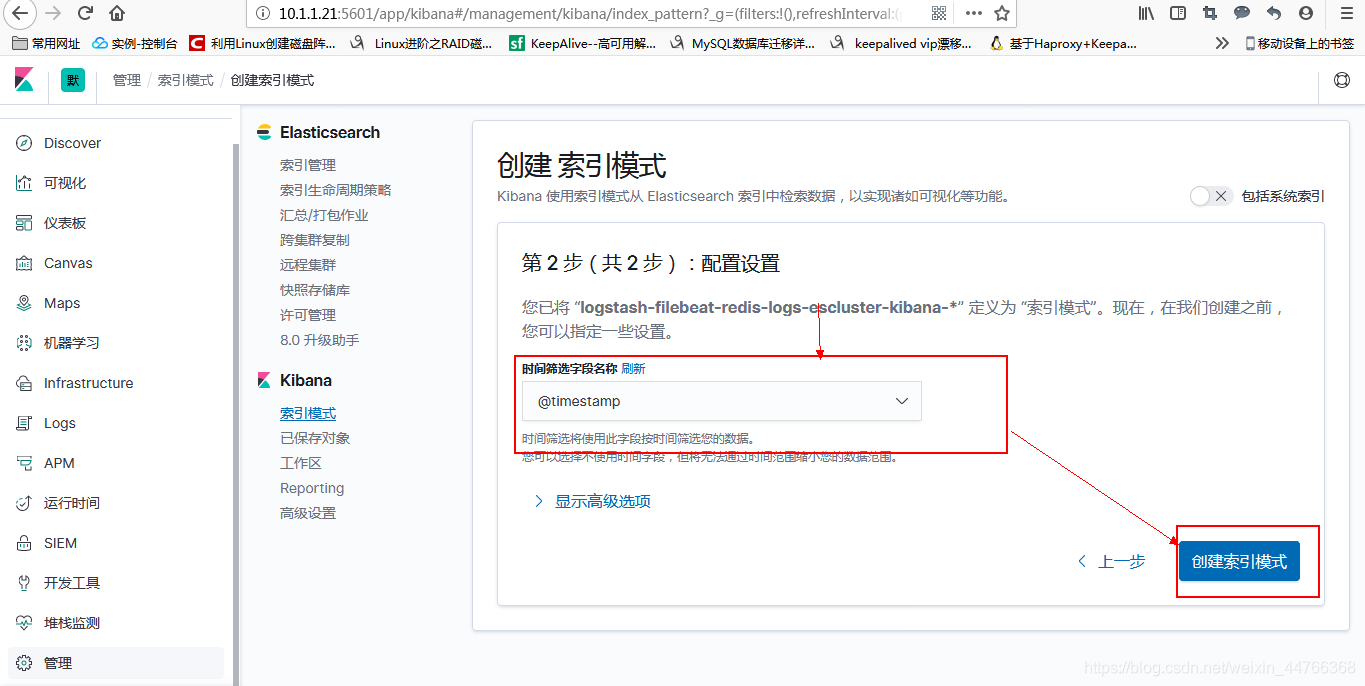
8.1 创建索引模式
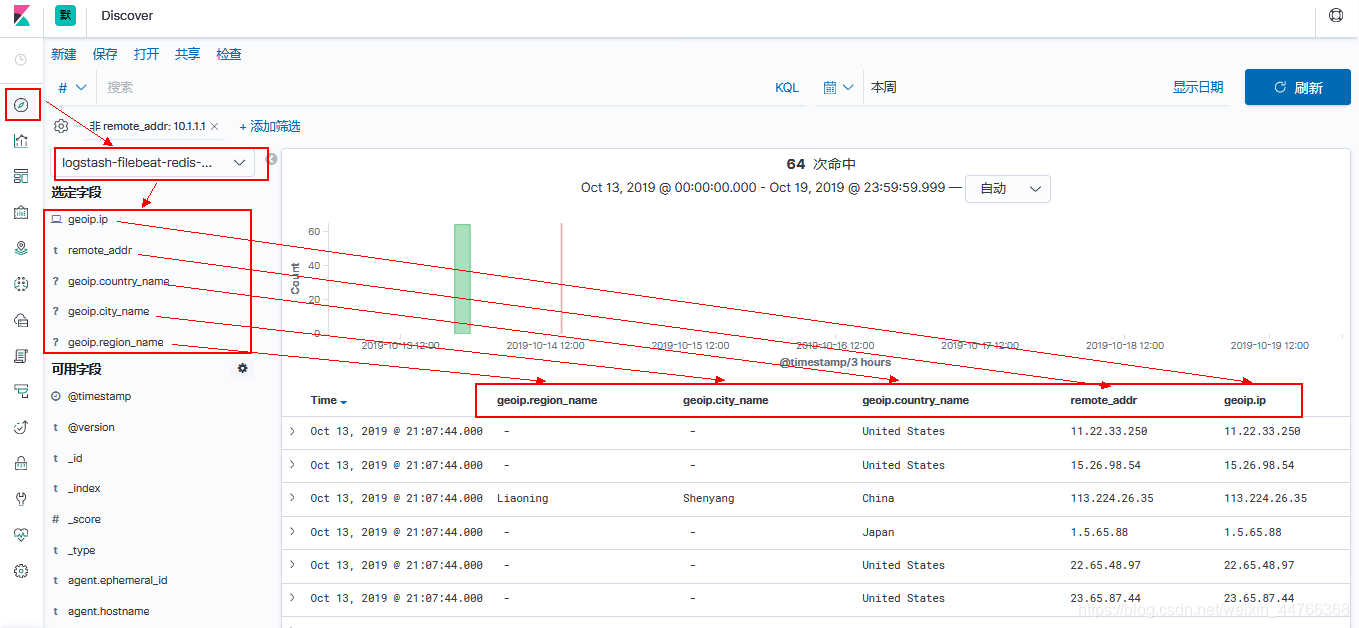
8.2 查看检索索引数据
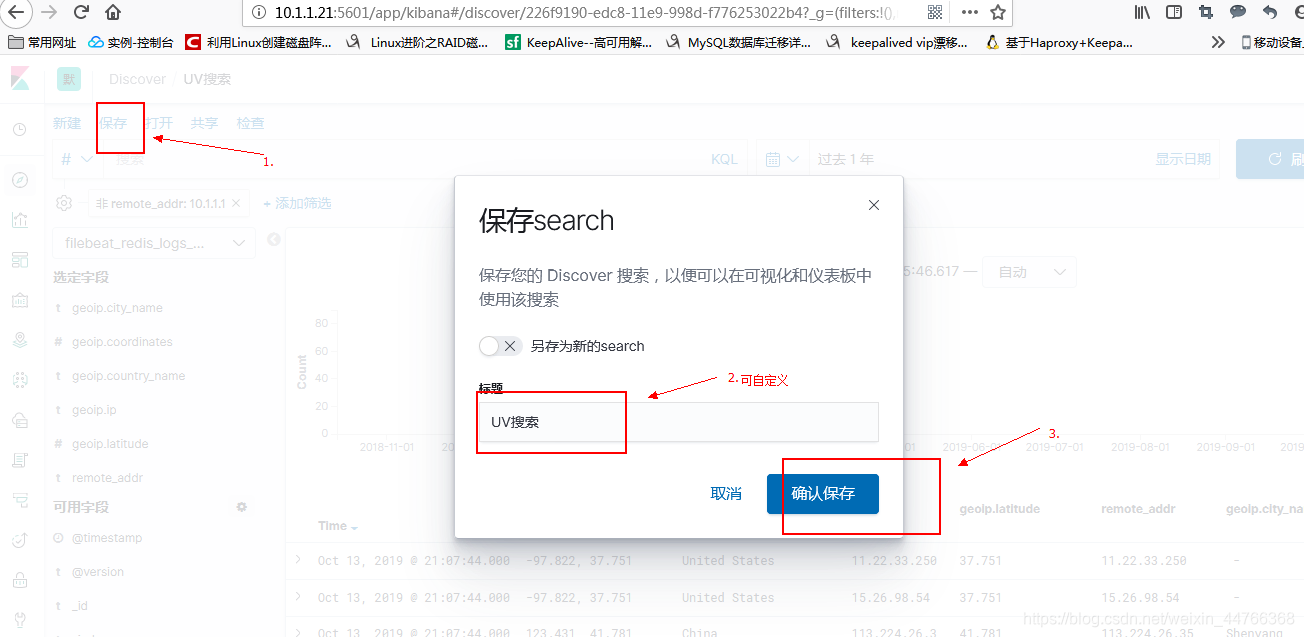
8.3 保存索引搜索
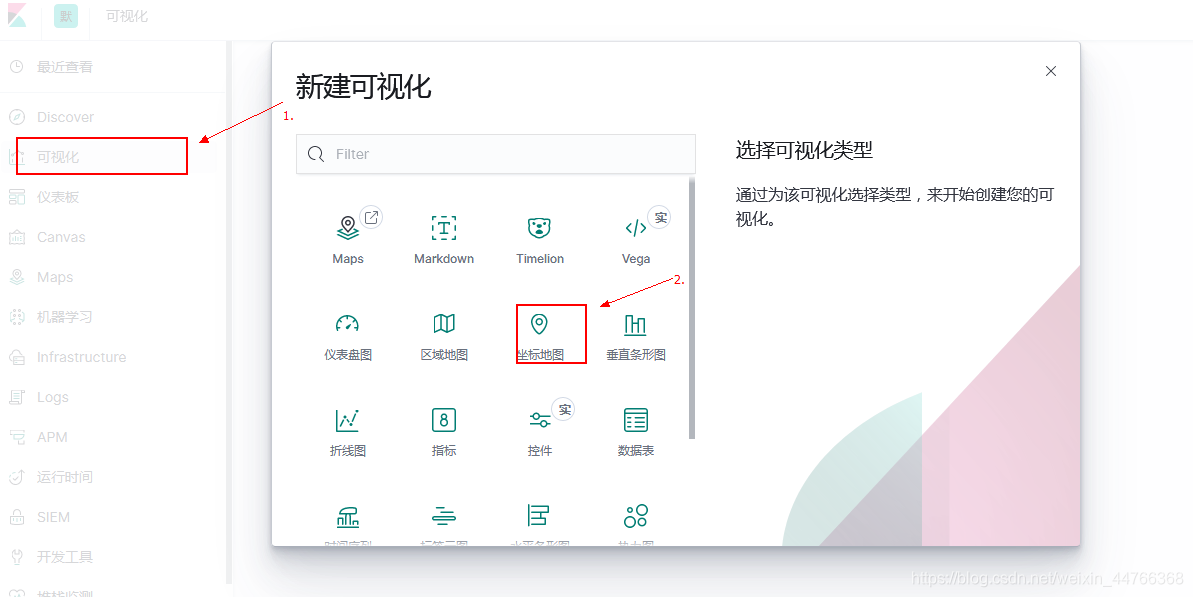
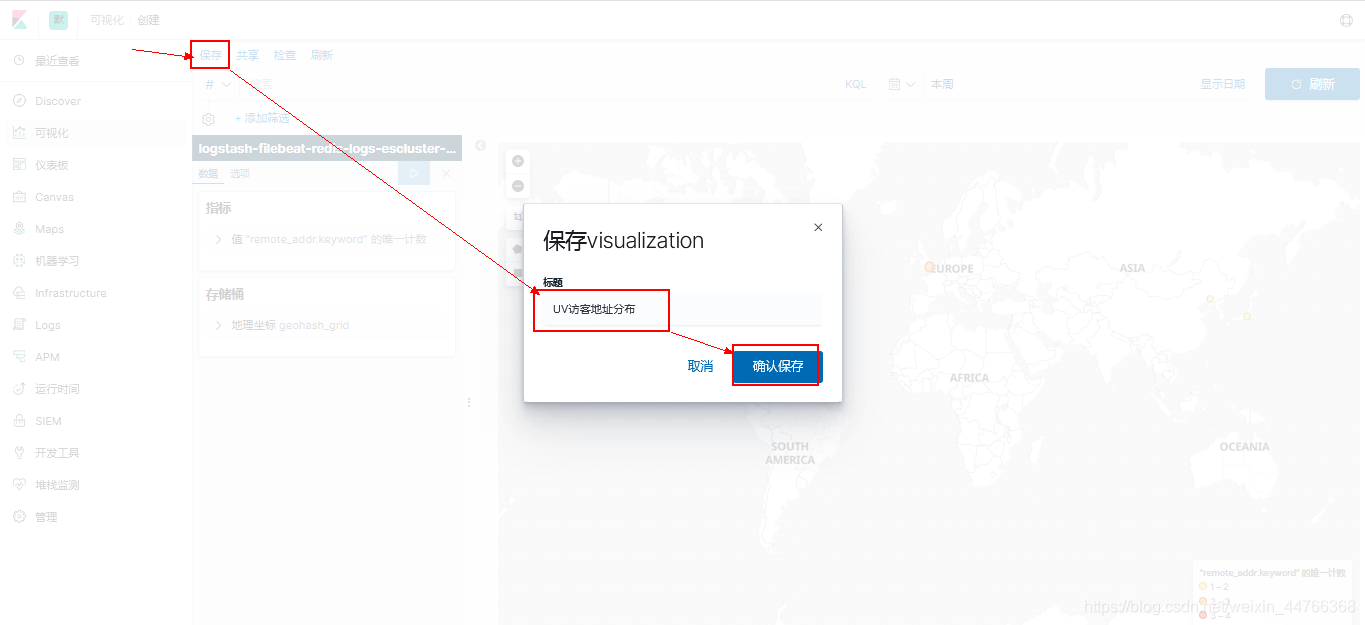
8.4 创建可视化图并保存至
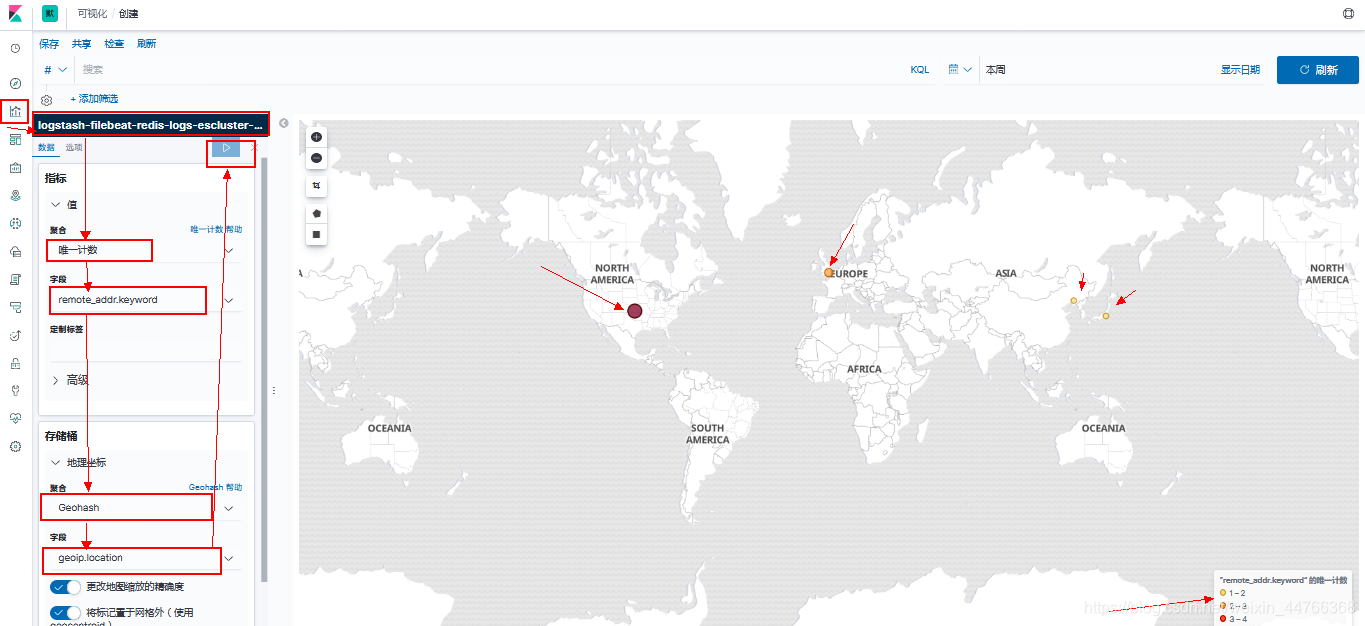
仪表板的操作也类似,具体需求看是什么类型的数据。


 浙公网安备 33010602011771号