# 注意aes(x=wt, y=mpg)中的wt不是字符"wt",因此它是属性字段名(例如,EXCel中字段名有Student,那就是Student,而不是"Student",也就是没有引号,虽然说字段的确是字符型)
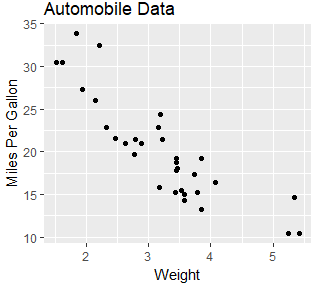
# demo1.r
library(ggplot2)
ggplot(data=mtcars, aes(x=wt, y=mpg)) +
geom_point() +
labs(title="Automobile Data", x="Weight", y="Miles Per Gallon")
![]()
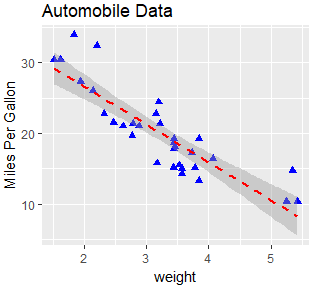
# demo2.r
library(ggplot2)
ggplot(data = mtcars, aes(x = wt, y = mpg)) +
  geom_point(pch = 17, color = "blue", size = 2) +
  geom_smooth(method = "lm", color = "red", linetype = 2) +
  labs(title = "Automobile Data", x = "weight", y = "Miles Per Gallon")
![]()
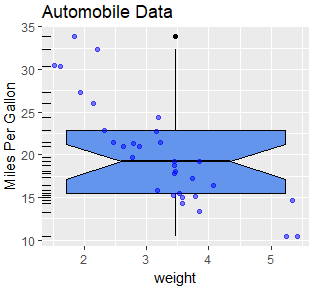
# demo3.r
library(ggplot2)
ggplot(mtcars, aes(x = wt, y = mpg)) +
  geom_boxplot(fill="cornflowerblue",
  color="black", notch=TRUE)+
  geom_point(position="jitter", color="blue", alpha=.5)+
  geom_rug(sides ="l", color="black") +
  labs(title = "Automobile Data", x = "weight", y = "Miles Per Gallon")
![]()
# demo4.r
library(ggplot2)
ggplot(mtcars, aes(x = wt, y = mpg)) +
  geom_violin(fill="lightblue") +
  geom_boxplot(fill="lightgreen", width=.2)  +
  labs(title = "Automobile Data", x = "weight", y = "Miles Per Gallon")
![]()
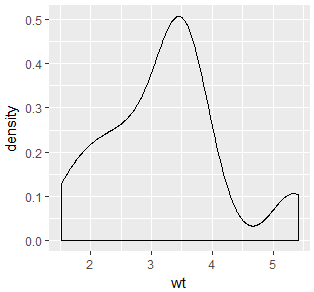
# demo5.r
library(ggplot2)
ggplot(mtcars, aes(x = wt, fill = mpg)) +
  geom_density(alpha=.3)
![]()


 浙公网安备 33010602011771号