

vue中使用echarts图表功能,点击事件改变父级div窗体大小,echarts图表展示也跟着改变
项目中需要使用echarts图表功能。刚开始都是一个echarts图表排成一排。没有内容的时候显得非常空而乱。于是改成一排两个,但是又出现新的问题了。如果查询数据比较多的时候,内容都挤在一起了,非常不友好。于是想到一个可以放大缩小的功能,这样不就很完美了。想法不错,实现起来却遇到了困难。于是网上找,甚至在博客园发问。可能描述不够清晰。
提问连接:https://q.cnblogs.com/q/129882/
这个周末双休,于是在家来实践摸索一下。花了几个小时,总算勉强实现我想要的效果了。
先看看效果,不然不知道我要说什么。
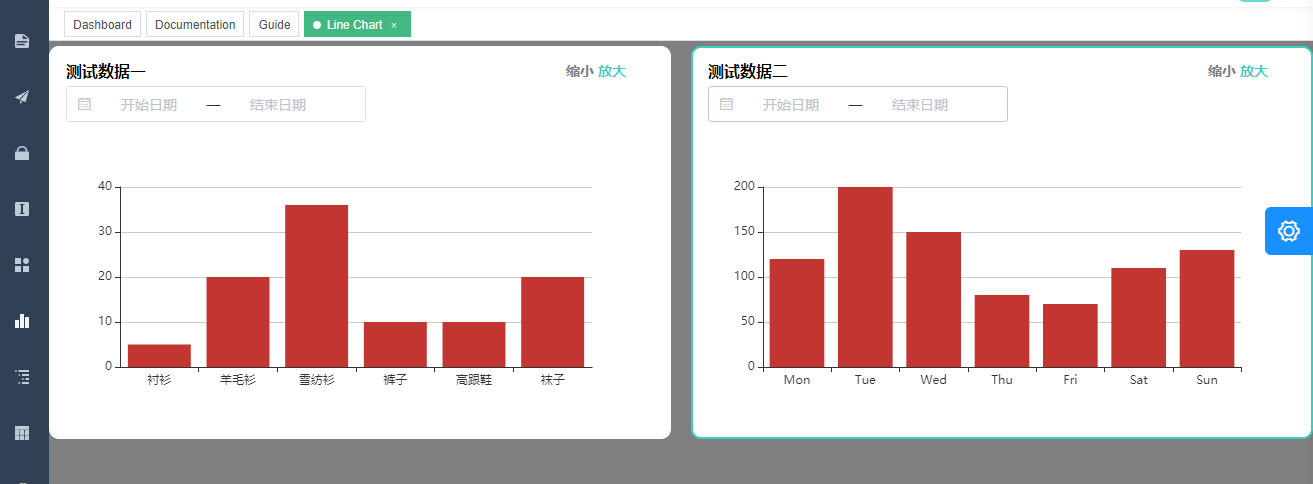
初始状态下的界面
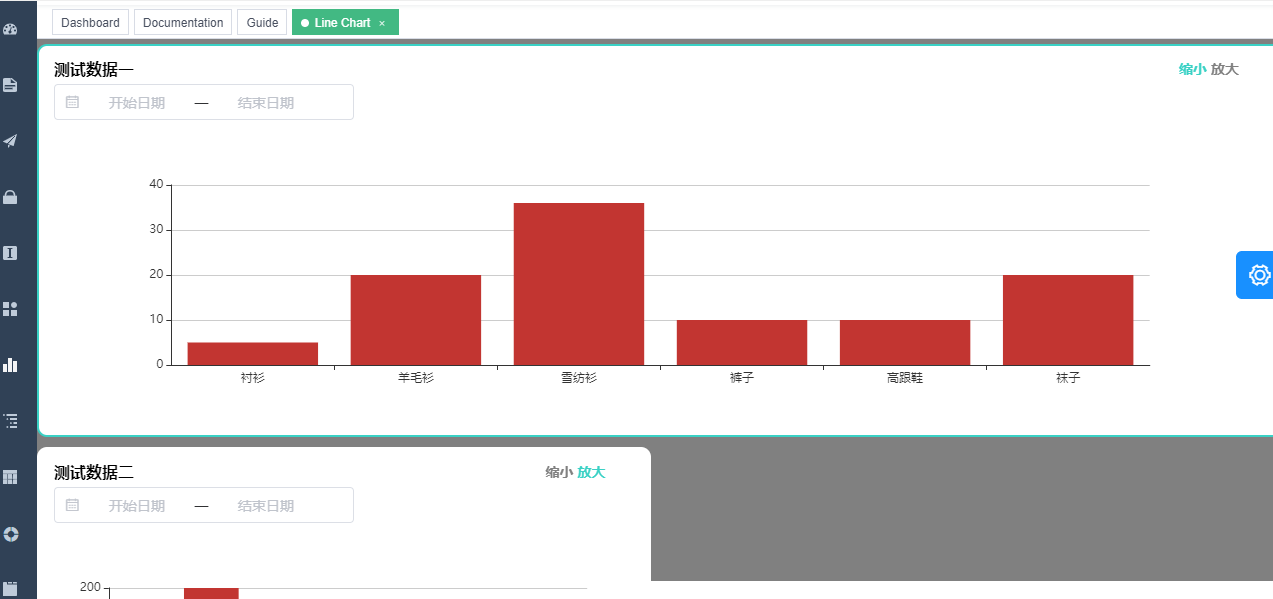
点击第一个放大后的界面
在点击第二个放大效果

点击第一个缩小后的效果
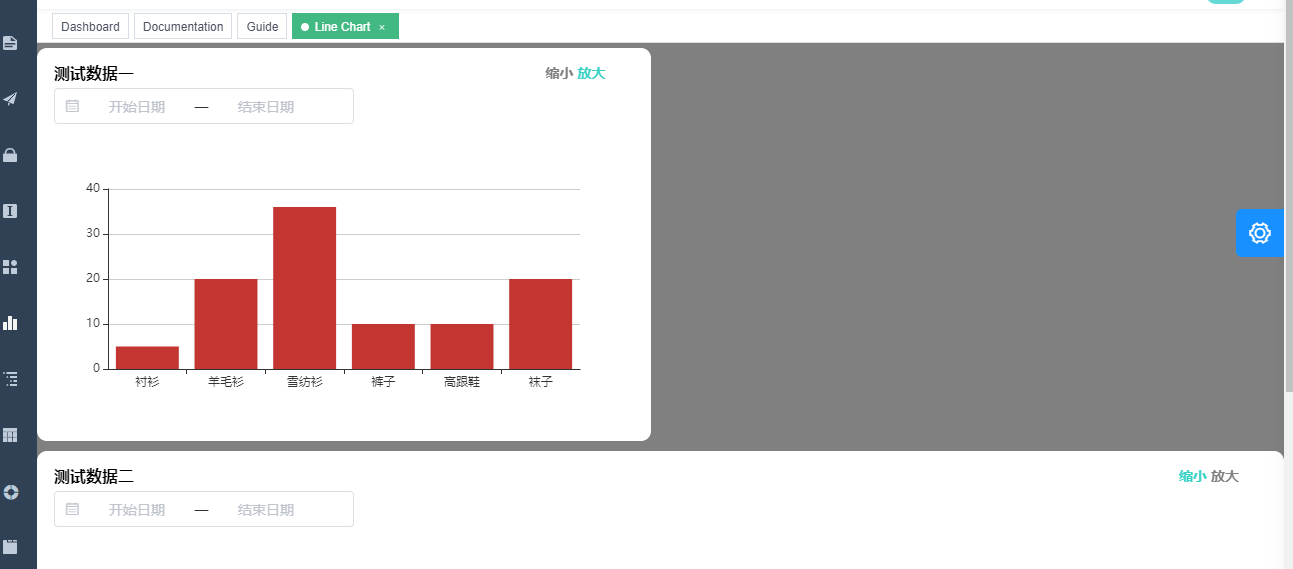
就是这样,每个图表都可以放大缩小,然后改变显示效果。
之前想法是通过事件去改变框架自带的样式——lg属性,后面发现不行。于是自定义了一个样式名来控制,内容是一样的。如果不是vue 我早就想到了。因为以前做过类似的。
这还只是一个demo形式,真正移到项目里还需要做一些调整,改变窗体的时候,echarts图表并没有发生改变。
实践代码,差点忘记添加了。
<template>
  <div class="chart-container">
    <div class="card-item">
         <el-row :gutter="20">


 <el-col :xs="24" :sm="12" :class="chagneclass1==true?'chy-big':''">
             <div class="card-panel">
              <div class="card-panel-content">
                <div class=" chy-datashow" id='gCarWasherNum' name='gCarWasherNum' ref="gCarWasherNum">
                <div class="chart-title">
                  <span>测试数据一</span>
                   <div class="changezoom">
                    <span class="chy-span " :class="chagneclass1==false?'chy-disable':'chy-enable'" @click="change(1,false)">缩小</span>
                    <span class="chy-span " :class="chagneclass1==false?'chy-enable':'chy-disable'" @click="change(1,true)">放大</span>
                  </div>
                </div>
                <div class="chy-datetime">
                      <el-date-picker
                      class="right-data-picker"
                      v-model="monthDateSpan"
                      type="daterange"
                      align="right"
                      unlink-panels
                      range-separator="—"
                      start-placeholder="开始日期"
                      end-placeholder="结束日期"
                      :picker-options="monthPickerOptions"
                      :editable="false"
                    ></el-date-picker>
                </div>
                <div class="chart-wrapper">
                   <!-- <chart height="300px" width="100%" /> -->
                    <div style="width:100%;height:300px" ref="chart1"></div>
                </div>

              </div>
              </div>
            </div>
         </el-col>
     <el-col :xs="24" :sm="12"  :class="chagneclass2==true?'chy-big':''">
             <div class="card-panel">
              <div class="card-panel-content">
                <div class=" chy-datashow" id='gCarWasherNum' name='gCarWasherNum' ref="gCarWasherNum">
                <div class="chart-title">
                  <span>测试数据二</span>
                   <div class="changezoom">
                     <span class="chy-span " :class="chagneclass2==false?'chy-disable':'chy-enable'" @click="change(2,false)">缩小</span>
                     <span class="chy-span " :class="chagneclass2==false?'chy-enable':'chy-disable'" @click="change(2,true)">放大</span>
                  </div>
                </div>
                <div class="chy-datetime">
                      <el-date-picker
                      class="right-data-picker"
                      v-model="monthDateSpan"
                      type="daterange"
                      align="right"
                      unlink-panels
                      range-separator="—"
                      start-placeholder="开始日期"
                      end-placeholder="结束日期"
                      :picker-options="monthPickerOptions"
                      :editable="false"
                    ></el-date-picker>
                </div>
                <div class="chart-wrapper">
                   <!-- <chart height="300px" width="100%" /> -->
                    <div style="width:100%;height:300px" ref="chart2"></div>
                </div>

              </div>
              </div>
            </div>
         </el-col>
    </el-row>
         </div>
  </div>
</template>

<script>
//import Chart from '@/components/Charts/LineMarker'
const echarts = require('echarts');
export default {
  name: 'LineChart',
  //components: { Chart },
  data(){
    return{
      monthPickerOptions: {},
      monthDateSpan: [],
      beginTime:'',
      endTime:'',
      chagneclass1:true,
      chagneclass2:false,
      chart1:null,
      chart2:null

    }
  },
   mounted(){
            this.initCharts();
            this.initCharts2();
           // this.init();
     },
   methods:{
           initCharts () {
               this.chart1 = echarts.init(this.$refs.chart1);
               // 绘制图表
               this.chart1.setOption({
                  // title: { text: '在Vue中使用echarts' },
                   tooltip: {},
                   xAxis: {
                       data: ["衬衫","羊毛衫","雪纺衫","裤子","高跟鞋","袜子"]
                   },
                   yAxis: {},
                   series: [{
                       name: '销量',
                       type: 'bar',
                       data: [5, 20, 36, 10, 10, 20]
                   }]
               });
                   window.addEventListener('resize',function () {//执行
                      this.chart1.resize();
              })
                // 监听侧边栏的变化
               this.sidebarElm = document.getElementsByClassName('sidebar-container')[0]
               this.sidebarElm &&
                this.sidebarElm.addEventListener(
                  'transitionend',
                  function () {//执行
                    this.chart1.resize();
           })
           },
           initCharts2 () {
              this.chart2= echarts.init(this.$refs.chart2);
              // console.log(this.$refs.myPie);
               // 绘制图表
               this.chart2.setOption( {
    xAxis: {
        type: 'category',
        data: ['Mon', 'Tue', 'Wed', 'Thu', 'Fri', 'Sat', 'Sun']
    },
    yAxis: {
        type: 'value'
    },
    series: [{
        data: [120, 200, 150, 80, 70, 110, 130],
        type: 'bar',
        showBackground: true,
        backgroundStyle: {
            color: 'rgba(220, 220, 220, 0.8)'
        }
    }]
});

                window.addEventListener('resize',function () {//执行
                      this.chart2.resize();
              })

                this.sidebarElm = document.getElementsByClassName('sidebar-container')[0]
               this.sidebarElm &&
                this.sidebarElm.addEventListener(
                  'transitionend',
                  function () {//执行
                    this.chart2.resize();
           })
           },

          //  init() {  //关键三   init的时候使用定时器监听窗口的变化,再调用echarts的resize方法
          //      setTimeout(() => {
          //          window.addEventListener('resize', () => {
          //              this.chart.resize();
          //              this.myPie.resize();
          //          })
          //      }, 20)
          //  },

          //  destroyed() {   //关键四   定时清除init带来的定时器
          //      window.removeEventListener('resize', this.init, 20)
          //  },

        change(item,obj){

         if(item=='1'){
            this.chagneclass1=obj
         }
         else if(item=='2'){
            this.chagneclass2=obj
         }
          this.init(item)

          },
        init(item) {  //关键三   init的时候使用定时器监听窗口的变化,再调用echarts的resize方法
               setTimeout(() => {
                 if(item=='1'){
                    this.chart1.resize();
                 }
                 else if(item=='2'){
                    this.chart2.resize();
                 }

               }, 20)
           },
     }
}
</script>

<style scoped lang="scss">
.chart-container{
  position: relative;
  width: 100%;
  height: calc(100vh - 84px);
  background-color: gray;
}

.chy-datashow{
  position: relative;
  .chy-datetime{
    margin: 5px;
    // z-index: 8;
    // position: absolute;
    //   top: 55px;
    //   right: 20px;
    //   text-align: center;
    //   margin: auto;
  }
.chart-title{
  // margin-bottom: 45px;
  margin: 5px;
  font-size: 16px;
  font-weight: bold;
  position:relative;
  width: 100%;
}
.el-date-editor--daterange.el-input, .el-date-editor--daterange.el-input__inner, .el-date-editor--timerange.el-input, .el-date-editor--timerange.el-input__inner {
    width: 300px !important;
 }
}

.card-item{
@media only screen and (min-width: 1200px){

 .chy-big{
     width: 100%;
   }
  .changezoom{
     position:absolute;right:0;top:0;
     width: 100px;
     height: 30px;
     font-size: 14px;

     .chy-span{
       display: inline-block;
       margin: 0 2px;
     }
     .chy-disable{
      color: gray;
     }
    .chy-enable{
        color: #3AD1C5;
     }
  }
}

@media screen and (max-width: 1200px) {
  .changezoom{
    display: none;
  }
  }
    .card-panel:hover{
      border: 2px solid #3AD1C5 !important ;
    }
    .card-panel{
      background-color: white;
      border-radius: 10px;
      border: 2px solid white !important ;
      margin: 5px 0;
  }
  .card-panel-content{
    padding: 10px;
  }
}
.chy_summary{
  position: relative;
    font-size: 16px;
    min-height: 20px;
    top: 55px;
}
</style>
参考:https://blog.csdn.net/qq_34312235/article/details/100920873

 浙公网安备 33010602011771号