


echarts 直接使用和随窗体大小变化
1 代码
<template>
<div class="app-container">
<div class="chart-bg chy-datashow">
<div class="chart-wrapper">
<div class="chart-title">
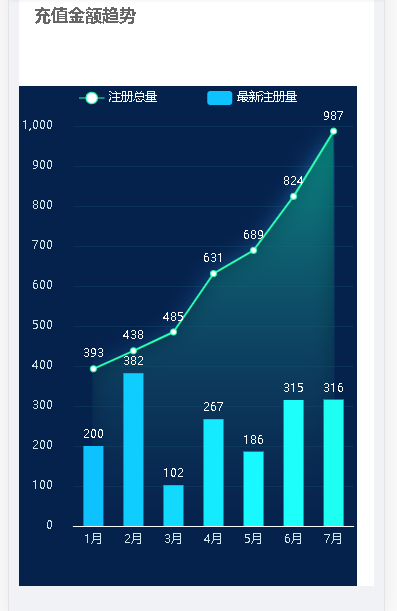
<span>充值金额趋势</span>
</div>
<div style="width:100%;height:500px" ref="chart"></div>
</div>
</div>
</div>
</template>
<script>
const echarts = require('echarts');
export default {
data () {
return {};
},
methods: {
initCharts () {
let myChart = echarts.init(this.$refs.chart);
let option = {
backgroundColor: "#05224d",
tooltip: {},
grid: {
top: '8%',
left: '1%',
right: '1%',
bottom: '8%',
containLabel: true,
},
legend: {
itemGap: 50,
data: ['注册总量' ,'最新注册量'],
textStyle: {
color: '#f9f9f9',
borderColor: '#fff'
},
},
xAxis: [{
type: 'category',
boundaryGap: true,
axisLine: { //坐标轴轴线相关设置。数学上的x轴
show: true,
lineStyle: {
color: '#f9f9f9'
},
},
axisLabel: { //坐标轴刻度标签的相关设置
textStyle: {
color: '#d1e6eb',
margin: 15,
},
},
axisTick: {
show: false,
},
data: ['1月', '2月', '3月', '4月', '5月', '6月', '7月', ],
}],
yAxis: [{
type: 'value',
min: 0,
// max: 140,
splitNumber: 7,
splitLine: {
show: true,
lineStyle: {
color: '#0a3256'
}
},
axisLine: {
show: false,
},
axisLabel: {
margin: 20,
textStyle: {
color: '#d1e6eb',
},
},
axisTick: {
show: false,
},
}],
series: [{
name: '注册总量',
type: 'line',
// smooth: true, //是否平滑曲线显示
// symbol:'circle', // 默认是空心圆(中间是白色的),改成实心圆
showAllSymbol: true,
symbol: 'emptyCircle',
symbolSize: 6,
lineStyle: {
normal: {
color: "#28ffb3", // 线条颜色
},
borderColor: '#f0f'
},
label: {
show: true,
position: 'top',
textStyle: {
color: '#fff',
}
},
itemStyle: {
normal: {
color: "#28ffb3",
}
},
tooltip: {
show: false
},
areaStyle: { //区域填充样式
normal: {
//线性渐变,前4个参数分别是x0,y0,x2,y2(范围0~1);相当于图形包围盒中的百分比。如果最后一个参数是‘true’,则该四个值是绝对像素位置。
color: new echarts.graphic.LinearGradient(0, 0, 0, 1, [{
offset: 0,
color: 'rgba(0,154,120,1)'
},
{
offset: 1,
color: 'rgba(0,0,0, 0)'
}
], false),
shadowColor: 'rgba(53,142,215, 0.9)', //阴影颜色
shadowBlur: 20 //shadowBlur设图形阴影的模糊大小。配合shadowColor,shadowOffsetX/Y, 设置图形的阴影效果。
}
},
data: [393, 438, 485, 631, 689, 824, 987]
}, {
name: '最新注册量',
type: 'bar',
barWidth: 20,
tooltip: {
show: false
},
label: {
show: true,
position: 'top',
textStyle: {
color: '#fff',
}
},
itemStyle: {
normal: {
// barBorderRadius: 5,
// color: new echarts.graphic.LinearGradient(
// 0, 0, 0, 1,
// [{
// offset: 0,
// color: '#14c8d4'
// },
// {
// offset: 1,
// color: '#43eec6'
// }
// ]
// )
color: function(params) {
var colorList = ['#0ec1ff', '#10cdff', '#12daff', '#15ebff', '#17f8ff', '#1cfffb', '#1dfff1'];
return colorList[params.dataIndex];
}
}
},
data: [200, 382, 102, 267, 186, 315, 316]
}]
};
// 绘制图表
myChart.setOption(option);
window.addEventListener('resize',function () {//执行
myChart.resize();
})
// 监听侧边栏的变化
this.sidebarElm = document.getElementsByClassName('sidebar-container')[0]
this.sidebarElm &&
this.sidebarElm.addEventListener(
'transitionend',
function () {//执行
myChart.resize();
}
)
}
},
mounted () {
this.initCharts();
}
}
</script>
<style scoped lang="scss">
.chy-datashow{
position: relative;
.chy-datetime{
z-index: 8;
position: absolute;
top: 85px;
right: 20px;
text-align: center;
margin: auto;
}
.chart-title{
margin-bottom: 45px;
}
.el-date-editor.el-input, .el-date-editor.el-input__inner {
width: 300px;
}
}
</style>
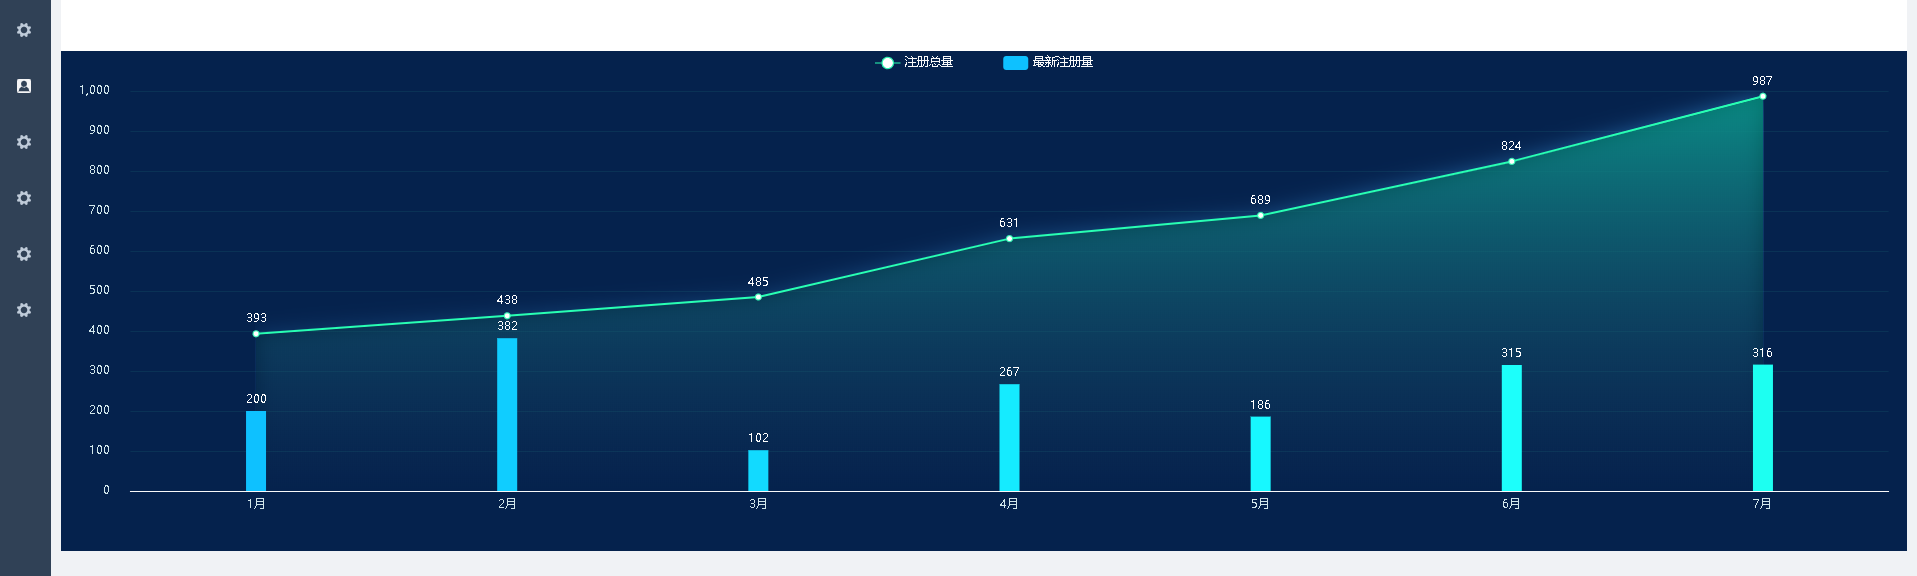
效果

参考:https://www.cnblogs.com/nuonuo-D/p/10516937.html
https://gallery.echartsjs.com/editor.html?c=x4nwdD5Luk
https://blog.csdn.net/Kimser/article/details/106683221

 浙公网安备 33010602011771号