<template>
<view class="page">
<!-- 导航栏 -->
<b-nav-bar class="b-nav-bar">
<template slot="left">
<view @click="goBack" class="iconfont icon-zuofanhui nBack ml15"></view>
</template>
<scroll-view scroll-x="true" class="title">
<view>{{title}}</view>
</scroll-view>
</b-nav-bar>
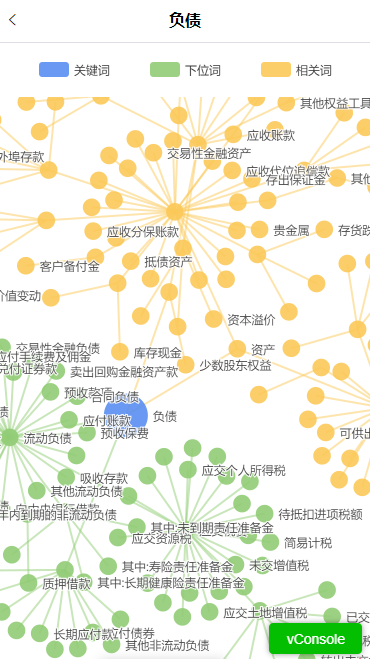
<!-- 术语图谱 -->
<view style="width: 100%;height: 100%;display: flex;justify-content: center;align-items: center;">
<!-- 图表 -->
<view :style="echartsStyle" v-if="atlasTermNode" id="atlasChart"></view>
<!-- 无数据图片 -->
<view class="noDataBox" v-else="!atlasTermNode && title">
<view class="noDataImg"></view>
<view class="noDataText">
暂未搜索到相关结果~
</view>
</view>
</view>
<!-- 提示点击弹框 -->
<u-popup :show="showGuideAtlas" mode="center" :round="10" class="popup">
<view class="popupContent">
<view class="triangle-left"></view>
<view class="topText">
<text class="iconfont icon-caozuo"></text>
<text class="popupText">请任意选择一个节点点击查看术语解释</text>
</view>
<view class="popupBtn" @click="closePopup">
我知道了
</view>
</view>
</u-popup>
<!-- 节点说明弹窗 -->
<u-popup :show="showExplain" mode="bottom" :round="10" class="explainPopup">
<view class="explainHeader">
<scroll-view class="explainTitle" scroll-x="true">
<view style="display: inline-block;">{{explainTitle}}</view>
</scroll-view>
<view class="explainIcon" @click="canclePopup">
<text class="iconfont icon-shanchu1"></text>
</view>
</view>
<scroll-view scroll-y="true" class="explainContent">
<view v-html="nodeInterpret"></view>
</scroll-view>
<view class="termSource">
{{termSource}}
</view>
<view class="serachBtn" @click="searchTermMap">
<text class="searchText">查看图谱</text>
<text class="iconfont icon-youqiehuan"></text>
</view>
</u-popup>
</view>
</template>
<script>
import echarts from "@/static/common/js/echarts.min.js" // 引入echarts.js
import { // 解决iOS刘海屏高度
mapState
} from 'vuex';
import { // 接口请求
queryTermmapList,
queryNodeExplain
} from '@/api/chart.js'
import { // 方法请看上篇博客
getSession
} from '@/util/storage';
/**
* @param {Boolean} hasHyponyms 是否有相关词
* @param {Boolean} hasRelateWords 是否有下位词
*/
function defaultOption (hasHyponyms = true, hasRelateWords = true) { // 定义默认图例
const categories = [
{
name: '关键词',
itemStyle: {
color:
'#588DF1'
}
},
]
if (hasHyponyms) {
categories.push({
name: '下位词',
itemStyle: {
color:
'#91CC75'
}
})
}
if (hasRelateWords) {
categories.push({
name: '相关词',
itemStyle: {
color:
'#FAC858'
}
})
}
return {
categories,
nodes: [],
links: []
}
}
function defaultAtlasData() {
return {
termNode: {}, // 关键词
hyponyms: [], // 上下位词
relatedWords: [], // 相关词
}
}
export default {
// components: {
// echarts
// },
data() {
this.atlasData = {}
this.chartOption = defaultOption()
this.centerPoint = { // 容器中心点坐标
x: 0,
y: 0,
width: 0
}
this.totalLevel = 1
this.myChart = null
this.hasHyponyms = true // 是否有下位词
this.hasRelateWords = true // 是否有相关词
return {
title: '', // 页面标题
option: {}, // 图表数据
showGuideAtlas: false, // 是否显示提示点击弹框
atlasTermNode: '', // 关键词节点名称(根据这个判断是否显示无数据图片)
atlasData: defaultAtlasData(),
echartsStyle: {
width: '',
height: ''
}, // echarts样式
showExplain: false, // 是否显示点击问号注释说明弹窗
explainTitle: '', // 注释说明弹窗标题
nodeInterpret: '', // 注释说明弹窗内容
termSource: '', //说明来源内容
}
},
created() {
},
computed: {
...mapState(['stabarHeight']) //刘海屏高度存储在vuex里面
},
onLoad(option) {
this.title = option.detailTitle
},
mounted() {
this.$nextTick(() => {
this.requestData()
})
this.echartsStyle.width = uni.getSystemInfoSync().screenWidth + 'px' // 获取屏幕宽度
this.echartsStyle.height = uni.getSystemInfoSync().screenHeight + 'px' // 获取屏幕高度
},
methods: {
goBack() {
uni.navigateBack({
delta:1,//返回层数,2则上上页
})
},
// 用戶指引
handleFirstVisit() {
// 用户是否第一次进入页面
if (this.atlasTermNode) {
localStorage.setItem('showGuideAtlas', '1')
}
},
// 接口:通过术语名称查询图谱节点
async requestData() {
//显示加载框
uni.showLoading({
title: '加载中',
mask: true
});
this.atlasTermNode = ''
const res = await queryTermmapList({
termName: this.title
})
if (res.data != null) {
this.atlasData = res ? res : defaultAtlasData()
this.handleAtlas()
//隐藏加载框
uni.hideLoading();
this.handleFirstVisit()
} else {
uni.hideLoading();
}
},
handleAtlas() {
const {
atlasData
} = this
this.atlasTermNode = this.atlasData.data.termNode.name // 节点名称赋值
this.$nextTick(() => {
this.initAtlasData(atlasData)
})
},
// 初始化数据
initAtlasData (data) {
this.atlasData = data
const { hyponyms = [], relatedWords = [] } = data.data
this.hasHyponyms = hyponyms && hyponyms.length > 0
this.hasRelateWords = relatedWords && relatedWords.length > 0
this.initChartOption()
},
initChartOption() {
const { termNode = {}, relatedWords = [], hyponyms = [] } = this.atlasData.data || {}
const { hasHyponyms, hasRelateWords } = this
this.chartOption = defaultOption(hasHyponyms, hasRelateWords)
const { x, y } = this.centerPoint
this.chartOption.nodes.push({
...termNode,
category: 0,
symbolSize: 50,
x,
y
})
hasHyponyms && this.handleNodesLinks(hyponyms, 1)
if (hasRelateWords) {
const relatedWordsCategory = hasHyponyms ? 2 : 1
this.handleNodesLinks(relatedWords, relatedWordsCategory)
}
this.getOptions()
},
// 添加节点和关系线
addNodeLink (item, category, source) {
const { nodes, links } = this.chartOption
const { children, ...others } = item
nodes.push(Object.assign(others, {
category,
symbolSize: 20,
}))
const currentIndex = nodes.length - 1
links.push({
source,
target: currentIndex
})
return currentIndex
},
// 处理下位词/相关词
/**
* @param {Array} arr 相关词/下位词
* @param {Number} category 类别
*/
handleNodesLinks (arr, category) {
if (arr.length) {
arr.forEach((data) => {
const sourceIndex = this.addNodeLink(data, category, 0)
this.handleTreeData({ data, category, sourceIndex })
})
}
},
// 生成图表配置
getOptions() {
const { width } = this.centerPoint
const { hasHyponyms, hasRelateWords, totalLevel } = this
let len = 3
if (!hasHyponyms) {
len--
}
if (!hasRelateWords) {
len--
}
const padSpace = width - 150 * len // 计算图谱所占空间
const { nodes, links, categories } = this.chartOption
// 图例
const legend = [{
// 位置
left: 'center',
itemGap: 40,
itemHeight: 15,
itemWidth: 30,
backgroundColor: '#fff',
opacity: .9,
padding: [20, padSpace],
// 图例的名称
data: categories.map(({
name
}) => name)
}]
// 设置图表根据节点层级确定放大缩小大小
let zoom = 0.8
if (totalLevel <= 4) {
zoom = 2.4
} else if (totalLevel <= 6) {
zoom = 1.4
} else if (totalLevel <= 12) {
zoom = 1
}
// 设置图表数据
const series = [{
name: '术语图谱',
type: 'graph',
// draggable: true,
data: nodes, // 节点数据
links: links, // 边、联系数据
categories, // 节点种类
roam: true, // 是否开启鼠标缩放和平移漫游
label: { // 图形上的文本标签
show: true,
position: 'right', // 相对于节点标签的位置
formatter(params) {
// 节点标签
return params.data.name;
},
},
layout: 'force',
force: {
gravity: 0.15,
repulsion: 70,
edgeLength: 80,
layoutAnimation: true
},
zoom,
height: '85%',
top: 30,
labelLayout: {
moveOverlap: 'shiftX'
},
width: '100%',
left: 'center',
cursor: 'pointer',
// 节点的style
itemStyle: {
opacity: 0.9,
},
// 关系边的公用线条样式
lineStyle: {
show: true,
width: 2,
// 边的颜色:与终点相同
color: 'target',
// 边的曲度
curveness: 0
},
scaleLimit: {
min: 0.5,
max: 5
}
}, ]
const option = {
legend,
series
}
this.option = option
this.myChart = echarts.init(document.getElementById('atlasChart'), 'chart')
this.myChart.setOption(this.option);
// 绑定事件
this.myChart.on('click', this.graphNodeClick)
},
// 关系图点击事件
async graphNodeClick(evt) {
//显示加载框
uni.showLoading({
title: '加载中',
mask: true
});
const {
termId: id
} = evt.data
if (id) {
const res = await queryNodeExplain({
id
})
this.explainTitle = res.data.termName
this.nodeInterpret = res.data.explain
this.termSource = res.data.termSource
//隐藏加载框
uni.hideLoading();
this.showExplain = true
} else {
//隐藏加载框
uni.hideLoading();
this.showExplain = false
}
},
// 递归处理下位词/相关词子节点
handleTreeData ({ data, category, sourceIndex }) {
const { children } = data
this.totalLevel++
for (let i = 0, l = children.length; i < l; i++) {
const item = children[i]
const currentIndex = this.addNodeLink(item, category, sourceIndex)
this.handleTreeData({ data: item, category, sourceIndex: currentIndex })
}
},
// 关闭指引弹框
closePopup() {
this.showGuideAtlas = false
},
// 关闭说明弹框
canclePopup() {
this.showExplain = false
},
// 说明框中节点重新搜索
searchTermMap() {
this.showExplain = false // 是否显示说明弹框
this.title = this.explainTitle // 弹框标题
this.chartOption = defaultOption() // 点击查看图谱按钮重置图例
if (this.myChart != null && this.myChart != "" && this.myChart != undefined) {
this.myChart.dispose(); // 销毁
this.requestData() // 重新请求数据
}
},
}
}
</script>
<style lang="scss" scoped>
.b-nav-bar {
height: 88rpx;
}
.page {
height: 100%;
overflow: hidden;
.title {
font-size: 32rpx;
height: 88rpx;
line-height: 88rpx;
width: 440rpx;
background-color: #fff !important;
text-align: center;
}
.nBack {
height: 100%;
display: flex;
align-items: center;
justify-content: center;
}
}
.noDataBox {
position: fixed;
left: 50%;
top: 50%;
transform: translate(-50%, -50%);
.noDataImg {
width: 320rpx;
height: 268rpx;
background-image: url('./../../../../static/images/noData.png');
background-size: 100% 100%;
}
.noDataText {
color: #999999;
font-size: 26rpx;
margin-top: 53rpx;
text-align: center;
}
}
.popup {
display: flex;
flex-direction: column;
justify-content: center;
align-items: center;
.popupContent {
width: 600rpx;
height: 240rpx;
background: #FFFFFF;
box-shadow: -2rpx 0rpx 20rpx 0rpx rgba(60, 60, 60, 0.1200);
border-radius: 14rpx;
position: fixed;
bottom: 196rpx;
right: 75rpx;
.triangle-left {
position: absolute;
bottom: 240rpx;
left: 280rpx;
width: 0;
height: 0;
border-radius: 2rpx;
border: 16rpx solid;
border-bottom-color: #ffffff;
border-right-color: transparent;
border-top-color: transparent;
border-left-color: transparent;
}
.topText {
display: flex;
justify-content: center;
margin: 43rpx auto;
.icon-caozuo {
font-size: 43rpx;
color: #666666;
margin-right: 13rpx;
}
.popupText {
font-size: 26rpx;
font-family: PingFang SC;
font-weight: 500;
color: #666666;
}
}
.popupBtn {
width: 300rpx;
height: 80rpx;
background: #F9FAFB;
border: 1rpx solid #DCDEE3;
border-radius: 40rpx;
font-size: 28rpx;
font-family: PingFang SC;
font-weight: 500;
color: #999999;
display: flex;
align-items: center;
justify-content: center;
margin: 10rpx auto 37rpx;
}
}
}
.explainPopup {
width: 100%;
background-color: #fff;
.explainHeader {
width: 100%;
height: 100rpx;
display: flex;
justify-content: space-between;
align-items: center;
border-bottom: 1rpx solid #DCDEE3;
.explainTitle {
font-size: 30rpx;
font-family: PingFang SC;
font-weight: bold;
color: #333333;
margin-left: 30rpx;
width: 80%;
height: 100rpx;
line-height: 100rpx;
white-space: nowrap;
}
.explainIcon {
width: 44rpx;
height: 44rpx;
background-color: #F4F4F4;
margin-right: 30rpx;
border-radius: 50%;
display: flex;
justify-content: center;
align-items: center;
.icon-shanchu1 {
font-size: 32rpx;
color: #C0C0C0;
}
}
}
.explainContent {
font-size: 24rpx;
font-family: PingFang SC;
font-weight: 500;
color: #666666;
line-height: 50rpx;
padding: 37rpx 30rpx 0;
width: 690rpx;
max-height: 400rpx;
overflow-y: auto;
}
.termSource {
font-size: 24rpx;
height: 89rpx;
font-family: PingFang SC;
font-weight: 500;
color: #999999;
line-height: 89rpx;
padding-left: 30rpx;
}
.serachBtn {
height: 70rpx;
background: linear-gradient(0deg, #6C8FF8, #BBCBFD);
box-shadow: 0rpx 2rpx 15rpx 0rpx rgba(111, 145, 248, 0.2000);
border-radius: 35rpx 0rpx 0rpx 35rpx;
position: fixed;
right: 0;
bottom: 30rpx;
font-size: 24rpx;
font-family: PingFang SC;
font-weight: 500;
color: #FFFFFF;
display: flex;
align-items: center;
.searchText {
margin-left: 34rpx;
}
.icon-youqiehuan {
margin-left: 16rpx;
margin-right: 23rpx;
}
}
}
/deep/ .header_content {
border-bottom: 1rpx solid #DCDEE3;
}
</style>