matplotlib.pyplot 包
import matplotlib.pyplot as plt
图片的打开和保存:
from PIL import Image
img=Image.open('....')
img.save('...')
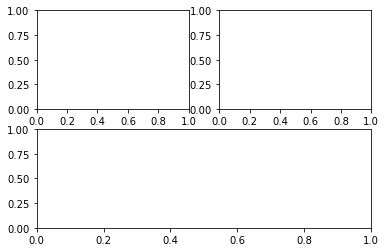
plt.subplot:
plt.subplot(221)      #分成2x2,占用第一个,也即第一行第一列的图
plt.subplot(222)     #分成2x2,占用第二个,也即第一行第二列
plt.subplot(212)     #分成2x1,占用第二个,也即第二行
plt.show()
生成图像如下:
plt.figure:
plt.show(figsize=(20,2)) #设置输出图片的尺寸
import numpy as np
t1=np.arange(0,5,0.1)
plt.figure(figsize=(3,3))
plt.plot(t1,np.cos(2*np.pi*t1))
plt.show()
plt.imshow:
调整图像显示的色彩
x=[[1,2],[3,4],[5,6]]
plt.imshow(x,cmap='gray')
plt.show()
from PIL import Image
img=Image.open('C:/Users/1/Desktop/01.jpg')
img=np.array(img)
if img.ndim==3:
    img=img[:,:,0]        #RGB的3个通道取第1个通道
plt.subplot(221);plt.imshow(img)
plt.subplot(222);plt.imshow(img,cmap='gray')
plt.subplot(223);plt.imshow(img,cmap=plt.cm.gray)
plt.subplot(224);plt.imshow(img,cmap=plt.cm.gray_r)
plt.show()
注:在img=Image.open(...)之后可通过:
img.size    #获取尺寸
img.mode  #获取图片模式
img.format   #获取图片的格式

 浙公网安备 33010602011771号