promethus监控mysql
一、mysqld_exporter安装
下载页面
https://github.com/prometheus/mysqld_exporter/releases
下载最新版本
登录到mysql服务器,解压,并运行
# 解压
tar zxvf mysqld_exporter-0.12.0.linux-amd64.tar.gz -C /usr/src/
cd /usr/src/mysqld_exporter-0.12.0.linux-amd64

# 创建目录,复制文件
mkdir -p /etc/mysqld_exporter/bin/
mkdir -p /etc/mysqld_exporter/conf
cp mysqld_exporter /etc/mysqld_exporter/bin/
二、mysql授权
mysqld_exporter需要连接Mysql,首先为它创建用户并赋予所需的权限:
grant replication client,process on *.* to exporter@'%' identified by '27dc703b';
grant select on performance_schma.* to exporter@'%';
flush PRIVILEGES;
三、运行mysqld_exporter
新建配置文件
vi /etc/mysqld_exporter/conf/my.cnf
内容如下:
[client]
user=exporter
password=27dc703b
port=3306
host=127.0.0.1
启动进程
/etc/mysqld_exporter/bin/mysqld_exporter --config.my-cnf="/etc/mysqld_exporter/conf/my.cnf" --web.listen-address=":9104"
观察是否有报错信息,如果没有报错信息,就可以封装service服务了
四、mysqld_exporter封装service
vim /lib/systemd/system/mysqld_exporter.service
内容如下:
[Unit]
Description=mysqld monitor
After=network.target

[Service]
ExecStart=/etc/mysqld_exporter/bin/mysqld_exporter --config.my-cnf="/etc/mysqld_exporter/conf/my.cnf" --web.listen-address=":9104"
ExecStop=-/sbin/start-stop-daemon --quiet --stop --retry QUIT/5
TimeoutStopSec=5
KillMode=mixed

[Install]
WantedBy=multi-user.target
重新加载service配置文件,设置开机自启动,并启动服务
systemctl daemon-reload
systemctl enable mysqld_exporter.service
systemctl start mysqld_exporter.service
查看端口
root@ubuntu:~# netstat -anpt|grep mysqld_exporte
tcp6       0      0 :::9104                 :::*                    LISTEN      3253/mysqld_exporte
使用网页访问metrics
http://192.168.1.24:9104/metrics
效果如下:
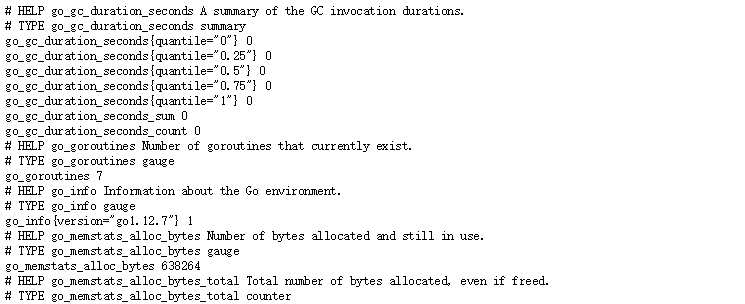
如果数据输出正常,则表示成功。
五、promethus增加job
vim /opt/prometheus/prometheus.yml
增加以下内容:
- job_name: mysqld_exporter
static_configs:
  - targets:
    - 192.168.1.24:9104
    labels:
      instance: mysql-24
重启prometheus
root@ubuntu:/opt/prometheus# docker ps |grep prometheus
0fa256f85750        prom/prometheus     "/bin/prometheus --c…"   About an hour ago   Up 29 seconds       0.0.0.0:9090->9090/tcp   wizardly_kirch

root@ubuntu:/opt/prometheus# docker restart 0fa256f85750
访问页面:
http://192.168.1.24:9090/targets
确保mysqd_exporter状态为UP

六、Grafana导入Dashboards
下载json文件
https://files.cnblogs.com/files/xiao987334176/MySQL%E7%9B%91%E6%8E%A7-1577183740876.zip
解压之后,里面就是一个json文件
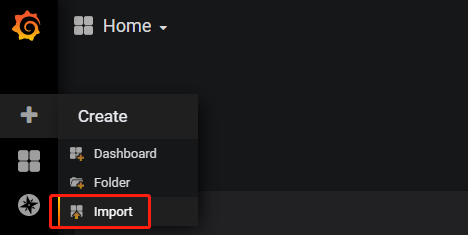
点击import
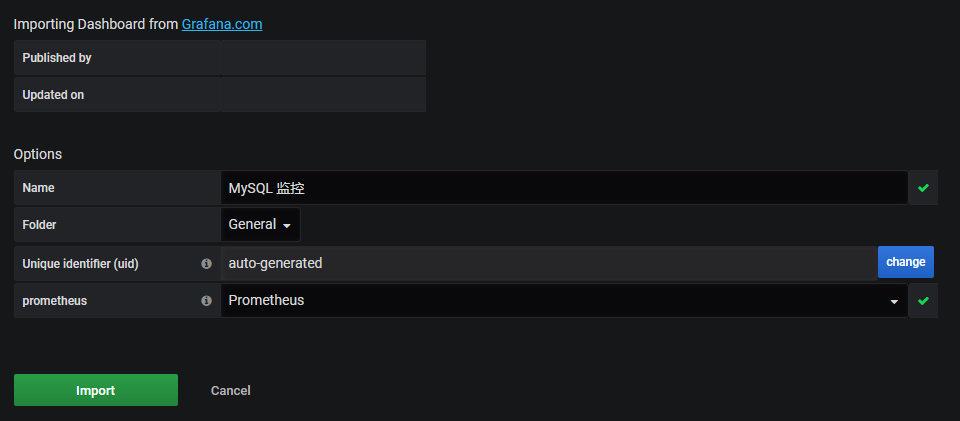
上传json文件,设置Name,选择prometheus,点击import
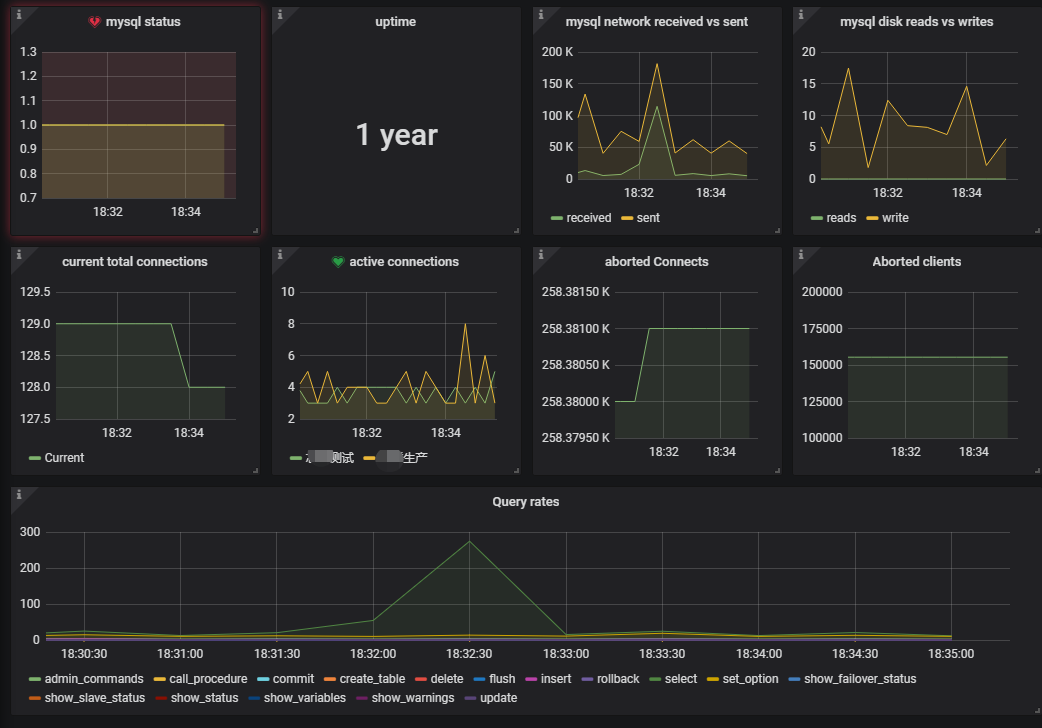
等待一段时间,数据多了之后,效果如下:

 浙公网安备 33010602011771号