
使用python画3D立体爱心
原理
1.使用python中的matplotlib库。
2.立体爱心面公式
\[(x^2+\frac{9}{4}y^2+z^2-1)^3-\frac{9}{80}y^2*z^3-x^2*z^3=0
\]
点画法(实心)
代码
import matplotlib.pyplot as plt #导入绘图模块
from mpl_toolkits.mplot3d import Axes3D #3d绘图模块
import numpy as np #导入数值计算拓展模块

#start generating points
x_lim=np.linspace(-10,10,150)
y_lim=np.linspace(-10,10,150)
z_lim=np.linspace(-10,10,150)
X_points=[] #用来存放绘图点X坐标
Y_points=[] #用来存放绘图点Y坐标
Z_points=[] #用来存放绘图点Z坐标
for x in x_lim:
    for y in y_lim:
        for z in z_lim:
            if (x**2+(9/4)*y**2+z**2-1)**3-(9/80)*y**2*z**3-x**2*z**3<=0:
                X_points.append(x)
                Y_points.append(y)
                Z_points.append(z)

plt.style.use('seaborn')
fig=plt.figure()
ax=fig.add_subplot(111,projection='3d')
ax.scatter(X_points,Y_points,Z_points,color="red")
plt.show()
运行效果
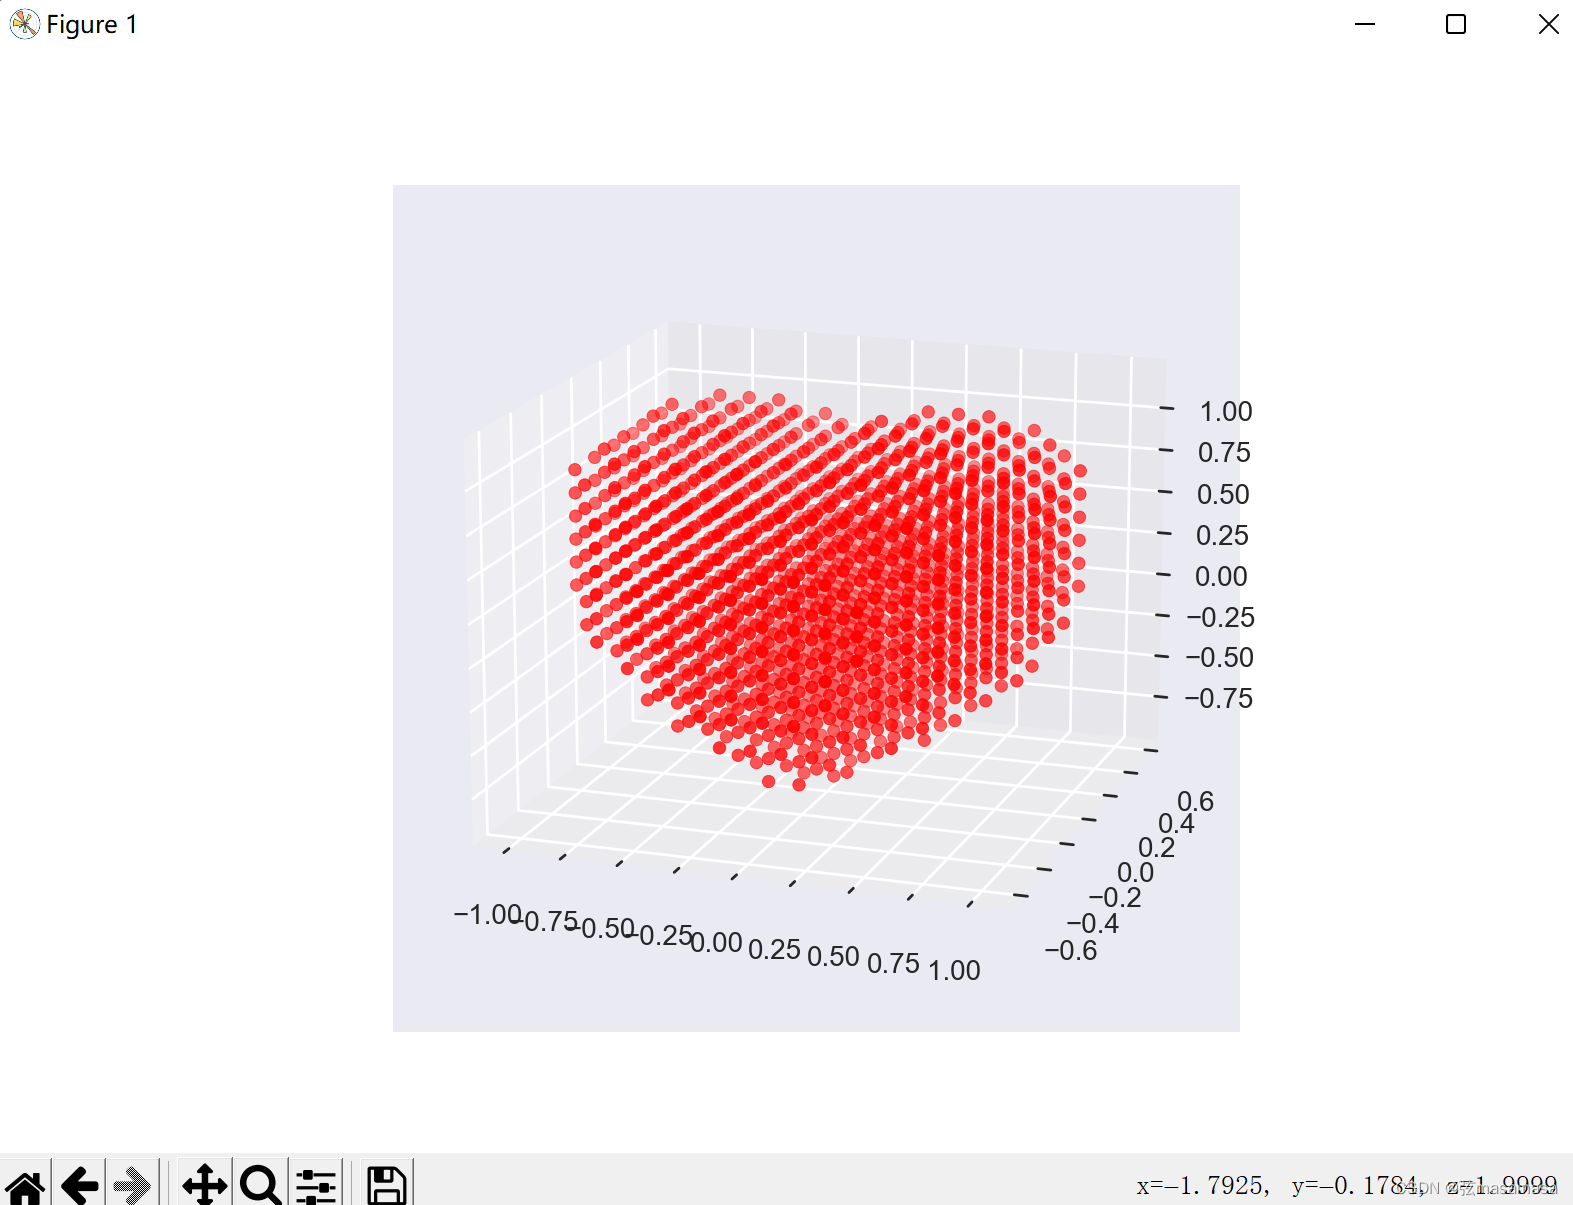
这个画法侧面看起来很无语。
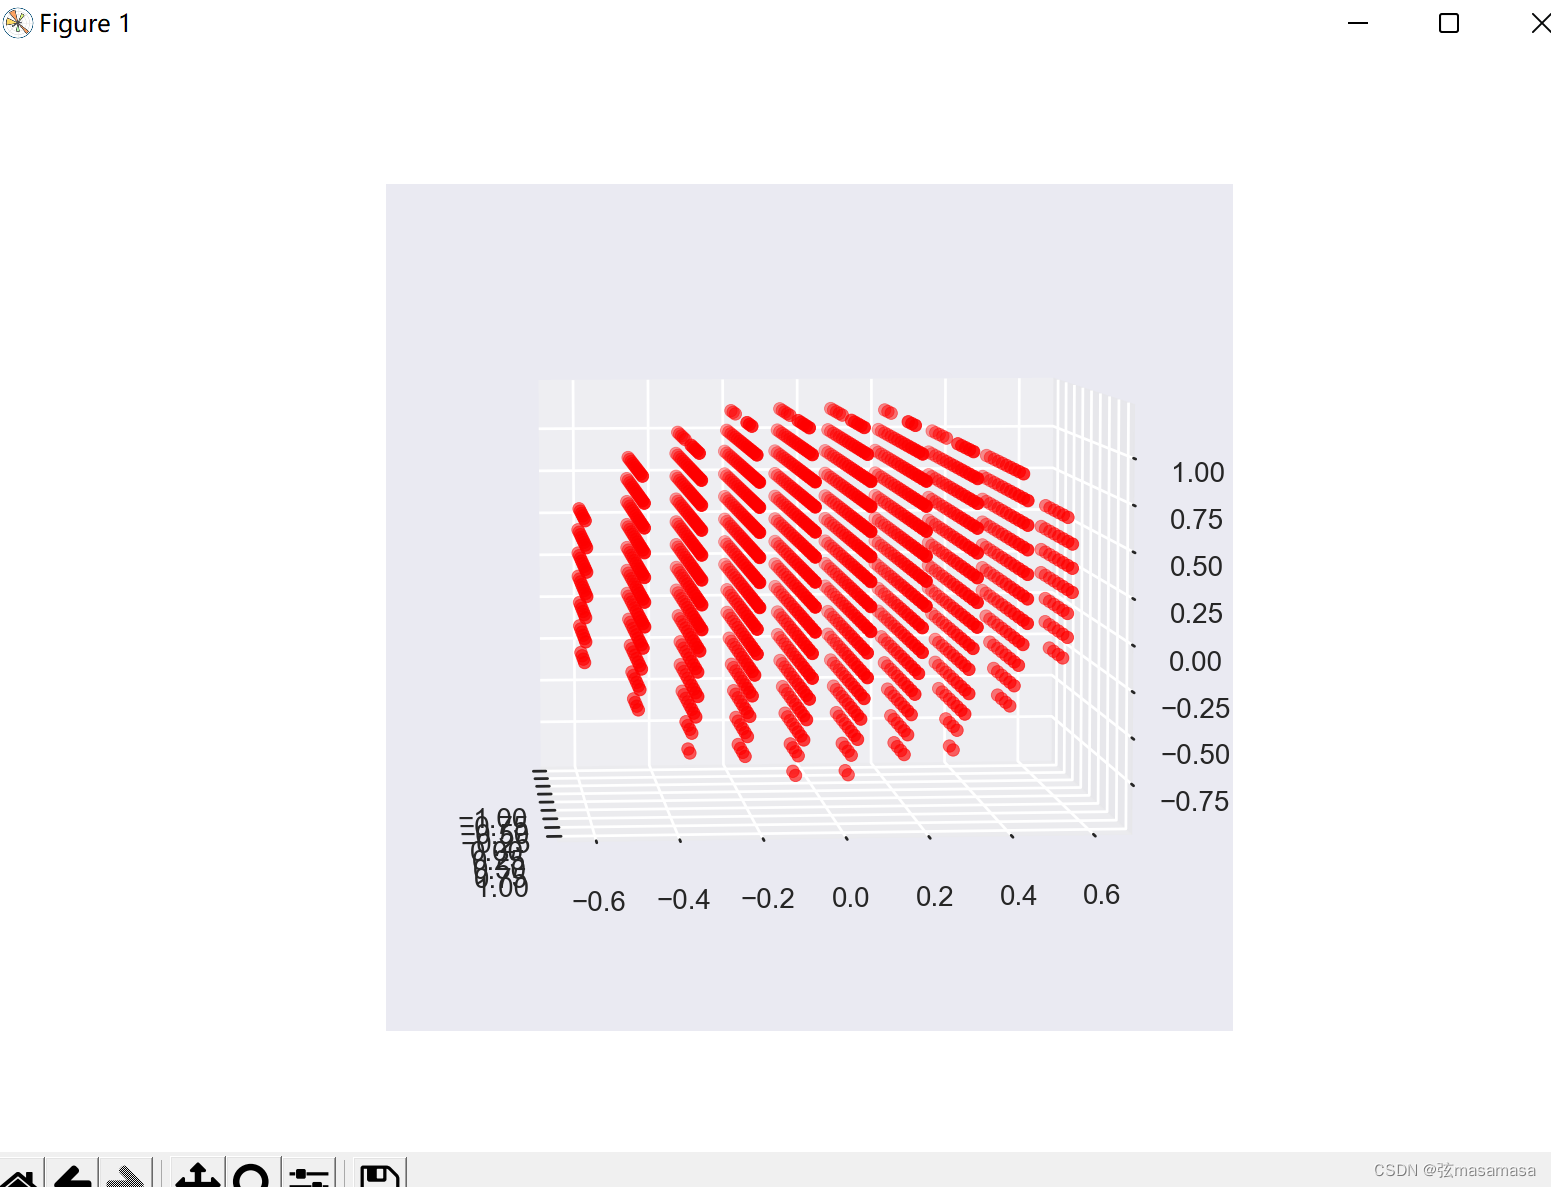
点画法(空心)
代码
import matplotlib.pyplot as plt #导入绘图模块
from mpl_toolkits.mplot3d import Axes3D #3d绘图模块
import numpy as np #导入数值计算拓展模块

#start generating points
x_lim=np.linspace(-10,10,200)
y_lim=np.linspace(-10,10,200)
z_lim=np.linspace(-10,10,200)
X_points=[] #用来存放绘图点X坐标
Y_points=[] #用来存放绘图点Y坐标
Z_tmp=[]
Z_points=[] #用来存放绘图点Z坐标
for y in y_lim:
    for x in x_lim:
        for z in z_lim:
            k=(x**2+(9/4)*y**2+z**2-1)**3-(9/80)*y**2*z**3-x**2*z**3
            if k<=0 :
                Z_tmp.append(z)
                if y<=-0.55 or y>=0.55:
                    X_points.append(x)
                    Y_points.append(y)
                    Z_points.append(z)
        if Z_tmp:
            X_points.append(x)
            Y_points.append(y)
            Z_points.append(max(Z_tmp))
            X_points.append(x)
            Y_points.append(y)
            Z_points.append(min(Z_tmp))
            Z_tmp.clear()

plt.style.use('seaborn')
fig=plt.figure()
ax=fig.add_subplot(111,projection='3d')
ax.set_zlim(-1, 1)
ax.set_xlim(-1, 1)
ax.set_ylim(-1, 1)
ax.scatter(X_points,Y_points,Z_points)

plt.show()
运行效果

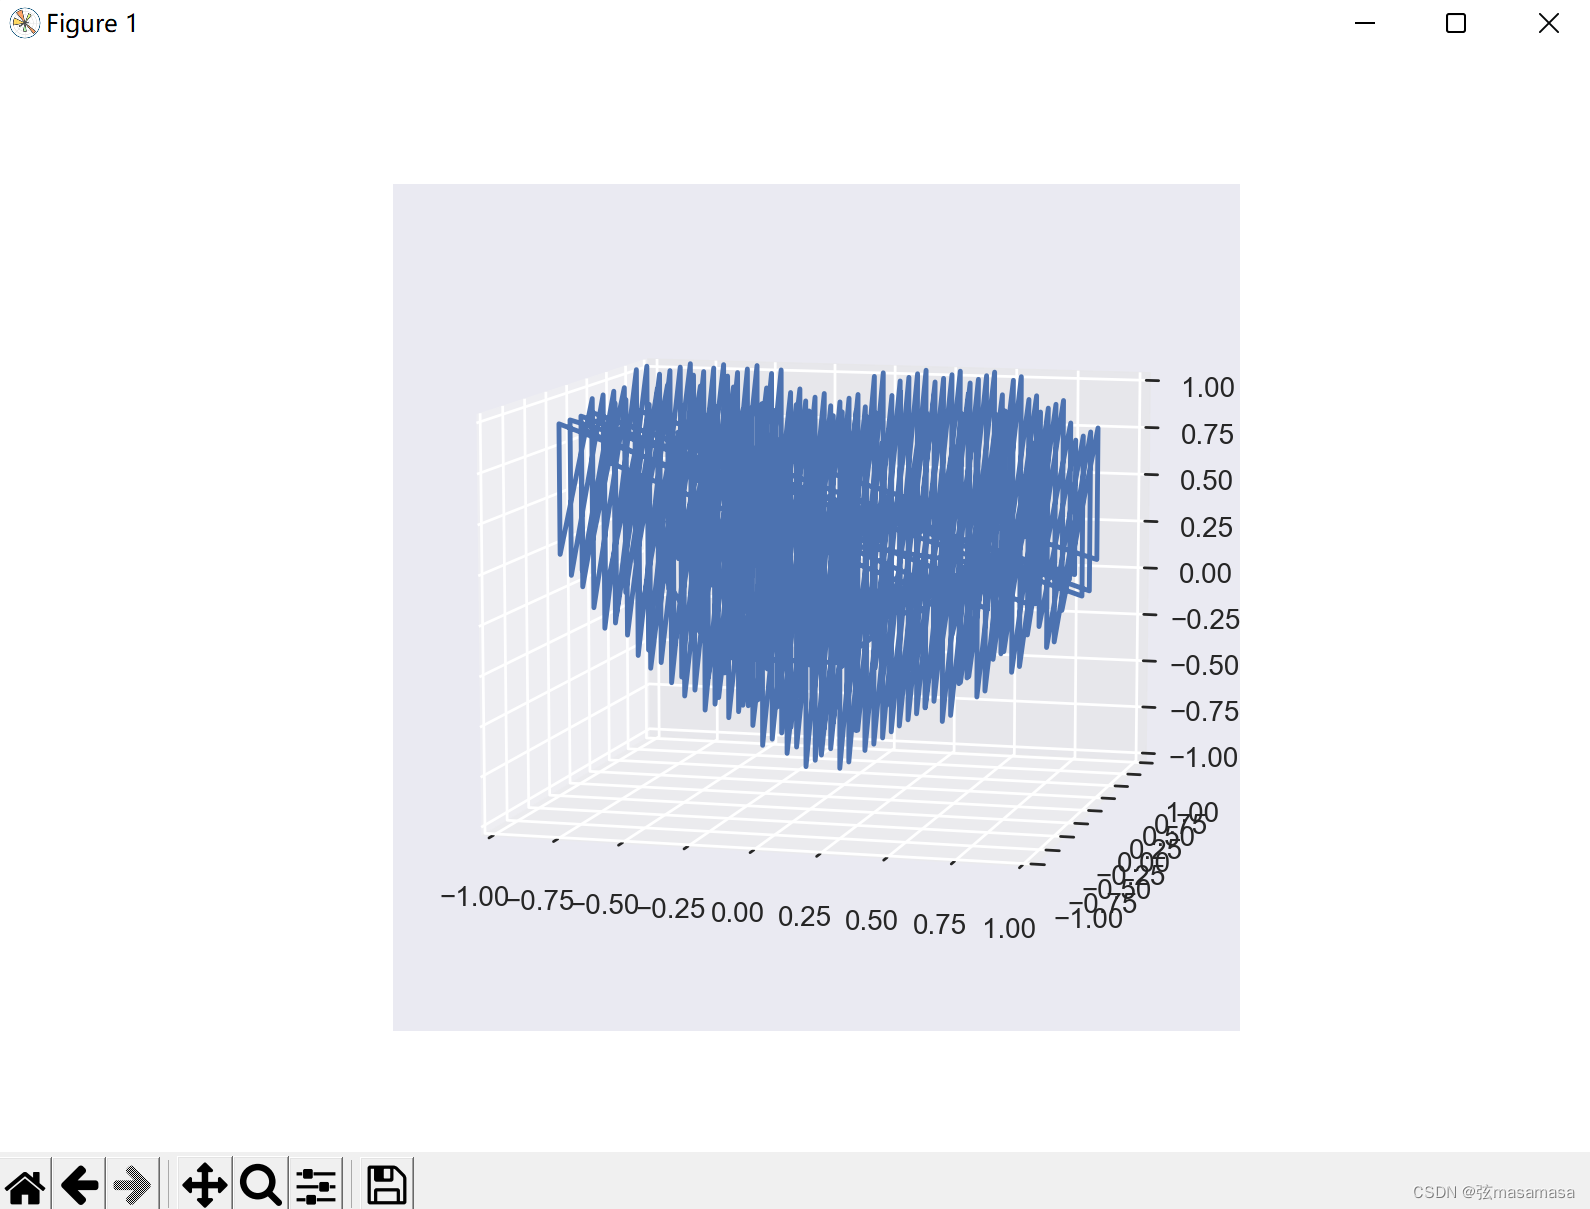
折线画法 (线团)
代码
import matplotlib.pyplot as plt #导入绘图模块
from mpl_toolkits.mplot3d import Axes3D #3d绘图模块
import numpy as np #导入数值计算拓展模块

#start generating points
x_lim=np.linspace(-10,10,150)
y_lim=np.linspace(-10,10,150)
z_lim=np.linspace(-10,10,150)
X_points=[] #用来存放绘图点X坐标
Y_points=[] #用来存放绘图点Y坐标
Z_tmp=[]
Z_points=[] #用来存放绘图点Z坐标
for y in y_lim:
    for x in x_lim:
        for z in z_lim:
            k=(x**2+(9/4)*y**2+z**2-1)**3-(9/80)*y**2*z**3-x**2*z**3
            if k<=0 :
                Z_tmp.append(z)
                if y<=-0.55 or y>=0.55:
                    X_points.append(x)
                    Y_points.append(y)
                    Z_points.append(z)
        if Z_tmp:
            X_points.append(x)
            Y_points.append(y)
            Z_points.append(max(Z_tmp))
            X_points.append(x)
            Y_points.append(y)
            Z_points.append(min(Z_tmp))
            Z_tmp.clear()

plt.style.use('seaborn')
fig=plt.figure()
ax=fig.add_subplot(111,projection='3d')
ax.set_zlim(-1, 1)
ax.set_xlim(-1, 1)
ax.set_ylim(-1, 1)
ax.plot(X_points,Y_points,Z_points)

plt.show()
运行效果
等高线画法(线框)
代码
from mpl_toolkits.mplot3d import Axes3D
from matplotlib import cm
from matplotlib.ticker import LinearLocator, FormatStrFormatter
import matplotlib.pyplot as plt
import numpy as np


def heart_3d(x, y, z):
    return (x**2+(9/4)*y**2+z**2-1)**3-x**2*z**3-(9/80)*y**2*z**3


def plot_implicit(fn, bbox=(-1.5, 1.5)):
    xmin, xmax, ymin, ymax, zmin, zmax = bbox*3
    fig = plt.figure()
    ax = fig.add_subplot(projection='3d')
    A = np.linspace(xmin, xmax, 100)  # resolution of the contour
    B = np.linspace(xmin, xmax, 10)  # number of slices
    A1, A2 = np.meshgrid(A, A)  # grid on which the contour is plotted

    for z in B:  # plot contours in the XY plane
        X, Y = A1, A2
        Z = fn(X, Y, z)
        cset = ax.contour(X, Y, Z+z, [z], zdir='z', colors=('r',))

    for y in B:  # plot contours in the XZ plane
        X, Z = A1, A2
        Y = fn(X, y, Z)
        cset = ax.contour(X, Y+y, Z, [y], zdir='y', colors=('red',))

    for x in B:  # plot contours in the YZ plane
        Y, Z = A1, A2
        X = fn(x, Y, Z)
        cset = ax.contour(X+x, Y, Z, [x], zdir='x', colors=('red',))

    # must set plot limits because the contour will likely extend
    # way beyond the displayed level. Otherwise matplotlib extends the plot limits
    # to encompass all values in the contour.
    ax.set_zlim3d(zmin, zmax)
    ax.set_xlim3d(xmin, xmax)
    ax.set_ylim3d(ymin, ymax)

    plt.show()


if __name__ == '__main__':
    plot_implicit(heart_3d)
运行效果
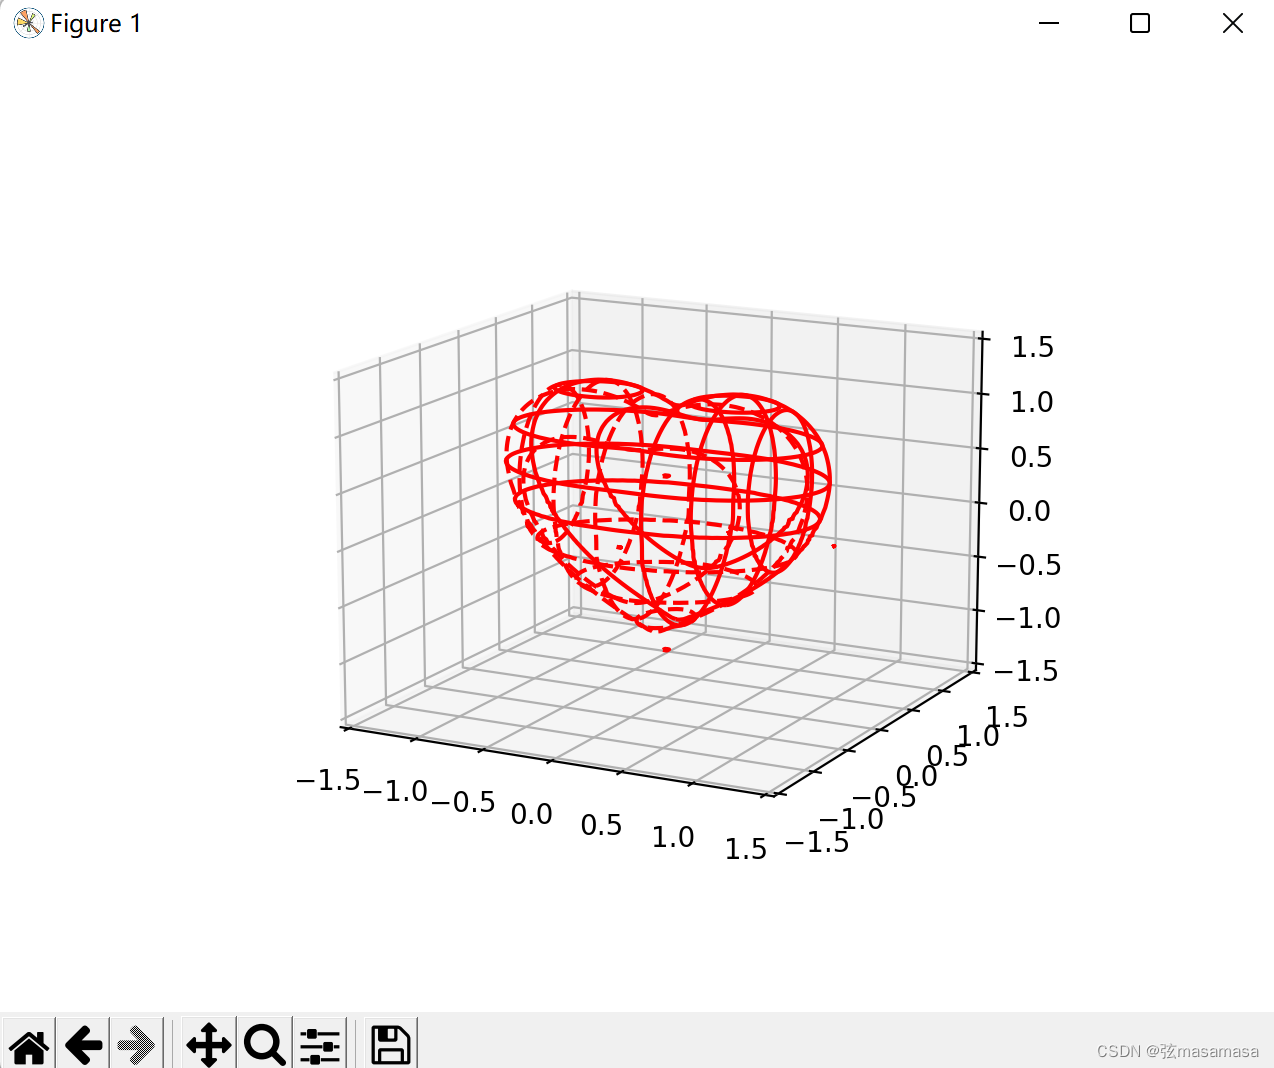
这么好看所以并不是我自己写的代码。
抄的网上,出处懒得找了(自我保护)。

 浙公网安备 33010602011771号