


【ELK】ELK安装与配置
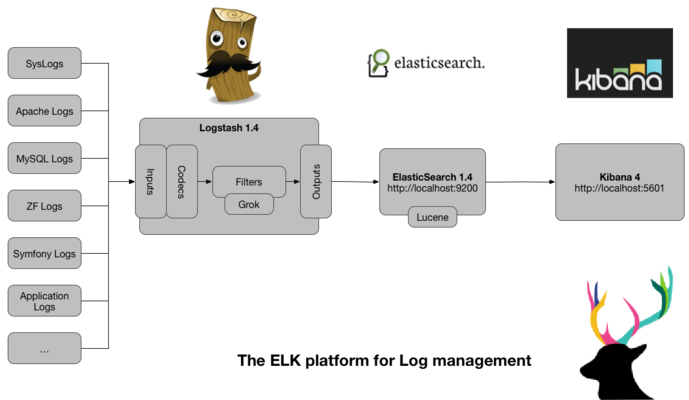
一、ELK体系结构
二、系统环境变量
【主机信息】
IP                           主机名                   操作系统版本
10.10.10.102                 console                 CentOS7.5
10.10.10.103                 log1                    CentOS7.5
10.10.10.104                 log2                    CentOS7.5
【软件包版本信息】
elasticsearch-6.4.0.tar.gz
logstash-6.4.0.tar.gz
kibana-6.4.0-linux-x86_64.tar.gz
node-v8.11.4-linux-x64.tar.gz
elasticsearch-head-master.zip
1. 设置主机名和IP映射
分别在上述三台机器的/etc/hosts文件中追加如下内容:
10.10.10.102 console
10.10.10.103 log1
10.10.10.104 log2
2.关于3台机器的防火墙,并设置开机不启动
#关闭防火墙
systemctl stop firewalld

#设置防火墙开机不启动
systemctl disable firewalld
3.修改3台机器的系统文件描述符大小
vim /etc/security/limits.conf

es         -            nofile           65536
4.增大3台机器的虚拟内存mmap count配置
vim  /etc/sysctl.conf
vm.max_map_count = 262144
#使修改生效
sysctl -p
5.在3台机器上分别新建用户es和日志文件目录
useradd es
mkdir  /esdata
chown -R es:es /esdata
6.在3台机器上都安装JDK1.8
三、Elasticsearch的安装与配置
1.分别在10.10.10.102、10.10.10.103、10.10.10.104机器上新建Elasticsearch安装目录并修改属主用户和组
mkdir -p  /usr/local/elasticsearch-6.4.0
chown -R es:es /usr/local/elasticsearch-6.4.0
2.登录10.10.10.102机器并切换到es用户,将elasticsearch-6.4.0.tar.gz解压到 /usr/local/elasticsearch-6.4.0目录下
tar -xf  /home/es/elasticsearch-6.4.0.tar.gz
cp -r *  /usr/local/elasticsearch-6.4.0
3.修改配置文件
console配置文件如下:
[es@console config]$ cat /usr/local/elasticsearch-6.4.0/config/elasticsearch.yml
# ======================== Elasticsearch Configuration =========================
#
# NOTE: Elasticsearch comes with reasonable defaults for most settings.
#       Before you set out to tweak and tune the configuration, make sure you
#       understand what are you trying to accomplish and the consequences.
#
# The primary way of configuring a node is via this file. This template lists
# the most important settings you may want to configure for a production cluster.
#
# Please consult the documentation for further information on configuration options:
# https://www.elastic.co/guide/en/elasticsearch/reference/index.html
#
# ---------------------------------- Cluster -----------------------------------
#
# Use a descriptive name for your cluster:
#
cluster.name: console                                #设置集群的名称为console
#
# ------------------------------------ Node ------------------------------------
#
# Use a descriptive name for the node:
#
node.name: console                                   #设置集群节点名称为console
node.master: true                                    #设置该节点是否为主节点,这里选择true,其他2台机器这里设置为false
#
# Add custom attributes to the node:
#
#node.attr.rack: r1
#
# ----------------------------------- Paths ------------------------------------
#
# Path to directory where to store the data (separate multiple locations by comma):
#
path.data: /esdata                                   #设置数据目录为/esdata
#
# Path to log files:
#
#path.logs: /path/to/logs
#
# ----------------------------------- Memory -----------------------------------
#
# Lock the memory on startup:
#
#bootstrap.memory_lock: true
#
#bootstrap.mlockall: true
#
# Make sure that the heap size is set to about half the memory available
# on the system and that the owner of the process is allowed to use this
# limit.
#
# Elasticsearch performs poorly when the system is swapping the memory.
#
# ---------------------------------- Network -----------------------------------
#
# Set the bind address to a specific IP (IPv4 or IPv6):
#
network.host: 10.10.10.102                     #这里配置的是console机器的IP,其他2台机器分别配置自己的IP
network.bind_host: 10.10.10.102                #同上
network.publish_host: 10.10.10.102             #同上

#
# Set a custom port for HTTP:
#
http.port: 9200                                #开启端口
#
# For more information, consult the network module documentation.
#
# --------------------------------- Discovery ----------------------------------
#
# Pass an initial list of hosts to perform discovery when new node is started:
# The default list of hosts is ["127.0.0.1", "[::1]"]
#
discovery.zen.ping.unicast.hosts: ["10.10.10.102:9300"]              #配置自动发现机制,其他2台机器也设置这个值
#
# Prevent the "split brain" by configuring the majority of nodes (total number of master-eligible nodes / 2 + 1):
#
discovery.zen.minimum_master_nodes: 1                                #设置发现的主节点个数为1
#
# For more information, consult the zen discovery module documentation.
#
# ---------------------------------- Gateway -----------------------------------
#
# Block initial recovery after a full cluster restart until N nodes are started:
#
#gateway.recover_after_nodes: 3
#
# For more information, consult the gateway module documentation.
#
# ---------------------------------- Various -----------------------------------
#
# Require explicit names when deleting indices:
#
#action.destructive_requires_name: true
log1配置文件:
[es@log1 config]$ cat elasticsearch.yml
# ======================== Elasticsearch Configuration =========================
#
# NOTE: Elasticsearch comes with reasonable defaults for most settings.
#       Before you set out to tweak and tune the configuration, make sure you
#       understand what are you trying to accomplish and the consequences.
#
# The primary way of configuring a node is via this file. This template lists
# the most important settings you may want to configure for a production cluster.
#
# Please consult the documentation for further information on configuration options:
# https://www.elastic.co/guide/en/elasticsearch/reference/index.html
#
# ---------------------------------- Cluster -----------------------------------
#
# Use a descriptive name for your cluster:
#
cluster.name: console
#
# ------------------------------------ Node ------------------------------------
#
# Use a descriptive name for the node:
#
node.name: log1
node.master: false
#
# Add custom attributes to the node:
#
#node.attr.rack: r1
#
# ----------------------------------- Paths ------------------------------------
#
# Path to directory where to store the data (separate multiple locations by comma):
#
path.data: /esdata
#
# Path to log files:
#
#path.logs: /path/to/logs
#
# ----------------------------------- Memory -----------------------------------
#
# Lock the memory on startup:
#
#bootstrap.memory_lock: true
#
#bootstrap.mlockall: true
#
# Make sure that the heap size is set to about half the memory available
# on the system and that the owner of the process is allowed to use this
# limit.
#
# Elasticsearch performs poorly when the system is swapping the memory.
#
# ---------------------------------- Network -----------------------------------
#
# Set the bind address to a specific IP (IPv4 or IPv6):
#
network.host: 10.10.10.103
network.bind_host: 10.10.10.103
network.publish_host: 10.10.10.103

#
# Set a custom port for HTTP:
#
http.port: 9200
#
# For more information, consult the network module documentation.
#
# --------------------------------- Discovery ----------------------------------
#
# Pass an initial list of hosts to perform discovery when new node is started:
# The default list of hosts is ["127.0.0.1", "[::1]"]
#
discovery.zen.ping.unicast.hosts: ["10.10.10.102:9300"]
#
# Prevent the "split brain" by configuring the majority of nodes (total number of master-eligible nodes / 2 + 1):
#
discovery.zen.minimum_master_nodes: 1
#
# For more information, consult the zen discovery module documentation.
#
# ---------------------------------- Gateway -----------------------------------
#
# Block initial recovery after a full cluster restart until N nodes are started:
#
#gateway.recover_after_nodes: 3
#
# For more information, consult the gateway module documentation.
#
# ---------------------------------- Various -----------------------------------
#
# Require explicit names when deleting indices:
#
#action.destructive_requires_name: true
log2配置文件:
[es@log2 config]$ cat elasticsearch.yml
# ======================== Elasticsearch Configuration =========================
#
# NOTE: Elasticsearch comes with reasonable defaults for most settings.
#       Before you set out to tweak and tune the configuration, make sure you
#       understand what are you trying to accomplish and the consequences.
#
# The primary way of configuring a node is via this file. This template lists
# the most important settings you may want to configure for a production cluster.
#
# Please consult the documentation for further information on configuration options:
# https://www.elastic.co/guide/en/elasticsearch/reference/index.html
#
# ---------------------------------- Cluster -----------------------------------
#
# Use a descriptive name for your cluster:
#
cluster.name: console
#
# ------------------------------------ Node ------------------------------------
#
# Use a descriptive name for the node:
#
node.name: log2
node.master: false
#
# Add custom attributes to the node:
#
#node.attr.rack: r1
#
# ----------------------------------- Paths ------------------------------------
#
# Path to directory where to store the data (separate multiple locations by comma):
#
path.data: /esdata
#
# Path to log files:
#
#path.logs: /path/to/logs
#
# ----------------------------------- Memory -----------------------------------
#
# Lock the memory on startup:
#
#bootstrap.memory_lock: true
#
#bootstrap.mlockall: true
#
# Make sure that the heap size is set to about half the memory available
# on the system and that the owner of the process is allowed to use this
# limit.
#
# Elasticsearch performs poorly when the system is swapping the memory.
#
# ---------------------------------- Network -----------------------------------
#
# Set the bind address to a specific IP (IPv4 or IPv6):
#
network.host: 10.10.10.104
network.bind_host: 10.10.10.104
network.publish_host: 10.10.10.104

#
# Set a custom port for HTTP:
#
http.port: 9200
#
# For more information, consult the network module documentation.
#
# --------------------------------- Discovery ----------------------------------
#
# Pass an initial list of hosts to perform discovery when new node is started:
# The default list of hosts is ["127.0.0.1", "[::1]"]
#
discovery.zen.ping.unicast.hosts: ["10.10.10.102:9300"]
#
# Prevent the "split brain" by configuring the majority of nodes (total number of master-eligible nodes / 2 + 1):
#
discovery.zen.minimum_master_nodes: 1
#
# For more information, consult the zen discovery module documentation.
#
# ---------------------------------- Gateway -----------------------------------
#
# Block initial recovery after a full cluster restart until N nodes are started:
#
#gateway.recover_after_nodes: 3
#
# For more information, consult the gateway module documentation.
#
# ---------------------------------- Various -----------------------------------
#
# Require explicit names when deleting indices:
#
#action.destructive_requires_name: true
4.后台启动Elasticsearch
/usr/local/elasticsearch-6.4.0/bin/elasticsearch -d
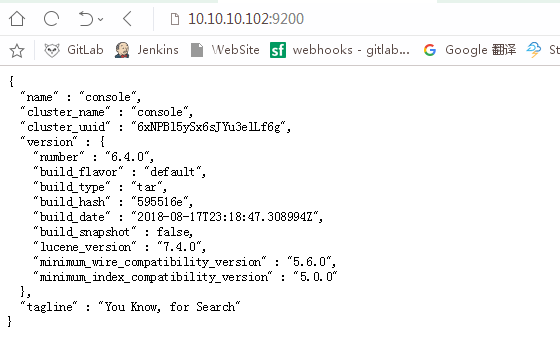
启动后显示如下:
5. 安装ElasticSearch head插件
由于ElasticSearch的界面展示的是Json文件,不是很友好。我们可以通过安装插件来解决它。
ElasticSearch_head 下载地址:https://github.com/troub1emaker0911/elasticsearch-head
ElasticSearch_head 需要node.js的支持。我们需要首先安装node.js
【安装node.js】
首先切换到root用户下,将node.js的安装包上传到console机器上。
#将node.js解压到目录/usr/local/node-v8.11.4
tar -xf node-v8.11.4-linux-x64.tar.xz -C /usr/local/node-v8.11.4
#设置符号链接
ln -s /usr/local/node-v8.11.4/bin/node /usr/local/bin/
ln -s /usr/local/node-v8.11.4/bin/npm /usr/local/bin/
#检查是否配置成功
node -v
npm -v
【安装ElasticSearch_head插件】
切换到es用户,将安装包上传到console机器上。
#解压文件
unzip  elasticsearch-head-master.zip

#将文件包移动到目录/usr/local下
mv  elasticsearch-head-master   /usr/local


cd  /usr/local/elasticsearch-head-master
npm install
#启动Elasticsearch-head-master
npm run start  > /dev/null 2>&1  &
执行上述步骤完成后,在浏览器中输入http://10.10.10.102:9100即可显示如下界面。
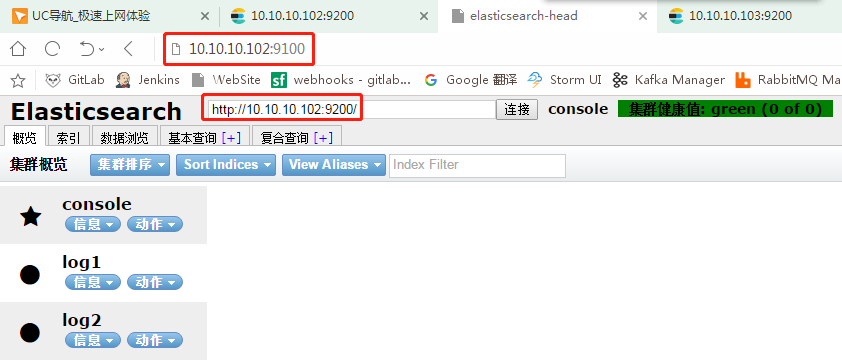
但是这样集群健康值是不可用的(截图中是我已经配置完毕的),我们需要在console机器的elasticsearch.yml文件中追加如下配置:
vim  /usr/local/elasticsearch-6.4.0/config/elasticsearch.yml
http.cors.enabled: true
http.cors.allow-origin: "*"
然后修改“连接”按钮前的地址,将原来的http://localhost:9200/修改为console的地址,即http://10.10.10.102:9200,然后点击“连接”,此时后面的“集群健康值”就变成green了。
6. 新建索引
切换到“索引”选项卡,点击“新建索引”,这里填写“索引名称”为book.
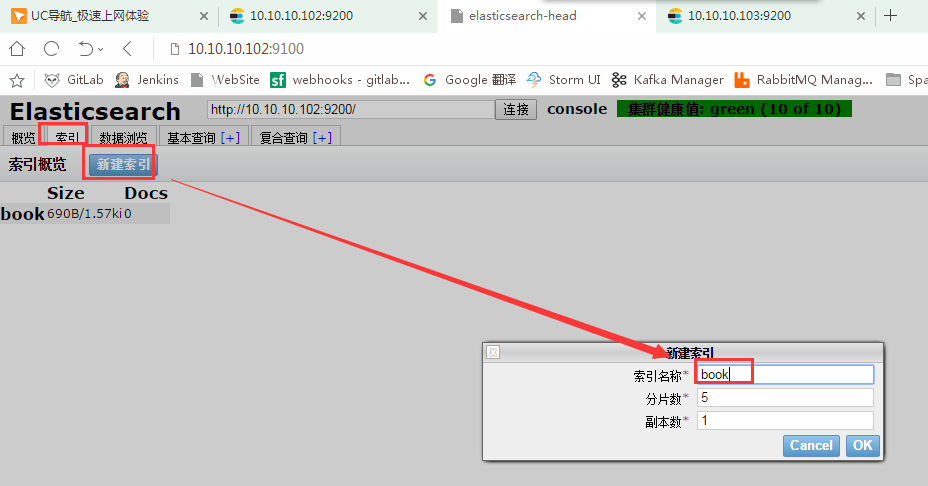
然后点击“概览”,就可以看到刚才新建的索引。

注意上图中的绿色块。有粗边框的为主,细边框的为备。
7.安装插件:中文分词器ik
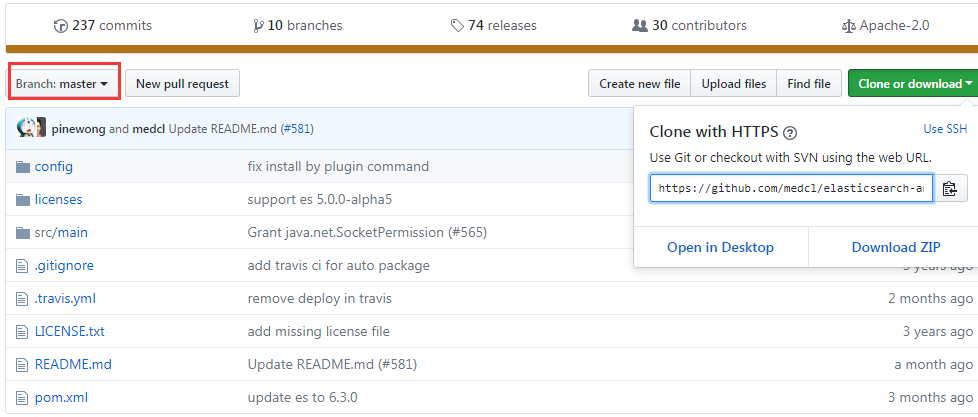
elasticsearch-analysis-ik 是一款中文的分词插件,支持自定义词库。项目地址为:https://github.com/medcl/elasticsearch-analysis-ik
(1)安装Maven
由于该项目使用了Maven来管理,源代码放到github上。所以要先在服务器上面安装Maven,便可以直接在服务器上面生成项目jar包,部署起来更加方便了。
yum install -y maven
(2)安装分词器ik
这里安装的版本是6.3.0
git clone https://github.com/medcl/elasticsearch-analysis-ik.git
[es@console ~]$ cd elasticsearch-analysis-ik/
[es@console elasticsearch-analysis-ik]$ mvn package
(3)复制和解压
[es@console elasticsearch-analysis-ik]$ mkdir -p /usr/local/elasticsearch/plugins/ik
[es@console elasticsearch-analysis-ik]$ cp target/releases/elasticsearch-analysis-ik-6.3.0.zip /usr/local/elasticsearch/plugins/ik
[es@console ~]$ cd /usr/local/elasticsearch/plugins/ik/
[es@console ik]$ unzip -oq elasticsearch-analysis-ik-6.3.0.zip
(4)重启Elasticsearch
[es@console ik]$ cd /usr/local/elasticsearch/bin/
[es@console bin]$ jps
20221 Jps
14910 Elasticsearch
[es@console bin]$ kill -9 14910
[es@console elasticsearch]$ bin/elasticsearch -d
注:在浏览器输入如下地址可以查看集群的nodes节点,但结果是json格式,不是很易读,可以将其格式化。
http://10.10.10.102:9200/_nodes
四、Logstash的安装与配置
Logstash 是一款强大的数据处理工具,它可以实现数据传输,格式处理,格式化输出,还有强大的插件功能,常用于日志处理。
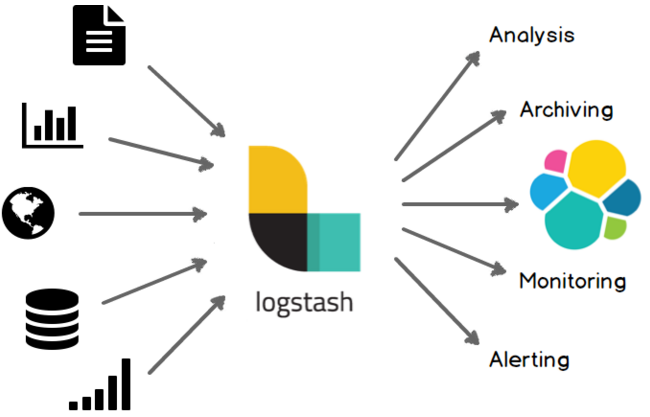
Logstash工作的三个阶段:
1.安装Logstash
#切换到es用户下,解压安装包到指定目录下
tar -xf  logstash-6.4.0.tar.gz  -C  /usr/local/logstash-6.4.0
至此,Logstash安装完成
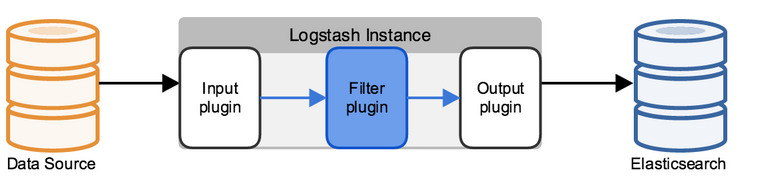
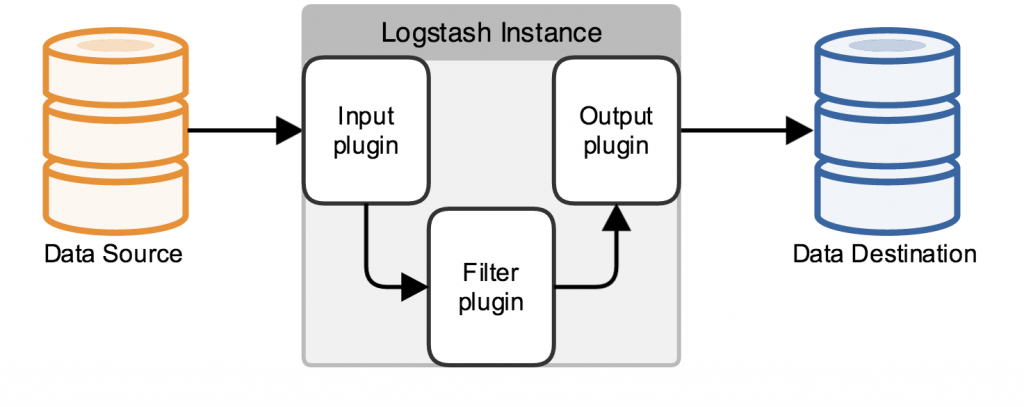
2.Logstash简介
Logstash是一个开源的、接受来自多种数据源(input)、过滤你想要的数据(filter)、存储到其他设备的日志管理程序。Logstash包含三个基本插件input\filter\output,一个基本的logstash服务必须包含input和output.
Logstash如何工作:
Logstash数据处理有三个阶段,input–>filter–>output.input生产数据,filter根据定义的规则修改数据,output将数据输出到你定义的存储位置。
Inputs:
数据生产商,包含以下几个常用输出:
-
file: 从文件系统中读取文件,类似使用tail -0F
-
syslog: syslog服务,监听在514端口使用RFC3164格式
-
redis: 从redis服务读取,使用redis管道和列表。
-
beats: 一种代理,自己负责收集好数据然后转发给Logstash,常用的如filebeat.
Filters:
filters相当一个加工管道,它会一条一条过滤数据根据你定义的规则,常用的filters如下:
-
grok: 解析无规则的文字并转化为有结构的格式。
-
mutate: 丰富的基础类型处理,包括类型转换、字符串处理、字段处理等。
-
drop: 丢弃一部分events不进行处理,例如: debug events
-
clone: 负责一个event,这个过程中可以添加或删除字段。
-
geoip: 添加地理信息(为前台kibana图形化展示使用)
Outputs:
-
elasticserache elasticserache接收并保存数据,并将数据给kibana前端展示。
-
output 标准输出,直接打印在屏幕上。
3.Logstash举例
bin/logstash -e 'input { stdin { } } output { stdout {} }'
我们现在可以在命令行下输入一些字符,然后我们将看到logstash的输出内容:
[es@console logstash-6.4.0]$ bin/logstash -e 'input { stdin { } } output { stdout {} }'
hello world
Sending Logstash logs to /usr/local/logstash-6.4.0/logs which is now configured via log4j2.properties
[2018-09-14T22:33:52,155][WARN ][logstash.config.source.multilocal] Ignoring the 'pipelines.yml' file because modules or command line options are specified
[2018-09-14T22:33:54,402][INFO ][logstash.runner          ] Starting Logstash {"logstash.version"=>"6.4.0"}
[2018-09-14T22:34:00,577][INFO ][logstash.pipeline        ] Starting pipeline {:pipeline_id=>"main", "pipeline.workers"=>1, "pipeline.batch.size"=>125, "pipeline.batch.delay"=>50}
[2018-09-14T22:34:00,931][INFO ][logstash.pipeline        ] Pipeline started successfully {:pipeline_id=>"main", :thread=>"#<Thread:0x3f32496 run>"}
The stdin plugin is now waiting for input:
[2018-09-14T22:34:01,199][INFO ][logstash.agent           ] Pipelines running {:count=>1, :running_pipelines=>[:main], :non_running_pipelines=>[]}
{
      "@version" => "1",
       "message" => "hello world",
    "@timestamp" => 2018-09-14T14:34:01.245Z,
          "host" => "console"
}
[2018-09-14T22:34:02,693][INFO ][logstash.agent           ] Successfully started Logstash API endpoint {:port=>9600}
我们再运行另一个命令:
bin/logstash -e 'input { stdin { } } output { stdout { codec => rubydebug } }'
然后输入helloworld,查看显示的内容:
[es@console logstash-6.4.0]$ bin/logstash -e 'input { stdin { } } output { stdout { codec => rubydebug } }'
helloworld
Sending Logstash logs to /usr/local/logstash-6.4.0/logs which is now configured via log4j2.properties
[2018-09-12T03:07:33,884][WARN ][logstash.config.source.multilocal] Ignoring the 'pipelines.yml' file because modules or command line options are specified
[2018-09-12T03:07:36,017][INFO ][logstash.runner          ] Starting Logstash {"logstash.version"=>"6.4.0"}
[2018-09-12T03:07:43,294][INFO ][logstash.pipeline        ] Starting pipeline {:pipeline_id=>"main", "pipeline.workers"=>1, "pipeline.batch.size"=>125, "pipeline.batch.delay"=>50}
[2018-09-12T03:07:43,646][INFO ][logstash.pipeline        ] Pipeline started successfully {:pipeline_id=>"main", :thread=>"#<Thread:0x7cefe25 run>"}
The stdin plugin is now waiting for input:
[2018-09-12T03:07:43,872][INFO ][logstash.agent           ] Pipelines running {:count=>1, :running_pipelines=>[:main], :non_running_pipelines=>[]}
{
          "host" => "console",
      "@version" => "1",
    "@timestamp" => 2018-09-11T19:07:43.813Z,
       "message" => "helloworld"
}
[2018-09-12T03:07:45,292][INFO ][logstash.agent           ] Successfully started Logstash API endpoint {:port=>9600}
以上示例通过重新设置了叫”stdout”的output(添加了”codec”参数),我们就可以改变Logstash的输出表现。类似的我们可以通过在你的配置文件中添加或者修改inputs、outputs、filters,就可以使随意的格式化日志数据成为可能,从而订制更合理的存储格式为查询提供便利。
前面已经说过Logstash必须有一个输入和一个输出,上面的例子表示从终端上输入并输出到终端。
数据在线程之间以事件的形式流传。不要叫行,因为Logstash可以处理多行事件。
input {
# 输入域,可以使用上面提到的几种输入方式。stdin{} 表示标准输入,file{} 表示从文件读取。
input的各种插件: https://www.elastic.co/guide/en/logstash/current/input-plugins.html
}
output {
#Logstash的功能就是对数据进行加工,上述例子就是Logstash的格式化输出,当然这是最简单的。
output的各种插件:https://www.elastic.co/guide/en/logstash/current/output-plugins.html
}
Logstash配置文件和命令:
Logstash的默认配置已经够我们使用了,从5.0后使用logstash.yml文件,可以将一些命令行参数直接写到YAML文件即可。
-
–configtest 或 -t 用于测试Logstash的配置语法是否正确,非常好的一个参数。
-
–log 或 -l Logstash默认输出日志到标准输出,指定Logstash的日志存放位置
-
–pipeline-workers 或 -w 指定运行filter和output的pipeline线程数量,使用默认就好。
-
-f 指定规则文件,可以将自己的文件放在同一个路径下,使用-f 即可运行。
一个简单的Logstash从文件中读取配置:
vim file.conf  #file.conf可以放在任意位置
input {
         stdin {
         }
}
output {
         stdout {
                 codec=>rubydebug
         }
}
~
bin/logstash -f /root/conf/file.conf  #启动即可
3. 插件
(1)grok插件
Grok是Logstash最重要的插件,你可以在grok里自定义好命名规则,然后在grok参数或者其他正则表达式中引用它。
官方给出了120个左右默认的模式:https://github.com/logstash-plugins/logstash-patterns-core/tree/master/patterns
USERNAME [a-zA-Z0-9._-]+
USER %{USERNAME}
第一行,用普通的正则表达式来定义一个grok表达式;第二行,通过打印赋值格式,用前面定义好的grok表达式来定义里一个grok表达式。
正则表达式引格式:
%{SYNTAX:SEMANTIC}
-
SYNTAX:表示你的规则是如何被匹配的,比如3.14将会被NUMBER模式匹配,55.1.1.2将会被IP模式匹配。
-
SEMANTIC:表示被匹配到的唯一标识符,比如3.14被匹配到了后,SEMANTIC就当是3.14。
匹配到的数据默认是strings类型,当然你也可以装换你匹配到的数据,类似这样:
%{NUMBER:num:int}
当前只支持装换为int和float。
例如:
[es@console config]$ more file.conf
input
    {
     stdin {
     }
}
filter {
     grok {
       match => {
          "message" => "%{WORD} %{NUMBER:request_time:float} %{WORD}"
       }
     }
}
output {
     stdout {
             codec=>rubydebug
     }
}
然后运行logstash
[es@console logstash-6.4.0]$ bin/logstash -f /usr/local/logstash-6.4.0/config/file.conf
结果如下:
monkey 12.12 beta
{
         "message" => "monkey 12.12 beta",
        "@version" => "1",
      "@timestamp" => 2018-09-17T08:18:42.416Z,
            "host" => "console",
    "request_time" => 12.12
}
这个我们就匹配到我们想要的值了,并将名字命名为:request_time
在实际生产中为了方便我们不可能在配置文件中一行一行的写表达式,建议把所有的grok表达式统一写到一个地方,使用patterns_dir选项来引用。
grok {
        patterns_dir => "/root/conf/nginx"  #这是你定义的grok表达式文件
        match => { "message" => "%{CDN_FORMAT}" }
        add_tag => ["CDN"]
 }
事实上,我们收集的日志也有很多不需要的地方,我们可以删除一部分field信息,保留我们想要的那一部分。
grok {
       match => {
                "message" => "%{WORD} %{NUMBER:request_time:float} %{WORD}"
        }
        remove_field => [ "request_time" ]
        overwrite => [ "message" ]
        }
as 12 as
{
    "@timestamp" => 2017-02-08T06:39:07.921Z,
      "@version" => "1",
          "host" => "0.0.0.0",
       "message" => "as 12 as"
}
已经没有request_time这个field啦~
更多关于grok的用户看官方文档:https://www.elastic.co/guide/en/logstash/current/plugins-filters-grok.html
最重要的一点:我强烈建议每个人都要使用 Grok Debugger 来调试自己的 grok 表达式。
(2)kv插件
(3)geoip插件
geoip主要是查询IP地址归属地,用来判断访问网站的来源地。
[es@console config]$ more file.conf
input
    {
     stdin {
     }
}
filter {
     grok {
       match => {
          "message" => "%{WORD} %{NUMBER:request_time:float} %{WORD}"
       }
     }
     geoip {
       source => "clientip"
       fields => [ "ip","city_name","country_name","location" ]
     }
}
output {
     stdout {
             codec=>rubydebug
     }
}
参考文档:https://www.cnblogs.com/blogjun/articles/8064646.html
四、Kibana的安装与配置
Kibana是一个开源的分析与可视化平台,设计出来用于和Elasticsearch一起使用的。你可以用kibana搜索、查看、交互存放在Elasticsearch索引里的数据,
使用各种不同的图表、表格、地图等kibana能够很轻易地展示高级数据分析与可视化。
Kibana让我们理解大量数据变得很容易。它简单、基于浏览器的接口使你能快速创建和分享实时展现Elasticsearch查询变化的动态仪表盘。

# 简单来讲他具体的工作流程就是 logstash agent 监控并过滤日志,logstash index将日志收集在一起交给全文搜索服务ElasticSearch 可以用ElasticSearch进行自定义搜索 通过Kibana 来结合 自定义搜索进行页面展示,如上图。
1.安装Kibana
#新建安装目录
mkdir -p /usr/local/kibana-6.4.0
#解压安装包并将解压后的复制到相应目录下
tar -xf kibana-6.4.0.tar.gz
#修改安装目录的属主和用户
cp -r * /root/software/kibana-6.4.0 /usr/local/kibana-6.4.0
2.配置Kibana与启动
修改kibana的配置文件kibana.yml, 配置后的结果如下:
[root@console config]# more /usr/local/kibana-6.4.0/config/kibana.yml
# Kibana is served by a back end server. This setting specifies the port to use.
server.port: 5601                      #配置kibana的端口号

# Specifies the address to which the Kibana server will bind. IP addresses and host names are both valid values.
# The default is 'localhost', which usually means remote machines will not be able to connect.
# To allow connections from remote users, set this parameter to a non-loopback address.
server.host: "10.10.10.102"            #配置kibana安装的主机的IP

# Enables you to specify a path to mount Kibana at if you are running behind a proxy.
# Use the `server.rewriteBasePath` setting to tell Kibana if it should remove the basePath
# from requests it receives, and to prevent a deprecation warning at startup.
# This setting cannot end in a slash.
#server.basePath: ""

# Specifies whether Kibana should rewrite requests that are prefixed with
# `server.basePath` or require that they are rewritten by your reverse proxy.
# This setting was effectively always `false` before Kibana 6.3 and will
# default to `true` starting in Kibana 7.0.
#server.rewriteBasePath: false

# The maximum payload size in bytes for incoming server requests.
#server.maxPayloadBytes: 1048576

# The Kibana server's name.  This is used for display purposes.
server.name: "console"

# The URL of the Elasticsearch instance to use for all your queries.
elasticsearch.url: "http://10.10.10.102:9200"   #配置Elasticsearch安装主机的IP地址和端口

# When this setting's value is true Kibana uses the hostname specified in the server.host
# setting. When the value of this setting is false, Kibana uses the hostname of the host
# that connects to this Kibana instance.
#elasticsearch.preserveHost: true

# Kibana uses an index in Elasticsearch to store saved searches, visualizations and
# dashboards. Kibana creates a new index if the index doesn't already exist.
#kibana.index: ".kibana"

# The default application to load.
#kibana.defaultAppId: "home"

# If your Elasticsearch is protected with basic authentication, these settings provide
# the username and password that the Kibana server uses to perform maintenance on the Kibana
# index at startup. Your Kibana users still need to authenticate with Elasticsearch, which
# is proxied through the Kibana server.
#elasticsearch.username: "user"
#elasticsearch.password: "pass"

# Enables SSL and paths to the PEM-format SSL certificate and SSL key files, respectively.
# These settings enable SSL for outgoing requests from the Kibana server to the browser.
#server.ssl.enabled: false
#server.ssl.certificate: /path/to/your/server.crt
#server.ssl.key: /path/to/your/server.key

# Optional settings that provide the paths to the PEM-format SSL certificate and key files.
# These files validate that your Elasticsearch backend uses the same key files.
#elasticsearch.ssl.certificate: /path/to/your/client.crt
#elasticsearch.ssl.key: /path/to/your/client.key

# Optional setting that enables you to specify a path to the PEM file for the certificate
# authority for your Elasticsearch instance.
#elasticsearch.ssl.certificateAuthorities: [ "/path/to/your/CA.pem" ]

# To disregard the validity of SSL certificates, change this setting's value to 'none'.
#elasticsearch.ssl.verificationMode: full

# Time in milliseconds to wait for Elasticsearch to respond to pings. Defaults to the value of
# the elasticsearch.requestTimeout setting.
#elasticsearch.pingTimeout: 1500

# Time in milliseconds to wait for responses from the back end or Elasticsearch. This value
# must be a positive integer.
#elasticsearch.requestTimeout: 30000

# List of Kibana client-side headers to send to Elasticsearch. To send *no* client-side
# headers, set this value to [] (an empty list).
#elasticsearch.requestHeadersWhitelist: [ authorization ]

# Header names and values that are sent to Elasticsearch. Any custom headers cannot be overwritten
# by client-side headers, regardless of the elasticsearch.requestHeadersWhitelist configuration.
#elasticsearch.customHeaders: {}

# Time in milliseconds for Elasticsearch to wait for responses from shards. Set to 0 to disable.
#elasticsearch.shardTimeout: 30000

# Time in milliseconds to wait for Elasticsearch at Kibana startup before retrying.
#elasticsearch.startupTimeout: 5000

# Logs queries sent to Elasticsearch. Requires logging.verbose set to true.
#elasticsearch.logQueries: false

# Specifies the path where Kibana creates the process ID file.
#pid.file: /var/run/kibana.pid

# Enables you specify a file where Kibana stores log output.
#logging.dest: stdout

# Set the value of this setting to true to suppress all logging output.
#logging.silent: false

# Set the value of this setting to true to suppress all logging output other than error messages.
#logging.quiet: false

# Set the value of this setting to true to log all events, including system usage information
# and all requests.
#logging.verbose: false

# Set the interval in milliseconds to sample system and process performance
# metrics. Minimum is 100ms. Defaults to 5000.
#ops.interval: 5000

# The default locale. This locale can be used in certain circumstances to substitute any missing
# translations.
#i18n.defaultLocale: "en"
#
#
启动kibana:
cd /usr/local/kibana-6.4.0
./bin/kibana
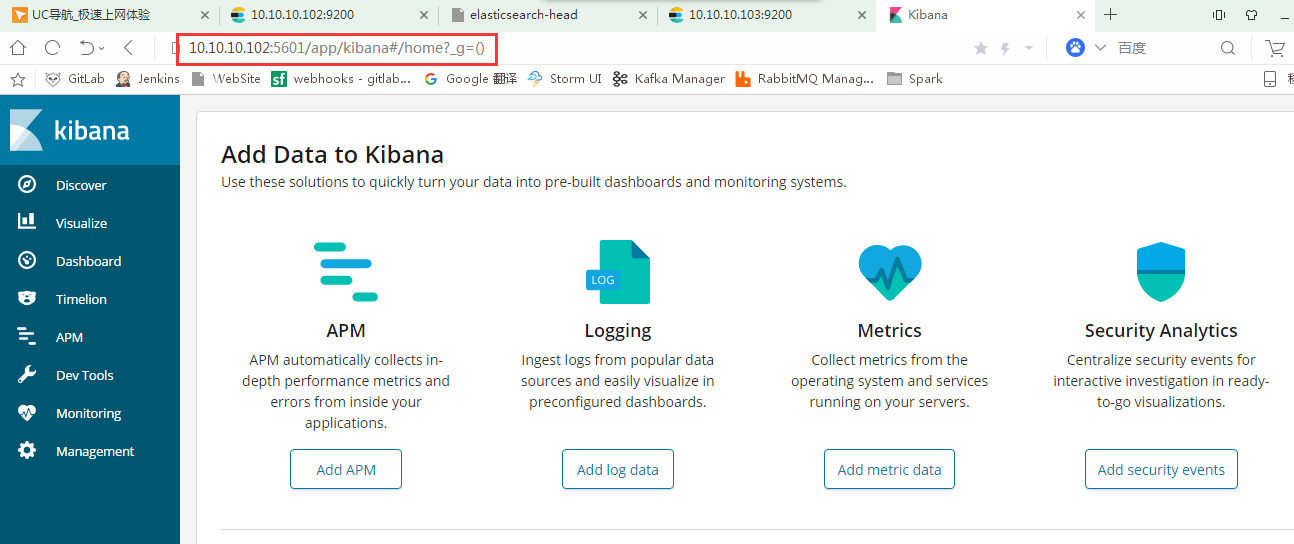
成功启动后,在浏览器输入http://10.10.10.102:5601,界面如下:
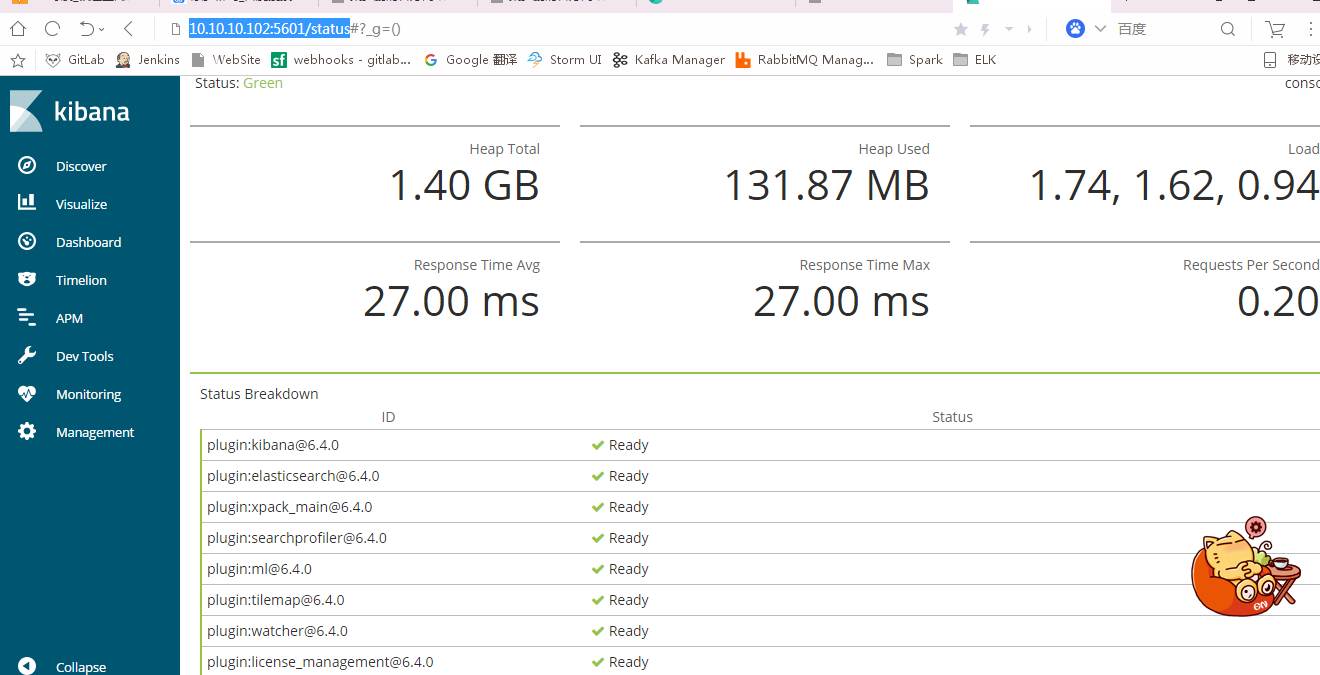
如下地址可以查看kibana的状态和资源使用情况:
10.10.10.102:5601/status
3.

 浙公网安备 33010602011771号