How to use the powermetrics shell command to check for power information on macOS?
How to use the powermetrics shell command to check for power information on macOS?
如何使用 powermetrics shell 命令检查 macOS 的电源信息?
powermetrics
收集并显示CPU和功耗统计信息。
Syntax
powermetrics [-i sample_interval_ms] [-r order] [-t wakeup_cost]
[-o output_file] [-n sample_count]
Options
-a N, --poweravg N
Display poweravg every N samples (0=disabled) [default: 10]
-b size, --buffer-size size
Set output buffer size (0=none, 1=line)
-f format, --format format
Display data in specified format [default: text]
[text] human-readable text output
[plist] machine-readable property list, NUL-separated
-h, --help
Print help: sort orders, output formats and samplers available on your machine.
-i N, --sample-rate N
# Sample every N ms (0=disabled) [default: 5000ms] ✅
-n N, --sample-count N
Obtain N periodic samples (0=infinite) [default: 0]
-o file, --output-file file
# Output to file instead of stdout.
-r method, --order method
Order process list using specified method [default: composite]
[pid] process identifier
[wakeups] total package idle wakeups (alias: -W)
[cputime] total CPU time used (alias: -C)
[composite] energy number, see --show-process-energy (alias: -O)
-s samplers, --samplers samplers
Comma separated list of samplers and sampler groups.
Run with -h to see a list of samplers and sampler groups.
Specifying "default" will display the default set, and specifying "all" will
display all supported samplers.
-t N, --wakeup-cost N
Assume package idle wakeups have a CPU time cost of N us when using hybrid sort
orders using idle wakeups with time-based metrics
--show-all
Enables all samplers and displays all the available information for each sampler.
--hide-cpu-duty-cycle
Hide CPU duty cycle data.
--show-cpu-qos
Show per cpu QOS breakdowns.
--show-initial-usage
Print initial sample for entire uptime.
--show-process-coalition
Group processes by coalitions and show per coalition information.
Processes that have exited during the sample will still have their time billed to
the coalition, making this useful for disambiguating DEAD_TASK time.
--show-plimits
Show plimits, forced idle and RMBS. Only available on certain hardware.
--show-process-energy
Show per-process energy impact number. This number is a rough proxy for the total
energy the process uses, including CPU, GPU, disk io and networking. The weighting
of each is platform specific.
Enabling this implicitly enables sampling of all the above per-process statistics.
--show-process-gpu
Show per-process gpu time. This is only available on certain hardware.
--show-process-io
Show per-process io information
--show-process-ipc
Show per-process Instructions and cycles on ARM machines.
Use with --show-process-amp to show cluster stats.
--show-process-qos
Show QOS times aggregated by process.
Per thread information is not available.
--show-process-qos-tiers
Show per-process qos latency and throughput tier.
--show-process-netstats
Show per-process network information.
--show-process-samp-norm
Show CPU time normailzed by the sample window, rather than the process start time.
For example a process that launched 1 second before the end of a 5 second sample
window and ran continuously until the end of the window will show up as 200 ms/s
here and 1000 ms/s in the regular column.
--show-process-wait-times
Show per-process sfi wait time info.
--show-pstates
Show pstate distribution. Only available on certain hardware.
--show-responsible-pid
Show responsible pid for xpc services and parent pid.
--show-usage-summary
Print final usage summary when exiting.
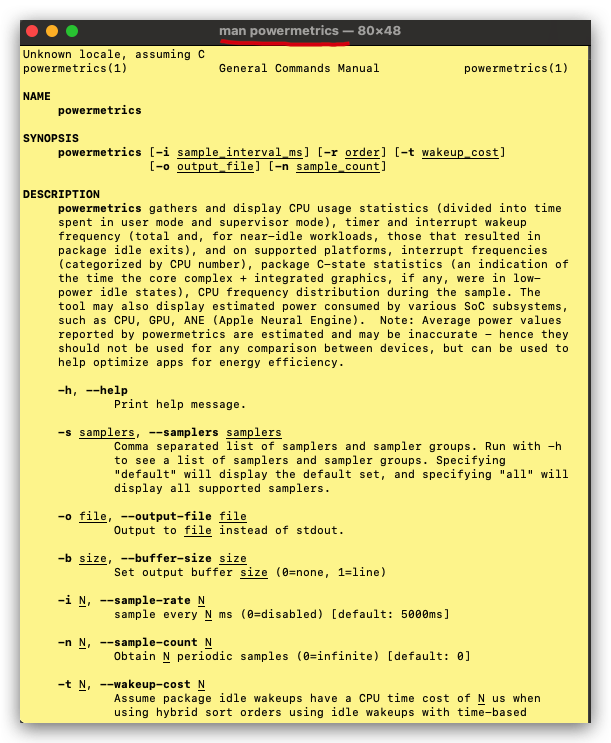
powermetrics gathers and display CPU usage statistics (divided into time spent in user mode and supervisor mode), timer and interrupt wakeup frequency (total and, for near-idle workloads, those that resulted in package idle exits), and on supported platforms, interrupt frequencies (categorized by CPU number), package C-state statistics (an indication of the time the core complex + integrated graphics, if any, were in low-power idle states), CPU frequency distribution during the sample.
The tool may also display estimated power consumed by various SoC subsystems, such as CPU, GPU, ANE (Apple Neural Engine).
Note: Average power values reported by powermetrics are estimated and may be inaccurate - hence they should not be used for any
comparison between devices, but can be used to help optimize apps for energy efficiency.
Changes in system time and sleep/wake can cause minor inaccuracies in reported cpu time.
Guidelines for energy reduction
CPU time, deadlines and interrupt wakeups: Lower is better
Interrupt counts: Lower is better
C-state residency: Higher is better

https://ss64.com/mac/powermetrics.html#:~:text=powermetrics
demos
# List the most recent processes:
$ sudo powermetrics --samplers tasks --show-process-coalition --show-process-gpu -n 1 -i 500

# List the thermal pressure:
$ sudo powermetrics --samplers thermal -n 1 -i 1

# Retrieve gpu_power stats 3 times, once every second:
$ sudo powermetrics --samplers gpu_power -n 3 -i 1000

# Retrieve network stats 3 times, once every second:
$ sudo powermetrics --samplers network -n 3 -i 1000

# List the other samplers available:
$ sudo -h
SMC version: Unknown
$ sudo powermetrics --samplers smc
Password:
unable to get smc values
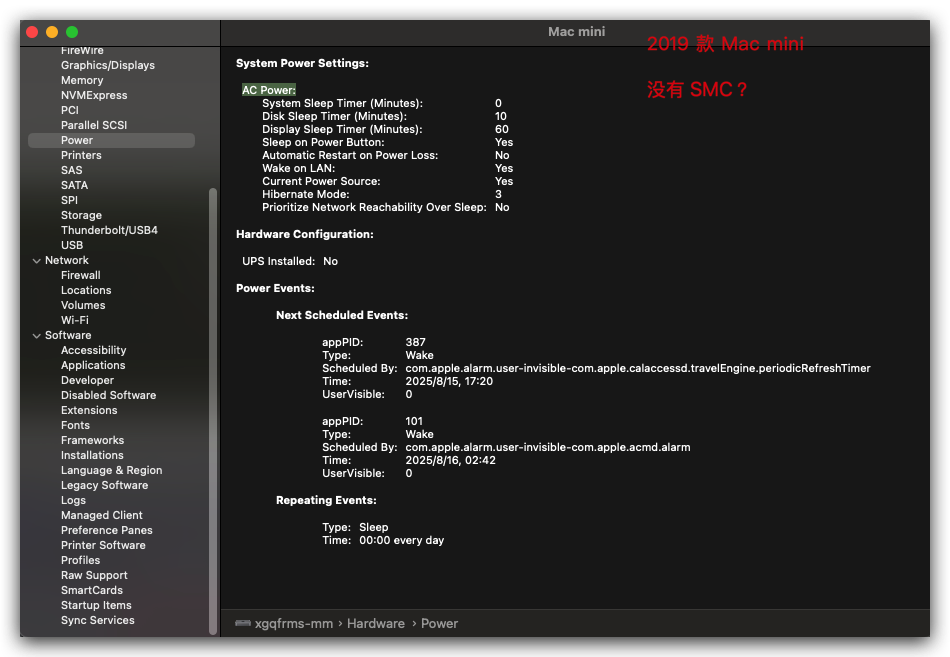
Machine model: Macmini8,1
SMC version: Unknown
EFI version: 2075.4.0
OS version: 24G84
Boot arguments:
Boot time: Tue Aug 12 23:35:55 2025
*** Sampled system activity (Fri Aug 15 13:31:04 2025 +0800) (5001.11ms elapsed) ***
# ...

2019 款 Mac mini 没有 SMC ❓
(🐞 反爬虫测试!打击盗版⚠️)如果你看到这个信息, 说明这是一篇剽窃的文章,请访问 https://www.cnblogs.com/xgqfrms/ 查看原创文章!
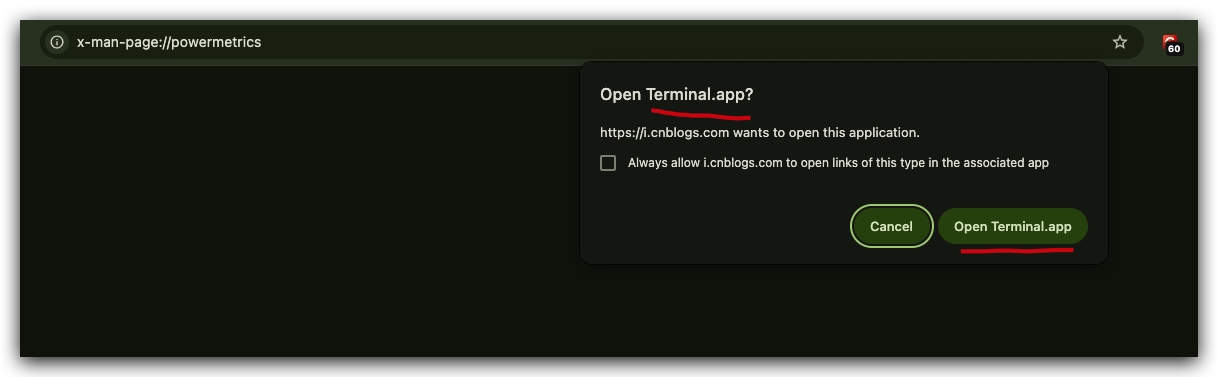
x-man-page

refs
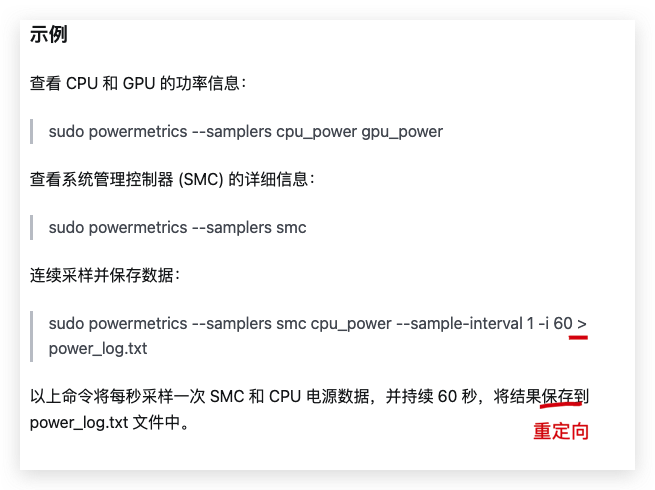
# 每秒采样⼀次 SMC 和 CPU 电源数据,并持续 60 秒,将结果保存到 power_log.txt ⽂件中
$ sudo powermetrics --samplers smc cpu_power --sample-interval 1 -i 60 > power_log.txt

# --sample-interval
$ sudo powermetrics --samplers smc cpu_power --sample-interval 1 -i 60 > power_log.md
https://zhuanlan.zhihu.com/p/9392804345
©xgqfrms 2012-2021
www.cnblogs.com/xgqfrms 发布文章使用:只允许注册用户才可以访问!
原创文章,版权所有©️xgqfrms, 禁止转载 🈲️,侵权必究⚠️!
本文首发于博客园,作者:xgqfrms,原文链接:https://www.cnblogs.com/xgqfrms/p/19038822
未经授权禁止转载,违者必究!

 浙公网安备 33010602011771号