kibana使用日志时间进行排序
kibana默认的是按照客户端的采集时间(@timestamp)进行排序,这往往不是我们所需要的,我们需要的是对日志实际时间进行排序,要解决这个问题,有很多种方法,可以在elasticsearch建立索引,不采取默认的索引模式,当然这种方法比较繁琐,需要懂得如何在elasticsearch建立索引及运用索引;今天我们主要研究的是另一种方法,通logstash的过滤插件将日志时间转换成默认@timestamp进行排序;
1、我们要解析的时间格式是标准的java日期格式:
2019-06-18 10:21:49,755
2、一般解析:
input {
    stdin {}
 }
filter {
    grok {
        match => ["message", "%{TIMESTAMP_ISO8601:times}"]
    }
 }
output {
    stdout {
        codec=>rubydebug{}
    }
 }
将我们的时间解析出来
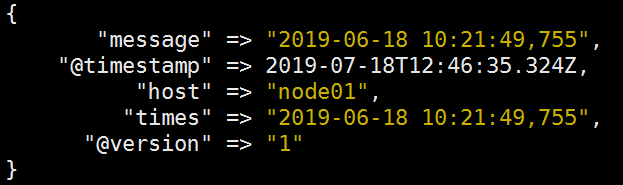
可以发现@timestamp为我们实际的采集时间,而time才是我们所需要的日志时间。
3、使用data插件解析:
input {
    stdin {}
 }
filter {
    grok {
        match => ["message", "%{TIMESTAMP_ISO8601:times}"]
    }
    date {
        match => ["times", "yyyy-MM-dd HH:mm:ss,SSS"]
    }
 }
output {
    stdout {
        codec=>rubydebug{}
    }
 }
这里的"yyyy-MM-dd HH:mm:ss,SSS"是时间格式,常用的格式有:
nginx access日志:"dd/MMM/yyyy:HH:mm:ss Z"
nginx error日志:"yyyy/MM/dd HH:mm:ss"
tomcat access日志:"dd/MMM/yyyy:HH:mm:ss Z"
tomcat catalina.out日志:"yyyy-MM-dd HH:mm:ss,SSS"
date其他详细内容介绍见官网https://www.elastic.co/guide/en/logstash/6.8/plugins-filters-date.html;

通过解析可以看到已经解析出我们需要的时间,但是可以看到解析出来的时间要比实际时间少了八个小时,并且第一次解析还会有提示,大致的意思是该文件已经弃用,在低版本,是可以通过修改这个文件来修复时间,现在弃用了,只能使用配置来满足需求。具体是通过在date下添加参数,并移除多余字段。
input {
    stdin {}
 }
filter {
    grok {
        match => ["message", "%{TIMESTAMP_ISO8601:times}"]
    }
    date {
        match => ["times", "yyyy-MM-dd HH:mm:ss,SSS"]
        locale => "en"
        timezone => "+00:00"
        remove_field => "times"
    }
 }
output {
    stdout {
        codec=>rubydebug{}
    }
 }
经解析
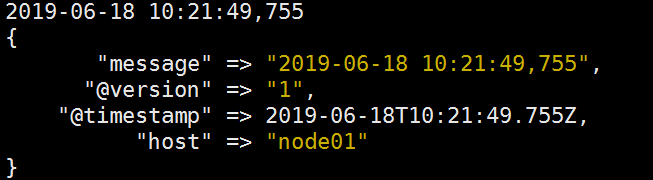
通过最后一次解析,达到了我们的需求;
有时候通过上面的方法,可能也会不成功,那么可以使用下面这种方法,在解析时间时,更新@timestamp事件的字段;虽然是默认更新,但是由于某些原因,并不能默认解析,需要手动添加
date {
      match => ["times", "yyyy-MM-dd HH:mm:ss"]
      target => "@timestamp"
}
到此本次研究结束,可以将配置导入到生产中!

 浙公网安备 33010602011771号