

spring-cloud-hystrix-dasboard服务调用监控
Hystrix仪表盘:
在断路器原理的介绍中 ,我们多次提到关千请求命令的度量指标的判断。这些度量指标都是HystrixComrnand和HystrixObservableComrnand实例在执行过程中记录的重要信息, 它们除了在Hystrix断路器实现中使用之外,对千系统运维也有非常大的帮助 。这些指标信息会以“ 滚动时间窗 ”与“ 桶 ”结合的方式进行汇总,并在内存中驻留一 段时间,以供内部或外部进行查询使用,包括每秒执行多少请求,多少成功,多少失败等。Netflix通过hystrix-metrics-event-stream项目实现了对以上指标的监控。SpringCloud也提供了hystrix dashboard的整合,对监控内容转化成可视化界面。Hystrix仪表盘就是这些指标内容的消费者之 一 。通过之前的内容,我们已经体验到了Spring Cloud对Hystrix的优雅整合。除此之外,Spring Cloud还完美地整合了它的仪表盘组件Hystrix Dashboard, 它主要用来 实时监控Hystrix的各项指标信息。通过HystrixDashboard反馈的实时信息,可以帮助我们快速发现系统中存在的问题,从而及时地采取应对措施。构建一个Hystrix Dashboard 来对RIBBON-SERVER实现监控。
在 Spring Cloud 中构建 一 个 Hystrix Dashboard 非常简单, 只需要下面 4 步:
<properties>
        <project.build.sourceEncoding>UTF-8</project.build.sourceEncoding>
        <project.reporting.outputEncoding>UTF-8</project.reporting.outputEncoding>
        <java.version>1.8</java.version>
        <spring-cloud.version>Finchley.SR3</spring-cloud.version>
    </properties>

    <dependencyManagement>
        <dependencies>
            <dependency>
                <!-- SpringCloud 所有子项目 版本集中管理. 统一所有SpringCloud依赖项目的版本依赖-->
                <groupId>org.springframework.cloud</groupId>
                <artifactId>spring-cloud-dependencies</artifactId>
                <version>${spring-cloud.version}</version>
                <type>pom</type>
                <scope>import</scope>
            </dependency>
        </dependencies>
    </dependencyManagement>

    <dependencies>
        <dependency>
            <groupId>org.springframework.cloud</groupId>
            <artifactId>spring-cloud-starter-hystrix</artifactId>
            <version>1.4.6.RELEASE</version>
        </dependency>
        <dependency>
            <groupId>org.springframework.cloud</groupId>
            <artifactId>spring-cloud-starter-hystrix-dashboard</artifactId>
            <version>1.4.6.RELEASE</version>
        </dependency>
        <dependency>
            <groupId>org.springframework.boot</groupId>
            <artifactId>spring-boot-starter-actuator</artifactId>
        </dependency>
    </dependencies>

    <build>
        <plugins>
            <plugin><!-- SpringBoot 项目打jar包的Maven插件 -->
                <groupId>org.springframework.boot</groupId>
                <artifactId>spring-boot-maven-plugin</artifactId>
            </plugin>
        </plugins>
    </build>
2.修改application.yml
server:
  port: 9005

spring:
  application:
    name: hystrix-dasboard #服务注册到Eureka上使用的名称
3.修改启动类
@SpringBootApplication
@EnableHystrixDashboard //开启仪表盘图形化监控的注解
public class HystrixDasboardApp {
    private final static Logger log = LoggerFactory.getLogger(HystrixDasboardApp.class);

    public static void main(String[] args) {
        SpringApplication.run(HystrixDasboardApp.class,args);
        log.info("服务启动成功");
    }
}
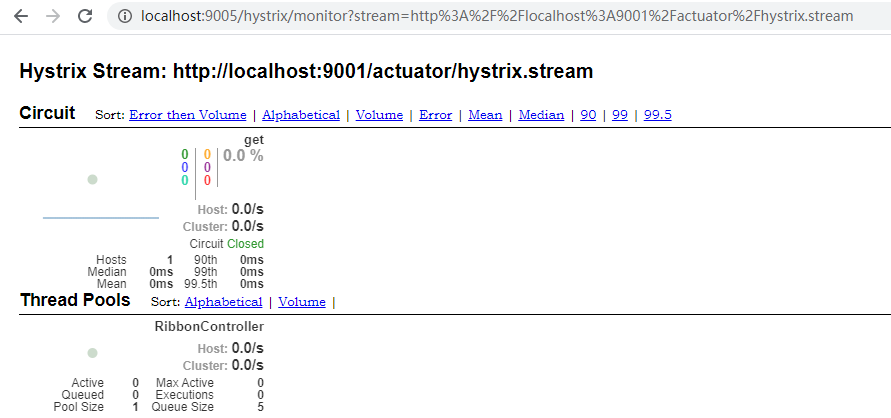
4.启动本微服务 访问路径为 http://localhost:9005/hystrix,看到以下界面,说明仪表盘配置成功

Delay: 该参数用来控制服务器上轮询监控信息的延迟时间,默认为 2000 毫秒, 可以通过配置该属性来降低客户端的网络和CPU消耗。
Title: 该参数对应了上图头部标题 Hystrix Stream 之后的内容, 默认会使用具体监控实例的URL, 可以通过配置该信息来展示更合适的标题。
这是Hystrix Dashboard的监控首页, 该页面中并没有具体的监控信息。 从页面的文字内容中我们可以知道,Hystrix Dashboard共支持三种不同的监控方式, 如下所示。
- 默认的集群监控: 通过URL http://turbine-hostname:port/turbine.stream开启, 实现对默认集群的监控。
- 指定的集群监控: 通过URL http://turbine-hostname:port/turbine.strearn?cluster = [clusterName]开启, 实现对clusterName集群的监控。
- 单体应用的监控: 通过URL http: //hystrix-app:port/hystrix.stream开启, 实现对具体某个服务实例的监控。
单体应用的监控:
前两者都是对集群的监控,需要整合Turbine才能实现。这里我们先来实现单个服务实例的监控。既然Hystrix Dashboard监控单实例节点需要通过访间实例的/hystrix.stream接口来实现, 我们自然需要为服务实例添加这个端点, 而添加该功能的步骤也同样简单, 只需要下面两步。
- 在服务实例 pom.xml 中的 dependencies 节点中新增 spring-boot-starter-actuator 监控模块以开启监控相关的端点, 并确保已经引入断路器的依赖 spring-cloud-starter-hystrix.
- 确保在服务实例的主类中已经使用 @EnableCircuitBreaker 注解, 开启了断路器功能。
- 另外,由于版本的原因,我这里还需要在RIBBON-SERVER中添加一个Bean:可以先开启 management.endpoints.web.exposure.include=refresh,hystrix.stream,如果无效再添加以下配置
@Bean
public ServletRegistrationBean getServlet(){
        HystrixMetricsStreamServlet streamServlet = new HystrixMetricsStreamServlet();
        ServletRegistrationBean registrationBean = new ServletRegistrationBean(streamServlet);
        registrationBean.setLoadOnStartup(1);
        registrationBean.addUrlMappings("/actuator/hystrix.stream");
        registrationBean.setName("HystrixMetricsStreamServlet");
        return registrationBean;
}
在为 RIBBON-SERVER加入上面的配置之后,重启它的实例, /actuator/hystrix.stream 就是用于 Hystrix Dashboard 来展现监控信息的接口。
到这里已经完成了所有的配置,在 Hystrix Dashboard 的首页输入 http://localhost:9001/actuator/hystrix.stream, 可以看到已启动对 RIBBON-SERVER的监控,单击 MonitorStream 按钮, 可以看到如下页面。
实心圆:共有两种含义,他通过颜色的变化代表了实例的健康程度,它的健康程度从绿<黄<橙<红递减,该实心圆除了颜色的变化之外,它的大小也会根据实例的请求流量发生变化。流量越大该实心圆就越大。所以通过该实心圆,就可以在大量的实例中快速发现故障实例和高压力实例
对于可视化监控界面(上图) 7 色 1 圈 1 线的含义如下图:
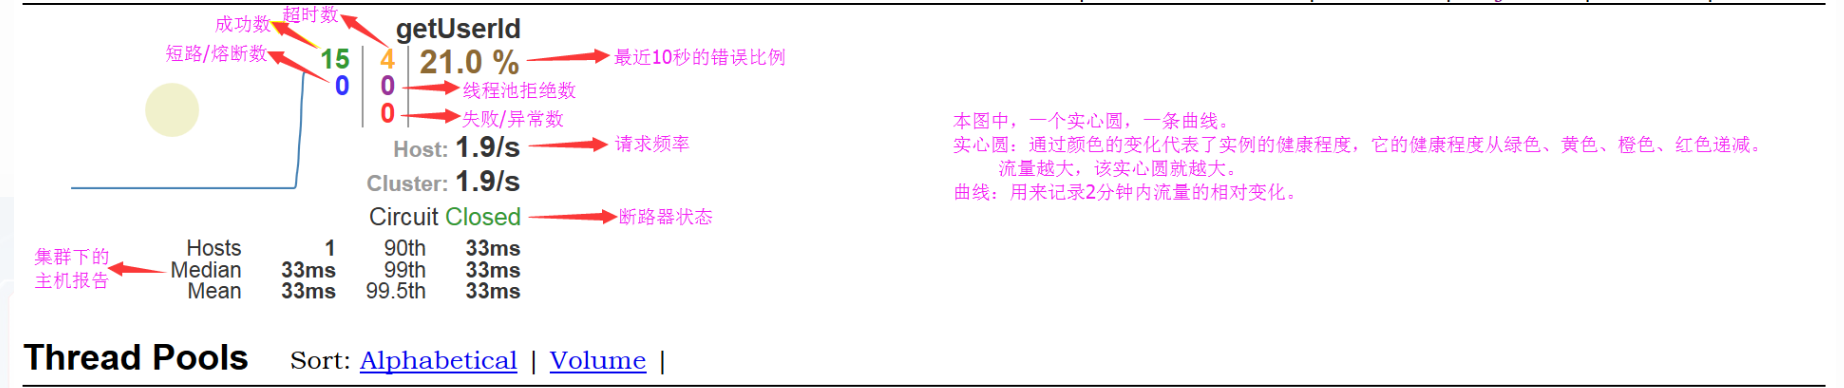
至此就配置好了仪表盘供用户查看服务实例的健康状况.
Turbine集群监控:
上面我们提到提到过除了可以开启单个实例的监控页面之外, 还有 一 个监控端点 /turbine.stream 是对集群使用的。 从端点的命名中, 可猜测到这里我们将引入 Turbine, 通过它来汇集监控信息,并将聚合后的信息提供给 HystrixDashboard 来集中展示和监控。
构建监控聚合服务
通过引入 Turbine 来聚合RIBBON-SERVER服务的监控信息,并输出给 Hystrix Dashboard 来进行展示。
1.创建 一 个标准的Spring Boot工程, 命名为turbine。
2.编辑porn. xml, 具体依赖内容如下所示。
<properties>
        <project.build.sourceEncoding>UTF-8</project.build.sourceEncoding>
        <project.reporting.outputEncoding>UTF-8</project.reporting.outputEncoding>
        <java.version>1.8</java.version>
    </properties>

    <dependencies>
        <dependency>
            <groupId>org.springframework.cloud</groupId>
            <artifactId>spring-cloud-starter-turbine</artifactId>
            <version>1.4.6.RELEASE</version>
        </dependency>
        <dependency>
            <groupId>org.springframework.boot</groupId>
            <artifactId>spring-boot-starter-actuator</artifactId>
        </dependency>
    </dependencies>
3.创建应用主类TurbineApplication, 并使用@EnableTurbine 注解开启 Turbine。
@EnableTurbine
@EnableDiscoveryClient
@SpringBootApplication
public class TurbineApp {

    public static void main(String[] args) {
        SpringApplication.run(TurbineApp.class, args);

    }
}
4.在application.yml中加入Eureka和Turbine的相关配置, 具体如下:
server:
  port: 9006
spring:
  application:
    name: turbine #服务注册到Eureka上使用的名称
turbine:
  aggregator:
    cluster-config: default
  app-config: RIBBON-SERVER,ribbon-server-two #指定了需要收集监 控信息的服务名
  cluster-name-expression: new String("default") #参数指定了集群名称为default
  combine-host-port: true
# true 同一主机上的服务通过host和port的组合来进行区分,默认为true
# false 时 在本机测试时 监控中host集群数会为1了 因为本地host是一样的
eureka:
  client:
    service-url:  # 集群情况下如下,如果是单机版,只需要配置单机版Eureka地址
      defaultZone: http://localhost:7001/eureka/,http://localhost:7002/eureka/
  instance:
    instance-id: hystrix-dasboard-turbine
    prefer-ip-address: true #访问路径显示IP地址
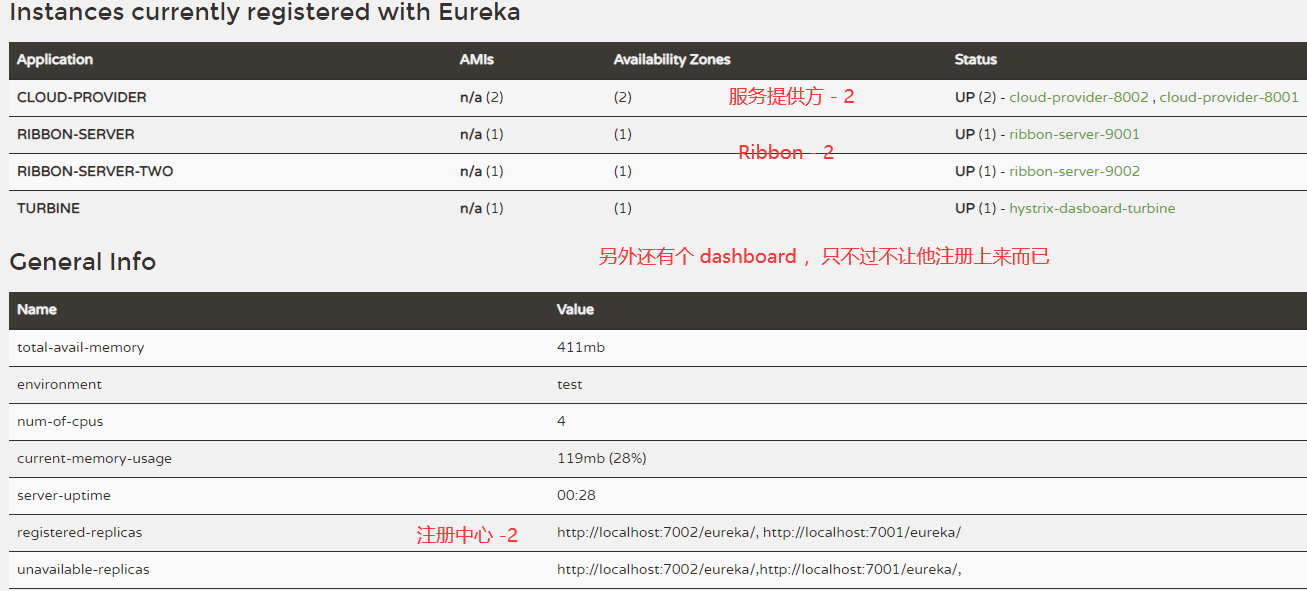
在完成了上面的内容构建之后,我们来体验 一 下Turbine对集群的监控能力。分别启动eureka-server、 cloud-provider、 RIBBON-SERVER、 Turbine 以及 HystrixDashboard。
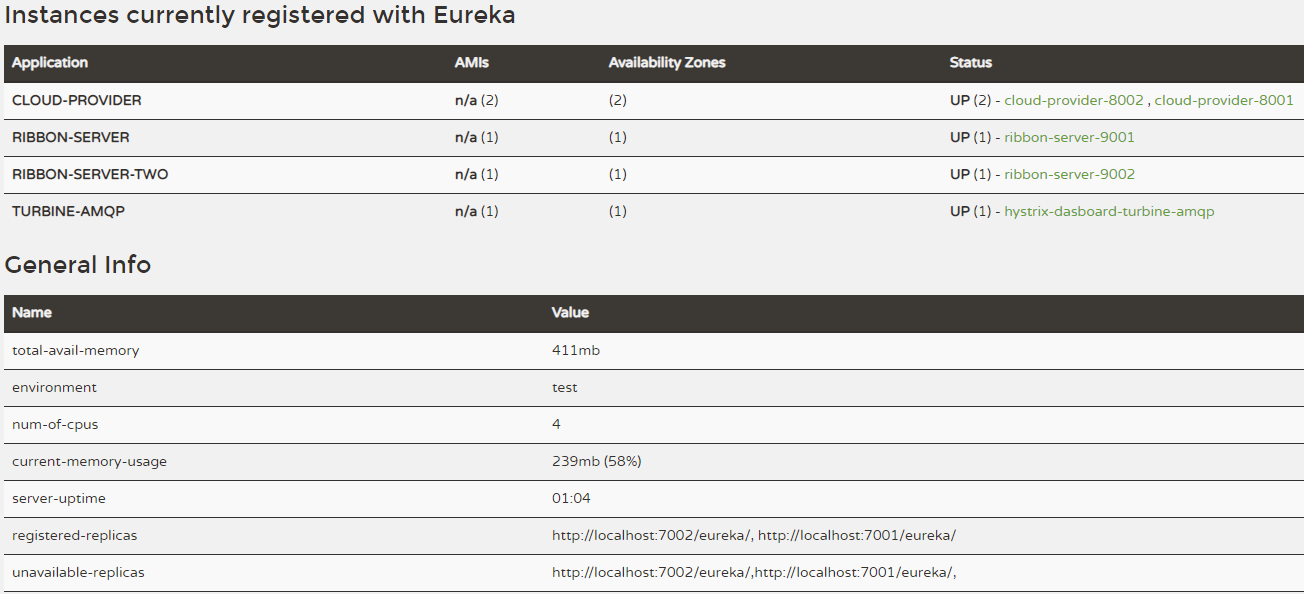
整个架构在注册中心上的注册信息来看是这样的:
访问Hystrix Dashboard, 并开启对 http://localhost:9006/turbine.stream的监控, 我们可以看到如下页面:
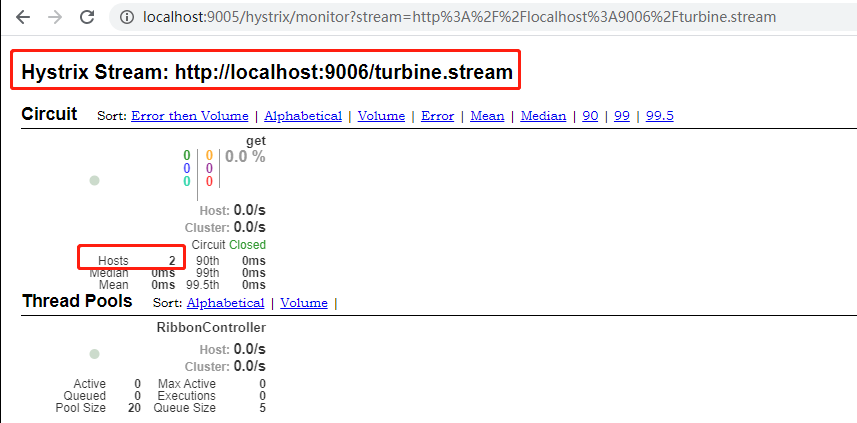
我们启动了两个Ribbon-consumer,但是在监控页面依然只是展示了一个监控图。但是可以发现集群报告区域中的Hosts属性已经变成了2个实例。由此我们知道ribbon-consumer启动了两个实例,只是展示在一个监控图中,是由于两个实例是同一个服务,而对于服务集群来说,我们关注的是服务集群的高可用,所以Turbine会将相同的服务作为整体看待,并汇总成一个监控图。
与消息代理结合:
Spring Cloud在封装Turbine的时候, 还封装了基于消息代理的收集实现。这里多了一 个重要元素RabbitMQ。 对于RabbitMQ 的安装我们可以参考 https://www.cnblogs.com/wuzhenzhao/p/10315642.html 。所以, 我们可以将所有需要收集的监控信息都输出到消息代理中,然后Turbine服务再从消息代理中异步获取这些监控信息, 最后将这些监控信息聚合并输出到Hystrix Dashboard中。
1.创建 一 个标准的Spring Boot工程, 命名为turbine-amqp。
2.编辑pom.xml, 具体依赖内容如下所示:这里我们需要使用 Java 8 来运行。
<properties>
        <project.build.sourceEncoding>UTF-8</project.build.sourceEncoding>
        <project.reporting.outputEncoding>UTF-8</project.reporting.outputEncoding>
        <java.version>1.8</java.version>
    </properties>

    <dependencies>
        <dependency>
            <groupId>org.springframework.cloud</groupId>
            <artifactId>spring-cloud-starter-turbine-amqp</artifactId>
            <version>1.4.6.RELEASE</version>
        </dependency>
        <dependency>
            <groupId>org.springframework.boot</groupId>
            <artifactId>spring-boot-starter-actuator</artifactId>
        </dependency>
    </dependencies>
3.在应用主类中使用@EnableTurbineStrearn注解来启用Turbine Stream的配置。
@EnableTurbineStream
@EnableDiscoveryClient
@SpringBootApplication
public class TurbineAMQPApp {

    public static void main(String[] args) {
        SpringApplication.run(TurbineAMQPApp.class, args);

    }
}
4.配置application.yml文件。
server:
  port: 9008
spring:
  rabbitmq:
    host: 192.168.1.101
    username: guest
    password: guest
    port: 5672
  application:
    name: turbine-amqp #服务注册到Eureka上使用的名称
turbine:
  aggregator:
    cluster-config: default
  app-config: RIBBON-SERVER,ribbon-server-two #指定了需要收集监 控信息的服务名
  cluster-name-expression: new String("default") #参数指定了集群名称为default
  combine-host-port: true
# true 同一主机上的服务通过host和port的组合来进行区分,默认为true
# false 时 在本机测试时 监控中host集群数会为1了 因为本地host是一样的
eureka:
  client:
    service-url:  # 集群情况下如下,如果是单机版,只需要配置单机版Eureka地址
      defaultZone: http://localhost:7001/eureka/,http://localhost:7002/eureka/
  instance:
    instance-id: hystrix-dasboard-turbine-amqp
    prefer-ip-address: true #访问路径显示IP地址
对于Turbine的配置已经完成了, 下面需要对服务消费者RIBBON-SERVER做 一 些修改, 使其监控信息能够输出到RabbitMQ上。 这个修改也非常简单, 只需在pom.xml中
增加对spring-cloud-netflix-hystrix-amqp的依赖, 具体如下:
<dependency>
    <groupId>org.springframework.cloud</groupId>
    <artifactId>spring-cloud-netflix-hystrix-amqp</artifactId>
    <version>1.4.6.RELEASE</version>
</dependency>
再配置相关Rabbitmq配置
spring:
  rabbitmq:
    host: 192.168.1.101
    username: guest
    password: guest
    port: 5672
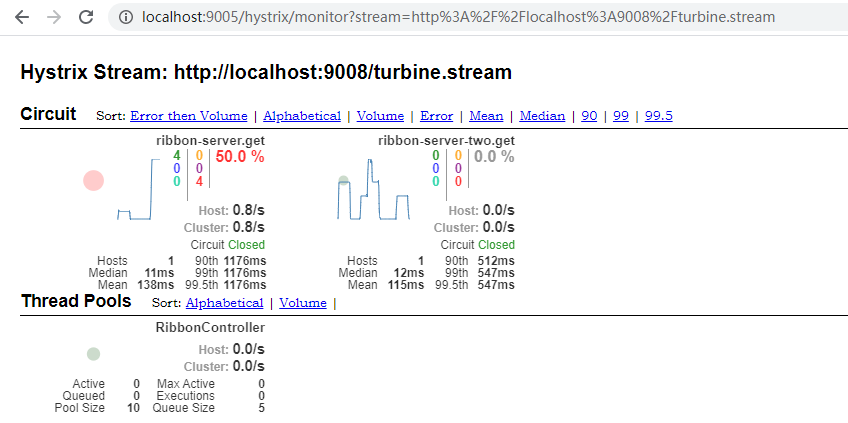
重启 RIBBON-SERVER、turbine-amqp。通过引入消息代理,我们的Turbine和Hystrix Dashboard实现的监控架构在注册中心上的注册信息来看是这样的:
此时可以查看RabbitMQ会有对应的连接的:
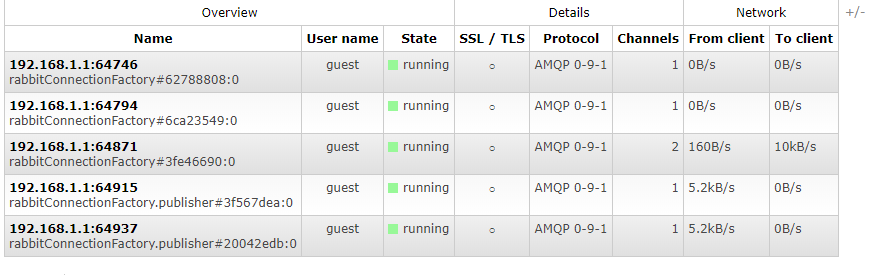
我们可以获得如之前实现的同样结果, 只是这里的监控信息收集是通过消息代理异步实现的。下图就是最终的监控效果的呈现,原来两个RIBBON-SERVER都在这里显示了。并不像 turbine 那样子合到了一起

 浙公网安备 33010602011771号