
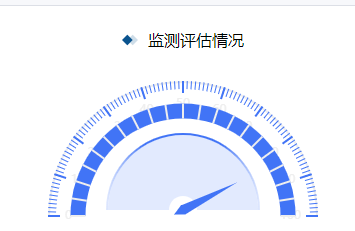
仪表盘echarts图
先上图:
  1  ChartOneInit() {
  2       const chartDom = document.getElementById('evaluation-result-chartOne');
  3       const myChart = echarts.init(chartDom);
  4       const gauge_value = 85;
  5       const myRate1 = 100;
  6       const dataArr = [
  7         {
  8           value: 120,
  9           name: "噪音检测",
 10         },
 11       ];
           //c:1 arr中的颜色左到右
 12       const color = new echarts.graphic.LinearGradient(0, 0, 1, 0, [
 13         {
 14           offset: 0,
 15           color: "#e2eafe", // 0% 处的颜色
 16         },
 17         {
 18           offset: 0.25,
 19           color: "#4174f6", // 0% 处的颜色
 20         },
 21         {
 22           offset: 0.5,
 23           color: "#4174f6", // 0% 处的颜色
 24         },
 25         {
 26           offset: 0.75,
 27           color: "#4174f6", // 0% 处的颜色
 28         },
 29         {
 30           offset: 1,
 31           color: "#e2eafe", // 100% 处的颜色
 32         },
 33       ]);
 34       const colorSet = [
 35         [1, color],
 36         // [0.91, color],
 37         // [1, '#FFF']
 38       ];
 39       const rich = {
 40         white: {
 41           fontSize: 50,
 42           color: "#fff",
 43           fontWeight: "500",
 44           padding: [-150, 0, 0, 0],
 45         },
 46         bule: {
 47           fontSize: 70,
 48           fontFamily: "DINBold",
 49           color: "#fff",
 50           fontWeight: "700",
 51           padding: [-120, 0, 0, 0],
 52         },
 53         radius: {
 54           width: 350,
 55           height: 80,
 56           // lineHeight:80,
 57           borderWidth: 1,
 58           borderColor: "#0092F2",
 59           fontSize: 50,
 60           color: "#fff",
 61           backgroundColor: "#1B215B",
 62           borderRadius: 20,
 63           textAlign: "center",
 64         },
 65         size: {
 66           height: 400,
 67           padding: [100, 0, 0, 0],
 68         },
 69       };
 70       const option = {
 71         /*   title: {
 72     x: "center",
 73     bottom: 40,
 74     text: "BBB",
 75     textStyle: {
 76       fontWeight: "normal",
 77       fontSize: 55,
 78       color: "#323232",
 79     },
 80   }, */
 81         tooltip: {
 82           show: true,
 83         },
 84         series: [
 85           {
 86             type: "gauge",//仪表盘
 87             center: ["50%", "70%"], // 默认全局居中,调位置
 88             radius: '90%',//仪表盘半径
 89             splitNumber: 10, // 刻度数量
 90             min: 0,
 91             max: 100,
 92             startAngle: 180,
 93             endAngle: 0,
 94
 95             axisLine: {
 96               show: true,
 97               lineStyle: {
 98                 width: 2,
 99                 shadowBlur: 0,
100                 color: [[1, "#eee"]],
101               },
102             },
103             axisTick: {
104               show: true,
105               lineStyle: {
106                 color: "#4174f6",
107                 width: 1,
108               },
109               length: 8,
110               splitNumber: 10,
111             },
112             splitLine: {
113               show: true,
114               length: 12,
115               lineStyle: {
116                 color: "#4174f6",
117               },
118             },
119             pointer: {
120               // 仪表盘指针
121               show: 0,
122             },
123             detail: {
124               show: false,
125             },
126             data: [
127               {
128                 name: "",
129                 value: myRate1,
130               },
131             ],
132           },
133           // 内层带指针
134           {
135             name: "",
136             type: "gauge",
137             radius: 75,
138             center: ["50%", "68%"], // 默认全局居中
139             splitNumber: 10, // 刻度数量
140             startAngle: 180,
141             endAngle: 0,
142             min: 0, // 最小刻度
143             max: 100, // 最大刻度
144             // 仪表盘轴线相关配置
145             axisLine: {
146               lineStyle: {
147                 color: [
148                   [
149                     1, '#e2eafe'
150                   ],
151                 ],
152                 width: 61,
153               },
154             },
155             /** 分隔线样式*/
156             splitLine: {
157               show: false,
158             },
159             /** 刻度线*/
160             axisTick: {
161               show: false,
162             },
163             /** 刻度标签*/
164             axisLabel: {
165               show: false,
166             },
167             /** 仪表盘指针*/
168             pointer: {
169               show: true,
170               length: "80%",
171               color: '#4174f6',
172               width: 5, // 指针粗细
173             },
174             /** 仪表盘指针样式*/
175             itemStyle: {
176               color: "#4174f6",
177             },
178             data: [
179               {
180                 value: 85,
181               },
182             ],
183             detail: {
184               show: false,
185             },
186           },
187           // 渐变环
188           {
189             type: "gauge",
190             radius: 77,
191             center: ["50%", "68%"],
192             startAngle: 180,
193             endAngle: 0,
194             pointer: {
195               show: false,
196             },
197             detail: {
198               formatter: function(value) {
199                 // let num = Math.round(value);
200                 return "{bule|dB}{white|}" + "{size|" + "}";
201               },
202               rich: rich,
203               offsetCenter: ["0%", "55%"],
204             },
205             data: dataArr,
206             title: {
207               show: false,
208             },
209             axisLine: {
210               show: true,
211               lineStyle: {
212                 color: colorSet,
213                 width: 2,
214                 // shadowBlur: 15,
215                 // shadowColor: '#B0C4DE',
216                 shadowOffsetX: 0,
217                 shadowOffsetY: 0,
218                 opacity: 1,
219               },
220             },
221             axisTick: {
222               show: false,
223             },
224             splitLine: {
225               show: false,
226               length: 25,
227               lineStyle: {
228                 color: "#00377a",
229                 width: 2,
230                 type: "solid",
231               },
232             },
233             axisLabel: {
234               show: false,
235             },
236             animationDuration: 4000,
237           },
238           {
239             name: "信用分",
240             type: "gauge",
241             startAngle: 180,
242             endAngle: 0,
243             splitNumber: 20,
244             radius: '75%',
245             center: ["50%", "70%"], // 默认全局居中
246             min: 0,
247             max: 100,
248             // splitNumber: 10,
                //白色分隔关键难点

249             axisLine: {
250               show: true,
251               lineStyle: {
252                 width: 15,
253                 shadowBlur: 0,
254                 color: [
255                   [0.05, "#4174f6"],
256                   [0.1, "#4174f6"],
257                   [0.15, "#4174f6"],
258                   [0.2, "#4174f6"],
259                   [0.25, "#4174f6"],
260                   [0.3, "#4174f6"],
261                   [0.35, "#4174f6"],
262                   [0.4, "#4174f6"],
263                   [0.45, "#4174f6"],
264                   [0.5, "#4174f6"],
265                   [0.55, "#4174f6"],
266                   [0.6, "#4174f6"],
267                   [0.65, "#4174f6"],
268                   [0.7, "#4174f6"],
269                   [0.75, "#4174f6"],
270                   [0.8, "#4174f6"],
271                   [0.85, "#4174f6"],
272                   [0.9, "#4174f6"],
273                   [0.95, "#4174f6"],
274                   [1, "#4174f6"],
275                 ],
276               },
277             },
278             axisTick: {
279               show: false,
280             },
281             splitLine: {
282               show: true,
283               length: 15,
284               color: '#ffffff'
285             },
286
287             axisLabel: {
288               show: false,
289             },
290             pointer: {
291               show: false,
292               /*      length: 80,
293         width:10, */
294               color: '#4174f6'
295             },
296             detail: {
297               show: false,
298               offsetCenter: [0, 0],
299               textStyle: {
300                 fontSize: 30,
301               },
302             },
303             itemStyle: {
304               normal: {
305                 color: "#4174f6",
306               },
307             },
308             data: [
309               {
310                 name: "",
311                 value: Math.floor(gauge_value),
312               },
313             ],
314           },
315         ],
316       };
317       option && myChart.setOption(option)
318     },

 浙公网安备 33010602011771号