
elasticsearch+kibana+fluentd 日志搜集集群搭建
使用fluentd来搜集Nginx日志,准备3台服务器,列表如下
| node1 | elasticsearch/kibana/td-agent |
| node2 | td-agent/nginx |
| node3 | td-agent/nginx |
1.下载相关软件
http://packages.treasuredata.com.s3.amazonaws.com/3/redhat/7/x86_64/td-agent-3.4.1-0.el7.x86_64.rpm
https://artifacts.elastic.co/downloads/elasticsearch/elasticsearch-7.2.0-x86_64.rpm
https://artifacts.elastic.co/downloads/kibana/kibana-7.2.0-x86_64.rpm
2.在node1安装elasticsearch和kibana并启动
yum install -y elasticsearch-7.2.0-x86_64.rpm kibana-7.2.0-x86_64.rpm
3.在每台机器上安装td-agent
yum install -y td-agent-3.4.1-0.el7.x86_64.rpm
4.在node1安装elasticsearch插件
td-agent-gem install fluent-plugin-elasticsearch
5.在node1修改td-agent配置并启动
vim /etc/td-agent/td-agent.conf
#td-agent.conf
<system>
  workers 10
</system>

@include /etc/td-agent/conf.d/*.conf
vim /etc/td-agent/conf.d/source.conf
<source>
  @type forward
  port 24224
  bind 0.0.0.0
</source>
vim /etc/td-agent/conf.d/match.conf
#match.conf
<match nginx.access>
  @type elasticsearch
  host localhost
  port 9200
  #user elastic #如果有安全认证则需要设置
  #password password
  logstash_format true
  logstash_prefix fluentd.${tag}      # index名称
</match>
6.在其他两个节点修改td-agent配置并启动
vim /etc/td-agent/td-agent.conf
#td-agent.conf
<system>
  workers 1
</system>

@include /etc/td-agent/conf.d/*.conf
vim /etc/td-agent/conf.d/source.conf
#source.conf
<source>
  @type tail
  path /var/log/openresty/*access.log
  path_key file_path
  tag nginx.access
  pos_file /var/log/td-agent/nginx-access.log.pos
  # parse
  <parse>
    @type regexp
    #根据自己的Nginx日志规则调整
    expression /^(?<remote_addr>[^ ]*) (?<white>[^ ]*) (?<remote_user>[^ ]*) \[(?<time_local>[^\]]*)\] "(?<method>\S+)(?: +(?<url_path>[^\"][A-Za-z0-9$.+!*'(){},~:;=@#%&_\-\/]*)(?:\?(?<url_param>[^\"]*))? +\S*)?" (?<response_code>[^ ]*) (?<body_bytes_sent>[^ ]*)(?: "(?<http_referer>[^\"]*)" "(?<http_user_agent>[^\"]*)" "(?<http_x_forwarded_for>[^\"]*)" "(?<request_body>[^\"]*)" "(?<upstream_addr>[^\"]*)" "(?<uri>[^\"]*)" "(?<upstream_response_time>[^\"]*)" "(?<upstream_http_name>[^\"]*)" "(?<upstream_http_host>[^\"]*)" "(?<upstream_cache_status>[^\"]*)" "(?<request_time>[^\"]*)")?/
    types body_bytes_sent:integer,request_time:float,upstream_response_time:float
    time_format %d/%b/%Y:%H:%M:%S %z
  </parse>
</source>
vim /etc/td-agent/conf.d/filter.conf
#filter.conf
<filter nginx.access>
  @type record_transformer
  <record>
    hostname "#{Socket.gethostname}"
    tag ${tag}
  </record>
</filter>
vim /etc/td-agent/conf.d/match.conf
#match.conf
<match nginx.access>
  @type forward
  send_timeout 60s
  recover_wait 10s
  hard_timeout 60s
  <server>
    name td-0
    host node1
    port 24224
    weight 60
  </server>
  #配置主备
  #<server>
  #  name td-1
  #  host node2
  #  port 24224
  #  weight 60
  #</server>
</match>
7.安装X-PACK实现安全认证
X-Pack是一个Elastic Stack的扩展,将安全,警报,监视,报告和图形功能包含在一个易于安装的软件包中
在6.3版本及之后,已经默认集成,无需额外安装,基础安全属于付费黄金版内容。从7 .1版本开始,基础安全免费。
修改/etc/elasticsearch/elasticsearch.yml开启安全认证
xpack.security.enabled: true
xpack.security.transport.ssl.enabled: true
设置密码
/usr/share/elasticsearch/bin/elasticsearch-setup-passwords interactive
修改/etc/kibana/kibana.yml
elasticsearch.username: "elastic"
elasticsearch.password: "yourpassword"
重启es、kibana服务后,需要认证
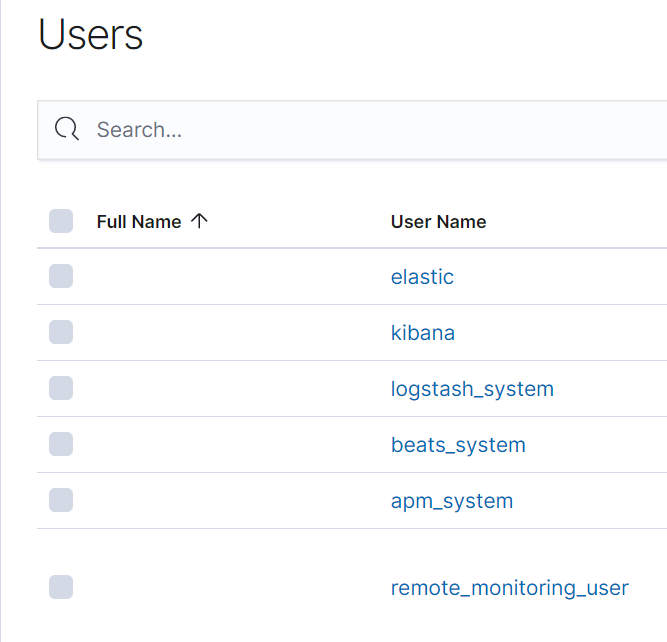
登录后在management->users可以查看所有的用户
8.其他插件介绍
logstash和filebeat:
都具有日志收集功能,filebeat更轻量,占用资源更少,但logstash 具有filter功能,能过滤分析日志。一般结构都是filebeat采集日志,然后发送到消息队列,redis,kafaka。然后logstash去获取,利用filter功能过滤分析,然后存储到elasticsearch中。
Curator:
是elasticsearch 官方的一个索引管理工具,可以删除、创建、关闭、段合并等等功能。
Cerebro:
是一款es比较好用的开源监控软件,主要是scala写的,修改源码方便。可以通过修改源码屏蔽掉一些像DELETE等危险操作。从而给更多人包括运维人员使用。
Bigdesk:
是elasticsearch的一个集群监控工具,可以通过它来查看es集群的各种状态,如:cpu、内存使用情况,索引数据、搜索情况,http连接数等。
Metricbeat:
是一个轻量级代理,在服务器上安装,以定期从操作系统和服务器上运行的服务收集指标。Metricbeat提供多种内部模块,用于从服务中收集指标,例如 Apache、NGINX、MongoDB、MySQL、PostgreSQL、Prometheus、Redis 等等。
Packetbeat:
抓取网路包数据
自动解析网络包协议,如: ICMP DNS、HTTP、Mysql/PgSQL/MongoDB、Memcache、Thrift、TLS等。
Heartbeat:
是一个轻量级守护程序,可以安装在远程服务器上,定期检查服务状态并确定它们是否可用。与Metricbeat不同,Metricbeat仅确定服务器是启动还是关闭,Heartbeat会确认服务是否可访问。
Marvel:
工具可以帮助使用者监控elasticsearch的运行状态,不过这个插件需要收费,只有开发版是免费,我们学习不影响我们使用。它集成了head以及bigdesk的功能,是官方推荐产品。
Auditbeat:
是一个轻量级代理,可以在审核服务器系统上用户和进程的活动。 例如,可以使用Auditbeat从Linux Audit Framework收集和集中审核事件,还可以使用Auditbeat检测关键文件(如二进制文件和配置文件)的更改,并识别潜在的安全策略违规。
参考:

 浙公网安备 33010602011771号