
柱状图
This is an example of creating a stacked bar plot with error bars using ~matplotlib.pyplot.bar. Note the parameters yerr used for error bars, and bottom to stack the women's bars on top of the men's bars.
import numpy as np
import matplotlib.pyplot as plt

N = 5
menMeans = (20, 35, 30, 35, 27)
womenMeans = (25, 32, 34, 20, 25)
menStd = (2, 3, 4, 1, 2)
womenStd = (3, 5, 2, 3, 3)
ind = np.arange(N)    # the x locations for the groups
width = 0.35       # the width of the bars: can also be len(x) sequence

p1 = plt.bar(ind, menMeans, width, yerr=menStd)
p2 = plt.bar(ind, womenMeans, width,
             bottom=menMeans, yerr=womenStd)

plt.ylabel('Scores')
plt.title('Scores by group and gender')
plt.xticks(ind, ('G1', 'G2', 'G3', 'G4', 'G5'))
plt.yticks(np.arange(0, 81, 10))
plt.legend((p1[0], p2[0]), ('Men', 'Women'))

plt.show()

plt.bar()
- plt.bar(x, height, width=0.8, bottom=None, ... )
| parameter | meaning |
|---|---|
| x(标量或向量) | 每个bar的横向位置 |
| height(标量或向量) | 每个bar的高度 |
| width (标量或向量) | 每个bar的宽度 |
| bottom (标量或向量) | 每个bar的y坐标偏移 |
| yerr(标量或向量) | y方向误差 |
plt.xticks() & plt.yticks()
- plt.xticks(ticks=None, labels=None, ...)
- plt.yticks(ticks=None, labels=None, ...)
| parameter | meaning |
|---|---|
| ticks(向量,必需) | ticks的位置 |
| labels(向量) | 标签 |
legend()
- legend()
- legend(labels)
- legend(handles, labels)
第一种方式加legend:
Automatic detection of elements to be shown in the legend**
The elements to be added to the legend are automatically determined,
when you do not pass in any extra arguments.In this case, the labels are taken from the artist. You can specify
them either at artist creation or by calling the
:meth:~.Artist.set_labelmethod on the artist::line, = ax.plot([1, 2, 3], label='Inline label') ax.legend()or::
   line, = ax.plot([1, 2, 3])
   line.set_label('Label via method')
   ax.legend()
Specific lines can be excluded from the automatic legend element
selection by defining a label starting with an underscore.
This is default for all artists, so callingAxes.legendwithout
any arguments and without setting the labels manually will result in
no legend being drawn.
fig, (ax1, ax2) = plt.subplots(2, 1)
line1, = ax1.plot([1,2,3], label='Inline label')
ax1.legend()

line2, = ax2.plot([1,2,3])
line2.set_label('Label via method')
ax2.legend()
plt.show()

第二种方式加legend:
To make a legend for lines which already exist on the axes
(via plot for instance), simply call this function with an iterable
of strings, one for each legend item. For example::ax.plot([1, 2, 3]) ax.legend(['A simple line'])Note: This way of using is discouraged, because the relation between
plot elements and labels is only implicit by their order and can
easily be mixed up.
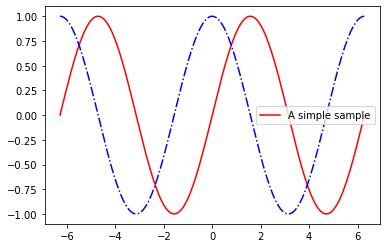
x = np.linspace(-2*np.pi, 2*np.pi, 200)
y1 = np.sin(x)
y2 = np.cos(x)
fig, ax = plt.subplots()
line1, = ax.plot(x, y1, 'r-')
line2, = ax.plot(x, y2, 'b-.')
ax.legend(['A simple sample'])
plt.show()
第三种方式加legend:
For full control of which artists have a legend entry, it is possible
to pass an iterable of legend artists followed by an iterable of
legend labels respectively::legend((line1, line2, line3), ('label1', 'label2', 'label3'))
x = np.linspace(-2*np.pi, 2*np.pi, 200)
y1 = np.sin(x)
y2 = np.cos(x)
fig, ax = plt.subplots()
line1, = ax.plot(x, y1, 'r-')
line2, = ax.plot(x, y2, 'b-.')
ax.legend((line1, line2),('sin', 'cos'))
plt.show()


 浙公网安备 33010602011771号