根据中心点位/斜边长度/角度 生成随机裂缝坐标轴
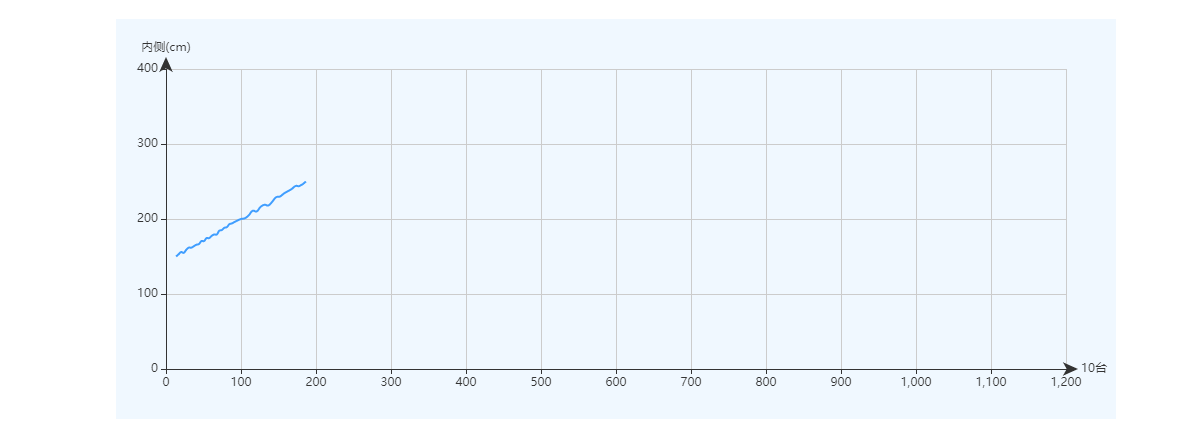
已知裂缝中心点位 /裂缝长度/角度 生成裂缝位置形状坐标图
效果图

页面代码
<el-row v-show="showChart">
   <el-col :push="2" :span="20">
      <div id="axis"></div>
   </el-col>
</el-row>
 <el-button v-show="!showChart" @click="createAxis()">显示坐标轴</el-button>
 <el-button v-show="showChart && coordinateList.length>0" @click="createAxis()">重新生成坐标轴</el-button>
 <el-button v-show="showChart" @click="hideAxis()">隐藏坐标轴</el-button>
css代码
#axis {
    width: 1000px;
    height: 400px;
    background-color: aliceblue;
}
js代码
  1 // 隐藏坐标轴
  2     hideAxis () {
  3       this.showChart = false
  4     },
  5     // 生成坐标轴
  6     createAxis (type) {
  7       // 构件面
  8       if (!this.dataForm.componentFace) {
  9         this.$message.error('请先选择构件面!')
 10         return
 11       }
 12       // 纵向位置
 13       if (!this.dataForm.longitudinalDirection || !this.dataForm.longitudinalDirectionDistance) {
 14         this.$message.error('请先填写纵向位置!')
 15         return
 16       }
 17       // 横向位置
 18       if (!this.dataForm.transverseDirection || !this.dataForm.transverseDirectionDistance) {
 19         this.$message.error('请先填写横向位置!')
 20         return
 21       }
 22       // 长度
 23       if (!this.dataForm.diseaseLength) {
 24         this.$message.error('请先填写长度!')
 25         return
 26       }
 27       // 角度
 28       if (!this.dataForm.diseaseAngle) {
 29         this.$message.error('请先填写角度!')
 30         return
 31       }
 32       // 构件面长度宽度信息为空
 33       if (!this.componentFaceWidth || !this.componentFaceLength) {
 34         this.$message.error('请先完善构件面长度/宽度信息!')
 35         return
 36       }
 37       // 计算邻边距离
 38       let adjacentLength = this.calculateLength(this.dataForm.diseaseLength / 2, this.dataForm.diseaseAngle)[0]
 39       // 计算对边距离
 40       let oppositeLength = this.calculateLength(this.dataForm.diseaseLength / 2, this.dataForm.diseaseAngle)[1]
 41       // 起始点
 42       let start = [this.dataForm.longitudinalDirectionDistance * 100 - adjacentLength, this.dataForm.transverseDirectionDistance * 100 - oppositeLength]
 43       // 中心点
 44       let centre = [this.dataForm.longitudinalDirectionDistance * 100, this.dataForm.transverseDirectionDistance * 100]
 45       // 截止点
 46       let end = [this.dataForm.longitudinalDirectionDistance * 100 + adjacentLength, this.dataForm.transverseDirectionDistance * 100 + oppositeLength]
 47       // div 宽高比
 48       const divW = 900
 49       let divH = 300
 50       // 构件面高度宽度-由接口获取 单位统一
 51       let componentFaceH = this.componentFaceWidth * 100
 52       let componentFaceW = this.componentFaceLength * 100
 53       // 计算div高度 因为表格文字占据100 需要加100
 54       divH = componentFaceH / componentFaceW * divW + 100
 55       let axis = document.getElementById('axis')
 56       axis.style.height = divH + 'px'
 57       let maxX = componentFaceW
 58       let maxY = componentFaceH
 59       let interval = 100
 60       let chartInfo = {
 61         yName: this.dataForm.transverseDirection + '(cm)',
 62         // yData: [start, centre, end],
 63         xName: this.dataForm.longitudinalDirection + this.dataForm.longitudinalType,
 64         maxX: maxX,
 65         maxY: maxY,
 66         interval: interval
 67       }
 68       // 使用接口保存点位
 69       if (type == 1) {
 70         chartInfo.yData = this.coordinateList
 71       } else { // 重新生成点位
 72         let fillRandom = this.createRandom(10, this.dataForm.diseaseLength / 2, start)
 73         let fillRandom2 = this.createRandom(10, this.dataForm.diseaseLength / 2, centre)
 74         chartInfo.yData = [start, ...fillRandom, centre, ...fillRandom2, end]
 75         // 记录点位保存至数据库
 76         this.coordinateList = chartInfo.yData
 77       }
 78       this.showChart = true
 79       this.doEchart(chartInfo)
 80     },
 81     // 计算距离
 82     calculateLength (diseaseLength, diseaseAngle) {
 83       // 邻边
 84       let adjacentLength = diseaseLength * Math.cos(2 * Math.PI / 360 * diseaseAngle)
 85       // 对边
 86       let oppositeLength = diseaseLength * Math.sin(2 * Math.PI / 360 * diseaseAngle)
 87       return [parseFloat(adjacentLength.toFixed(2)), parseFloat(oppositeLength.toFixed(2))]
 88     },
 89     // 随机数生成点位
 90     createRandom (start, end, point) {
 91       // 生成随机数 这个数值中间可以新增几个点
 92       let random = Math.round(Math.random() * ((end - start) / 5) + start)
 93       // 每段多长
 94       let diseaseLength = (end - start) / random
 95       // 遍历处理得到相应数量的正确点位 / 随机偏移量 处理进行偏移点位
 96       let pointArr = []
 97       for (let i = 0; i < random; i++) {
 98         // 邻边
 99         let adjacentLength = this.calculateLength(diseaseLength, this.dataForm.diseaseAngle)[0]
100         // 对边
101         let oppositeLength = this.calculateLength(diseaseLength, this.dataForm.diseaseAngle)[1]
102         // 得到正确点位
103         point = [point[0] + adjacentLength, point[1] + oppositeLength]
104         // pointArr.push(point)
105         // 生成随机偏移
106         let skewingLength = Math.round(Math.random() * oppositeLength)
107         let skewingPoint = []
108         if (Math.round(Math.random()) === 0) {
109           skewingPoint = [point[0], point[1] - skewingLength]
110         } else {
111           skewingPoint = [point[0], point[1] + skewingLength]
112         }
113         pointArr.push(skewingPoint)
114       }
115       return pointArr
116     },
117     // 建立图形
118     doEchart (chartInfo) {
119       let myChart = echarts.init(document.getElementById('axis'));
120       let option = {
121         tooltip: {
122           formatter: function (params) {
123             let data = params.data || [0, 0];
124             return data[0].toFixed(2) + ', ' + data[1].toFixed(2);
125           }
126         },
127         grid: {
128           left: 50,
129           right: 50,
130           bottom: 50,
131           top: 50,
132           containLabel: false,
133         },
134         xAxis: {
135           type: 'value',
136           interval: chartInfo.interval,
137           min: 0,
138           max: chartInfo.maxX,
139           name: chartInfo.xName, //'3台',
140           // nameLocation: 'start',
141           // nameGap: 30,
142           axisLine: {
143             show: true,
144             symbol: ['none', 'arrow'],
145             symbolOffset: [0, 12]
146           }
147         },
148         yAxis: {
149           type: 'value',
150           name: chartInfo.yName, //'左侧(cm)',
151           interval: chartInfo.interval,
152           min: 0,
153           max: chartInfo.maxY,
154           axisLine: {
155             show: true,
156             symbol: ['none', 'arrow'],
157             symbolOffset: [0, 12]
158           }
159         },
160         series: [
161           {
162             data: chartInfo.yData,
163             type: 'line',
164             smooth: true,   // 是否平滑曲线
165             symbol: 'none', // 不显示点位
166             color: '#409EFF', //柱条颜色
167             label: {
168               // show: true
169             }
170           }
171         ]
172       };
173       myChart.setOption(option);
174     }

 浙公网安备 33010602011771号