
JS 图表工具可以结合extjs实现
OpenFlashChart简介
2009-1-10 8:29:00OpenFlashChart是一款开源的以Flash和Javascript为技术基础的免费图表,用它能创建一些很有效果的报表分析图表。
最重要的是它是开源和免费的,由于平时我使用的是.NET的开发技术,所以就以.NET技术为研究对象,当然它可以支持多种语言。

如何工作?
- 使用浏览器浏览网页
- 浏览器下载带有OpenFlashChart的网页
- 显示图表.
- 只要告诉data文件给OpenFlashChart即可。其余的事由OpenFlashChart引擎来做吧。
饼图:

3D 柱状图等等。

Live Demo
200708/21
200807/23
200906/24
201005/26
201106/24
201009/16
201004/01
201006/24
201009/16
201012/09
201003/03
2011
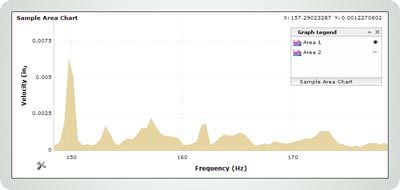
Features
- Interactive: Features such as Hints, Mouse Tracking, Mouse Events, Key Tracking and Events, Zooming, Scrolling, and Crosshairs raise interactivity and user experience in web charting to a new level.
 Axis Scaling: There's no need to determine your
data range before hand. EJSChart will calculate and scale automatically to fit
whatever data it is presented with.
Axis Scaling: There's no need to determine your
data range before hand. EJSChart will calculate and scale automatically to fit
whatever data it is presented with.
- Auto Zooming, Scrolling: Too much data and not enough screen real estate? Show it all. Let your end users zoom in on the pieces they're most interested in. Axis locking for single axis zoom, scrolling and automatic axis scaling are all included.
 Stackable Series: Multiple chart series can be
stacked and combined to fit many charting needs.
Stackable Series: Multiple chart series can be
stacked and combined to fit many charting needs.
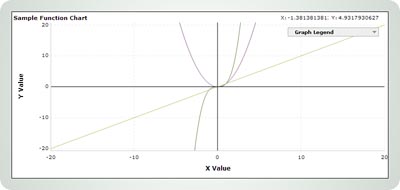
- Multiple Chart Types: Line, Area, Scatter, Pie, Bar and Function series are just the beginning. New series are just a few lines of JavaScript code away.
- Ajax-Driven Data: EJSChart supports XML-formatted data and loads data on the fly. New series can be added and data updated in real time without page reloads.
- Compatible: Built with compatibility in mind and
tested on all major browsers, you can be assured your charts will function
consistently for the broadest range of end users.
See the full list of compatible browsers. - Plugin Free: 100% Pure JavaScript Charting Solution. No more worries of incompatible plugin versions or confusing security warnings. EJSChart is pure JavaScript and requires no client installation.
- Customizable: Every aspect of the charting display can be configured and customized through well-documented properties and methods. Want to do more than just change the color of the background? Need a series type which doesn't already exist? EJSChart is fully customizable and extendable to provide the greatest flexibility and integration for existing site designs and needs.
Screen Shots


FusionCharts Free(3)
来看一个使用dataURL方式指定图表数据源的例子:
 <div id="chartdiv" align="center"></div>
 <script type="text/javascript">

 var chart = new FusionCharts("../Charts/FCF_Column2D.swf", "ChartId", "600", "350"); chart.setDataURL("Data/Column2D.xml");
 chart.render("chartdiv");</script>
主要的代码是一段js脚本,首先声明并实例化一个对象FusionChaets,然后使用该对象的setDataURL方法为图表指定一个包含图表数据的xml文件作为数据源,最后使用该对象的render方法在id属性为chartdiv的div元素中生成图表。
上述对象的构造函数以及两个方法都是在FusionCharts.js文件中进行实现的,所以在包含上述代码的页面中应该首先包含对FusionCharts.js文件的引用。
当然,这里的Column2D.xml并不是一个随随便便的xml文件,它需要使用特定的标签、属性等,否则,相应的swf文件将不能正常解析并显示图表数据。
来看一下Column2D.xml的内容:
<graph caption='Monthly Unit Sales' xAxisName='Month' yAxisName='Units' decimalPrecision='0' formatNumberScale='0'> <set name='Jan' value='462' color='AFD8F8' /> <set name='Feb' value='857' color='F6BD0F' /> <set name='Mar' value='671' color='8BBA00' /> <set name='Apr' value='494' color='FF8E46'/> <set name='May' value='761' color='008E8E'/> <set name='Jun' value='960' color='D64646'/> <set name='Jul' value='629' color='8E468E'/> <set name='Aug' value='622' color='588526'/> <set name='Sep' value='376' color='B3AA00'/> <set name='Oct' value='494' color='008ED6'/> <set name='Nov' value='761' color='9D080D'/> <set name='Dec' value='960' color='A186BE'/></graph>
相对来说,这样的xml文件中的内容还是比较容易进行理解的,而且,FusionCharts的文档中提供了关于各种不同图表类型可以接受的xml文件标签、属性等的参考,参见文档中的“Chart XML Reference”部分。
通过比较不同类型的图表的xml数据格式,可能会发现,除了漏斗图、K线图、甘特图等特殊图表之外,同一类别中常见图表(如单序列图表中的2D柱状图、3D柱状图、2D折线图、2D饼图、3D饼图、2D条形图、2D面积图、2D圆环图)的xml文件格式是类似的,这样在特定应用中,当需要更改图表类型时,我们只需要将js中的FusionCharts对象重新实例化即可,而不需要更改具体的xml数据源。如上述2D柱状图更改为2D条形图时,我们可以使用以下函数:
<script type="text/javascript"> function changeChartTypeToBar() { chart = new FusionCharts("../Charts/FCF_Bar2D.swf", "ChartId", "600", "350"); chart.setDataURL("Data/Column2D.xml"); chart.render("chartdiv"); }</script>
此时,整个页面不必整个刷新,只需要刷新图表区即可。而且,很显然,这是一个比较简单的操作,需要注意:
- 不同类型的图表的xml数据源可能具有特定的xml标签或属性,所以在需要更改图表类型时,尽量使用在不同图表类型中通用的标签或属性
- 还是要强调,不同类型图表具有不同的含义,虽然可以方便地在不同图表类型之间进行转换,但是如果图表类型选择错误,很可能带来的是画蛇添足之嫌。如上面的时序数据,如果使用饼图可能就不那么恰当了,虽然将该图表转换为饼图是非常简单的操作
另外,使用dataURL方式对图表进行指定的数据源,并不要求是一个实际存在的物理xml文件,可以是任何一个返回XML文件或片断的HTTP请求,只有这样,我们才能根据特定的查询条件或过滤表达式方便地从数据库中检索图表所需数据先是在图表上。很显然,这种方式下只能通过POST传递HTTP请求需要的参数,此时,需要注意的是由于FusionCharts对于特殊字符的敏感性,在为FusionCharts对象使用setDataURL指定参数时,该参数字符串中最好不要包含除了英文字符、数字、?、&和-之外的字符,当然,最好使用Javascript中的escape函数对其进行编码。


 浙公网安备 33010602011771号