数据分析与机器学习之线性回归与逻辑回归(六)
一 机器学习分类
-
有监督学习
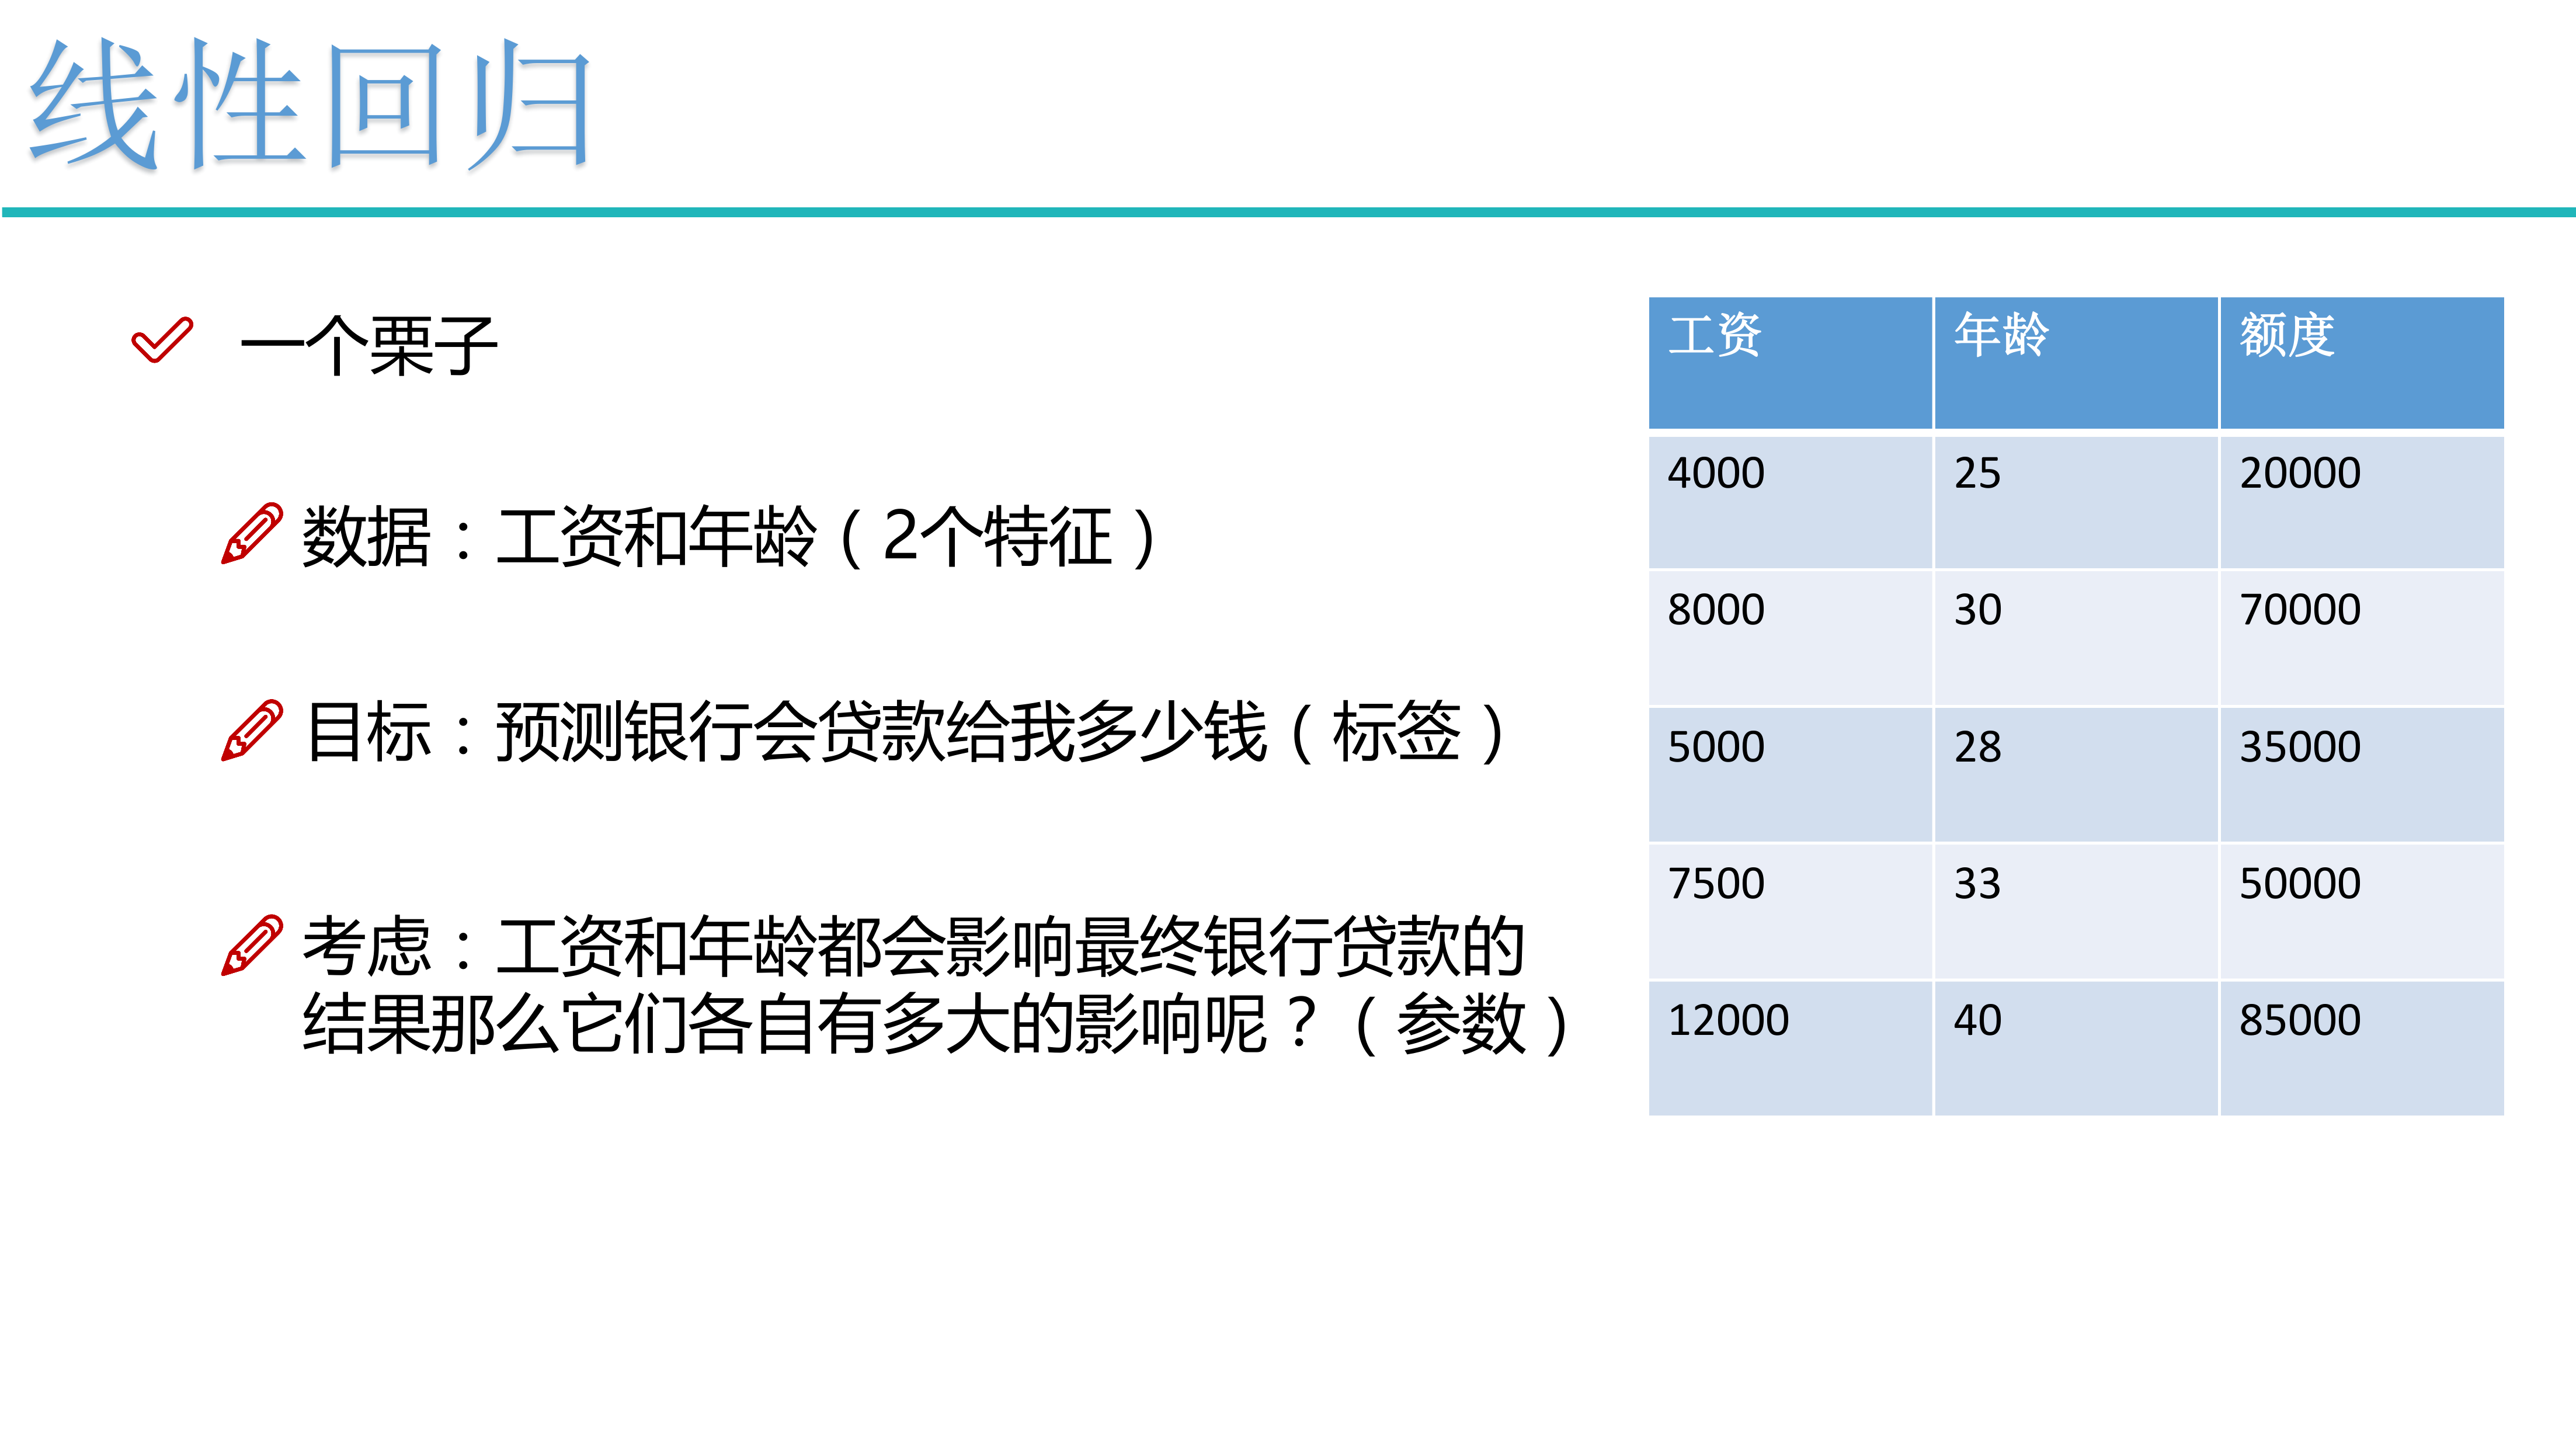
1 概述: 主要用于决策支持,它利用有标识的历史数据进行训练,以实现对新数据的表示的预测
2 分类: 分类计数预测的数据对象是离散的。如短信是否为垃圾短信,用户是否喜欢电子产品
比如: K近邻、朴素贝叶斯、决策树、SVM
3 回归: 回归技术预测的数据对象是连续值, 例如温度变化或时间变化。包括一元回归和多元回
归,线性回归和非线性回归: 例如 线性回归、逻辑回归、岭回归
-
无监督学习
1 概述: 数据无标识, 主要用于知识发现,在历史数据中发现隐藏的模式或内在结构
2 聚类: 聚类算法用于在数据中寻找隐藏的模式或分组。例如: K-means
-
半监督学习
1 概述: 在半监督学习方式下,训练数据有部分被标识,部分没有被标识,这种模型首先需要学习数据的内在结构,以便合理的组织数据来进行预测。算法上,包括一些对常用监督式学习算法的延伸,这些算法首先试图对未标识数据进行建模,在此基础上再对标识的数据进行预测。
二 线性回归数学原理

\[\theta^T: 特征权重的转置, \theta原本表示一维列矩阵,转置为一维行矩阵,X是一维列矩阵,此时\theta^T x代表行乘列的数值
\]
回归问题误差原理及公式推导
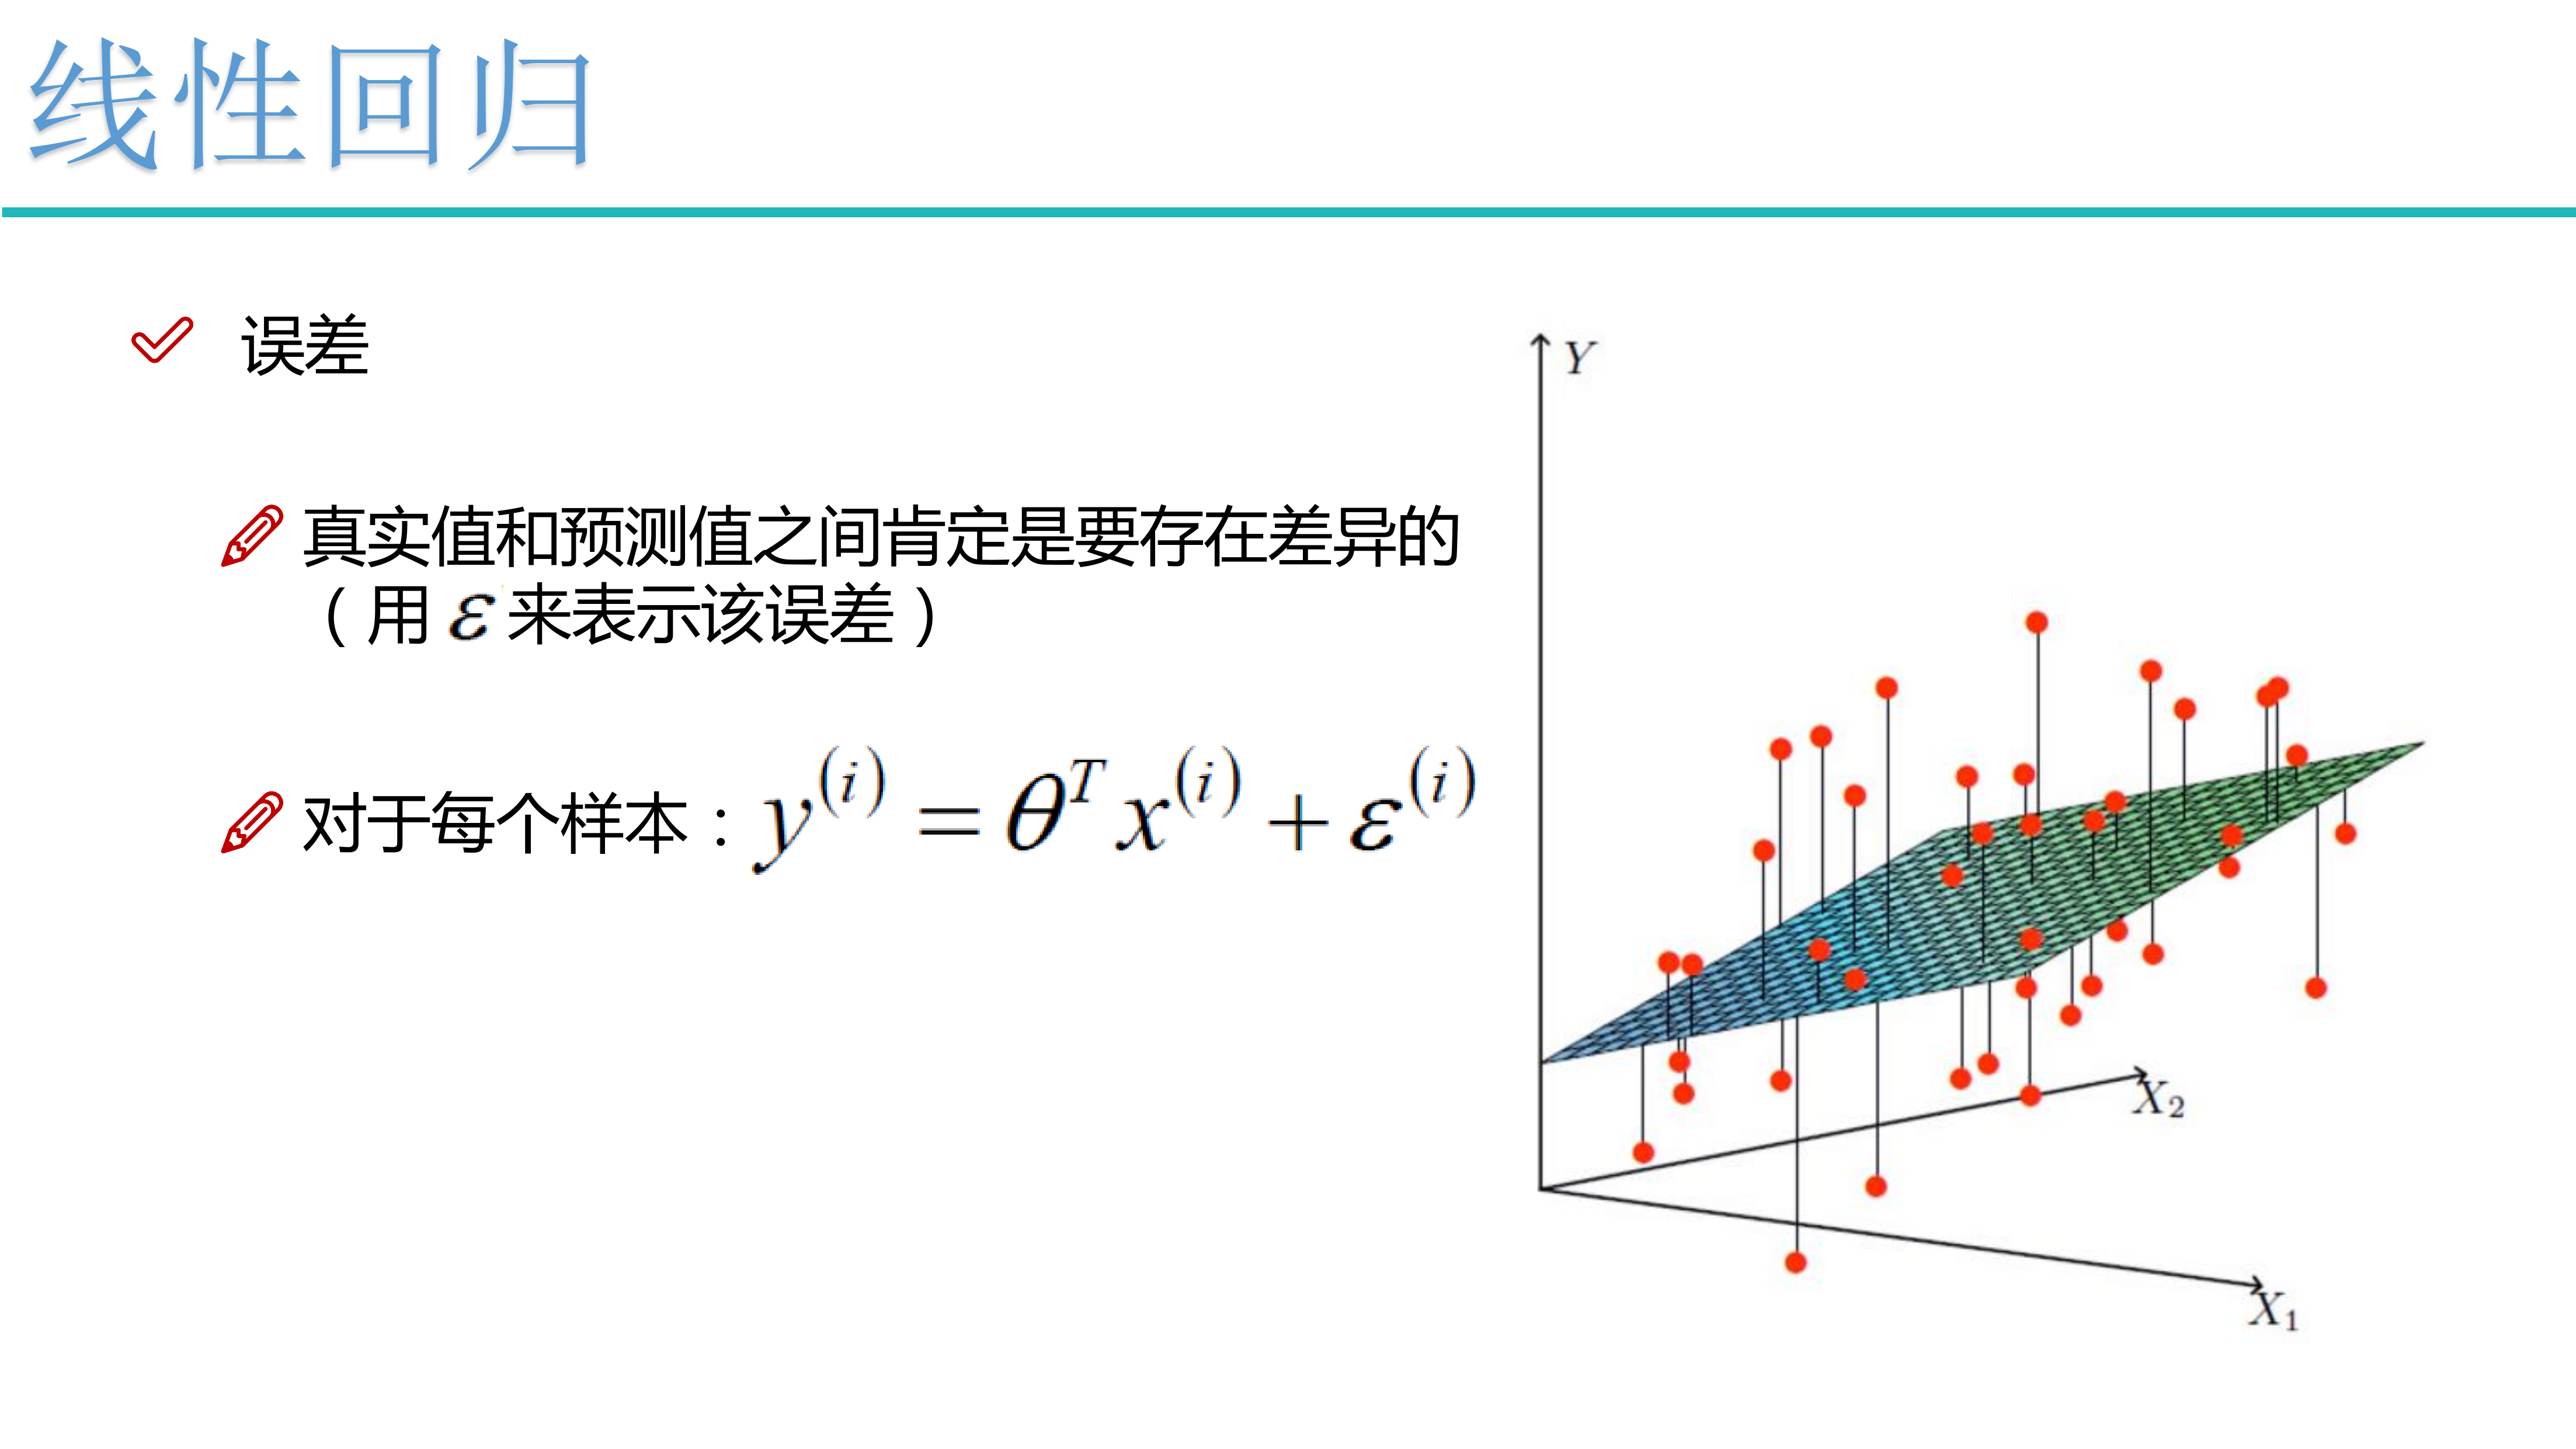
\[\theta^Tx^{(i)} 表示预测值, y^{(i)}表示真实值,两者之间存在误差\epsilon^{(i)}
\]
\[L(\theta) 似然函数: \theta^Tx^{(i)}要想越接近与y^{(i)},代表求和概率P应该越大越好
\]
矩阵求导过程省略,公式太多,都是笔记本上推导的
线性回归代码实现原理
#导包
import matplotlib.pyplot as plt
import numpy as np
from sklearn import datasets  #导入数据集
%matplotlib inline
构造线性回归类
#构造类
class LinearRegression():
    #初始化
    def __init__(self):
        self.w = None

    #进行训练
    def fit(self,X,y):
        print(X.shape)  #(422, 1)
        X = np.insert(X,0,1,axis=1)  #在列中新增x0 = 1的操作类似插入数据
        print(X.shape)  #(422, 2)
        print(X)
        X_ = np.linalg.inv(X.T.dot(X)) #x的转置dot(x)再取逆操作
        self.w = X_.dot(X.T).dot(y) #再dot(x的转置)dot(y)

    #进行预测
    def predict(self,X):
        X = np.insert(X,0,1,axis=1)
        y_pred = X.dot(self.w)
        return y_pred
预测值与测试值平方求均值
#将预测与预测值power2次方
def mean_squared_error(y_true,y_pred):
    mse = np.mean(np.power(y_true-y_pred,2))
    return mse
主函数执行
def main():
    #生成训练/测试数据
    diabetes = datasets.load_diabetes()
    X = diabetes.data[:,np.newaxis,2]
    print(X.shape)  #(442, 1)
    x_train,x_test = X[:-20],X[-20:]
    y_train,y_test = diabetes.target[:-20],diabetes.target[-20:]

    #线性回归数据导入:训练 预测
    clf = LinearRegression()
    clf.fit(x_train,y_train)
    y_pred = clf.predict(x_test)
    print(mean_squared_error(y_test,y_pred))

    #绘制图形
    plt.scatter(x_test[:,0],y_test,color='black')
    plt.plot(x_test[:,0],y_pred,color='blue',linewidth=3)
    plt.show()

三 逻辑斯蒂回归
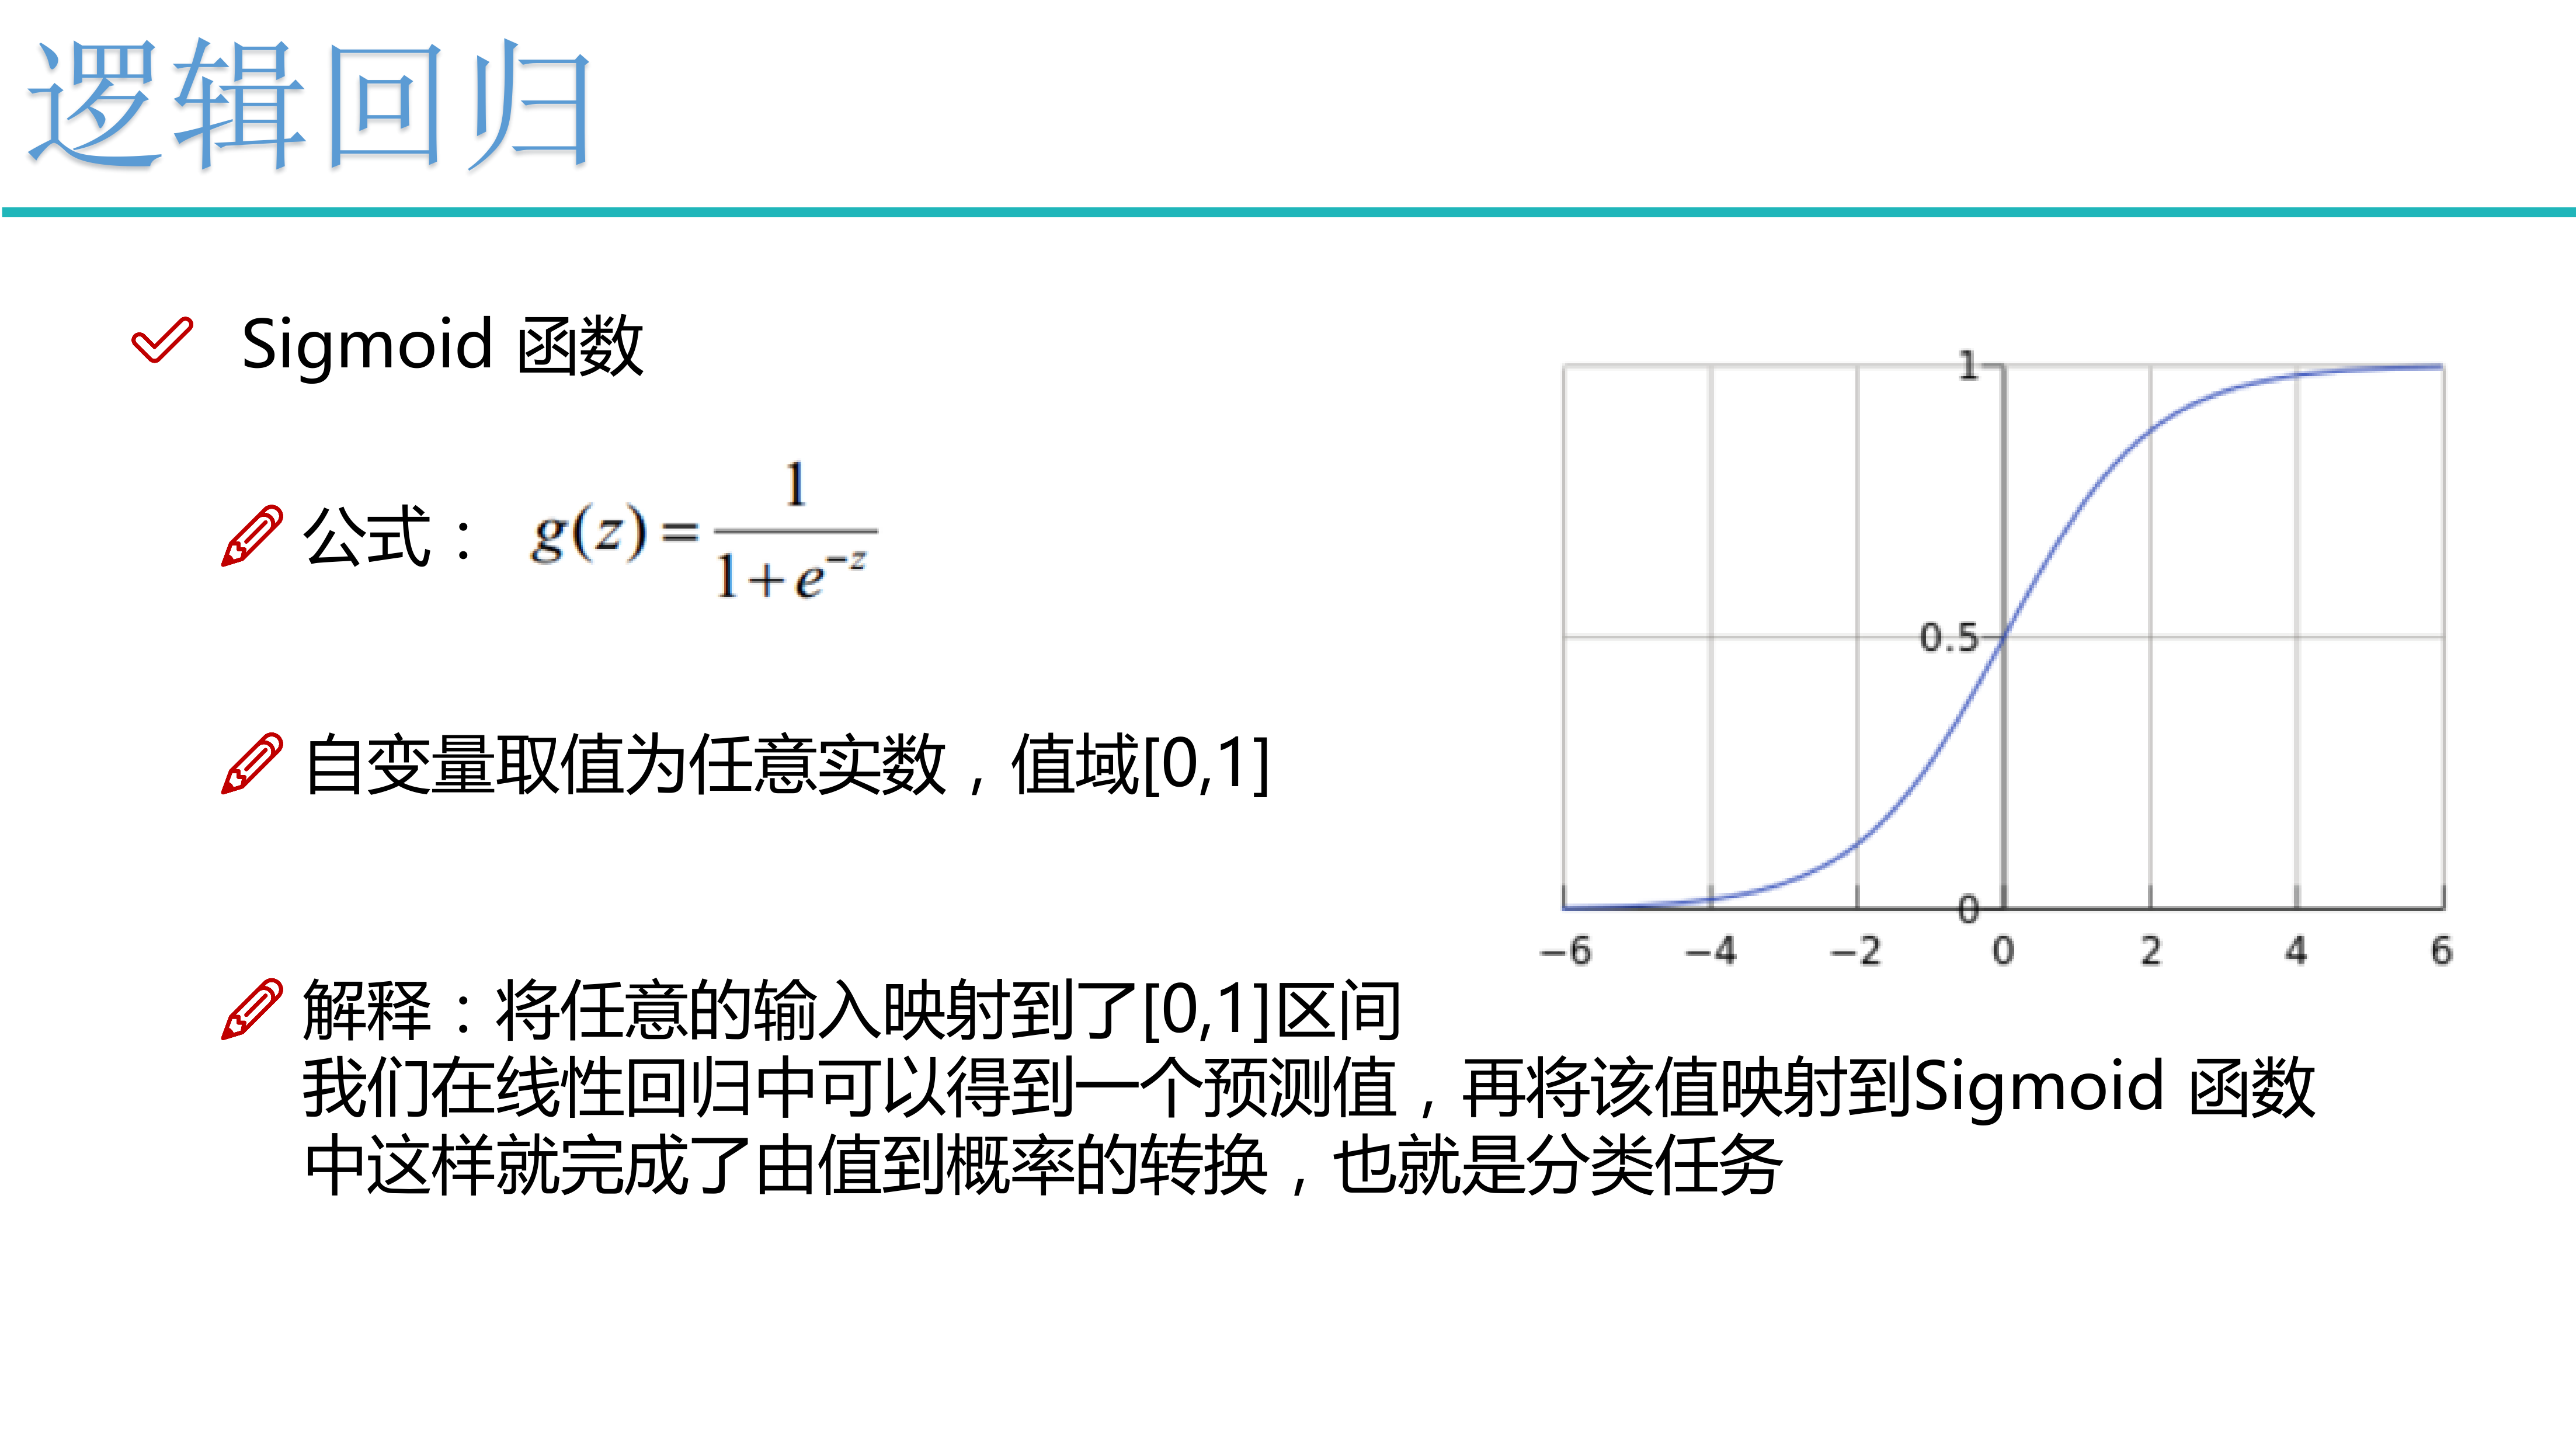
逻辑斯蒂原理代码
import matplotlib.pyplot as plt
import pandas as pd
pga = pd.read_csv('../Desktop/pga.csv')

#数据标准归一化处理
pga.distance = (pga.distance - pga.distance.mean()) / pga.distance.std()
pga.accuracy = (pga.accuracy - pga.accuracy.mean()) / pga.accuracy.std()
pga.head()

plt.scatter(pga.distance,pga.accuracy)
plt.xlabel('distance')
plt.ylabel('accurancy')
plt.show()

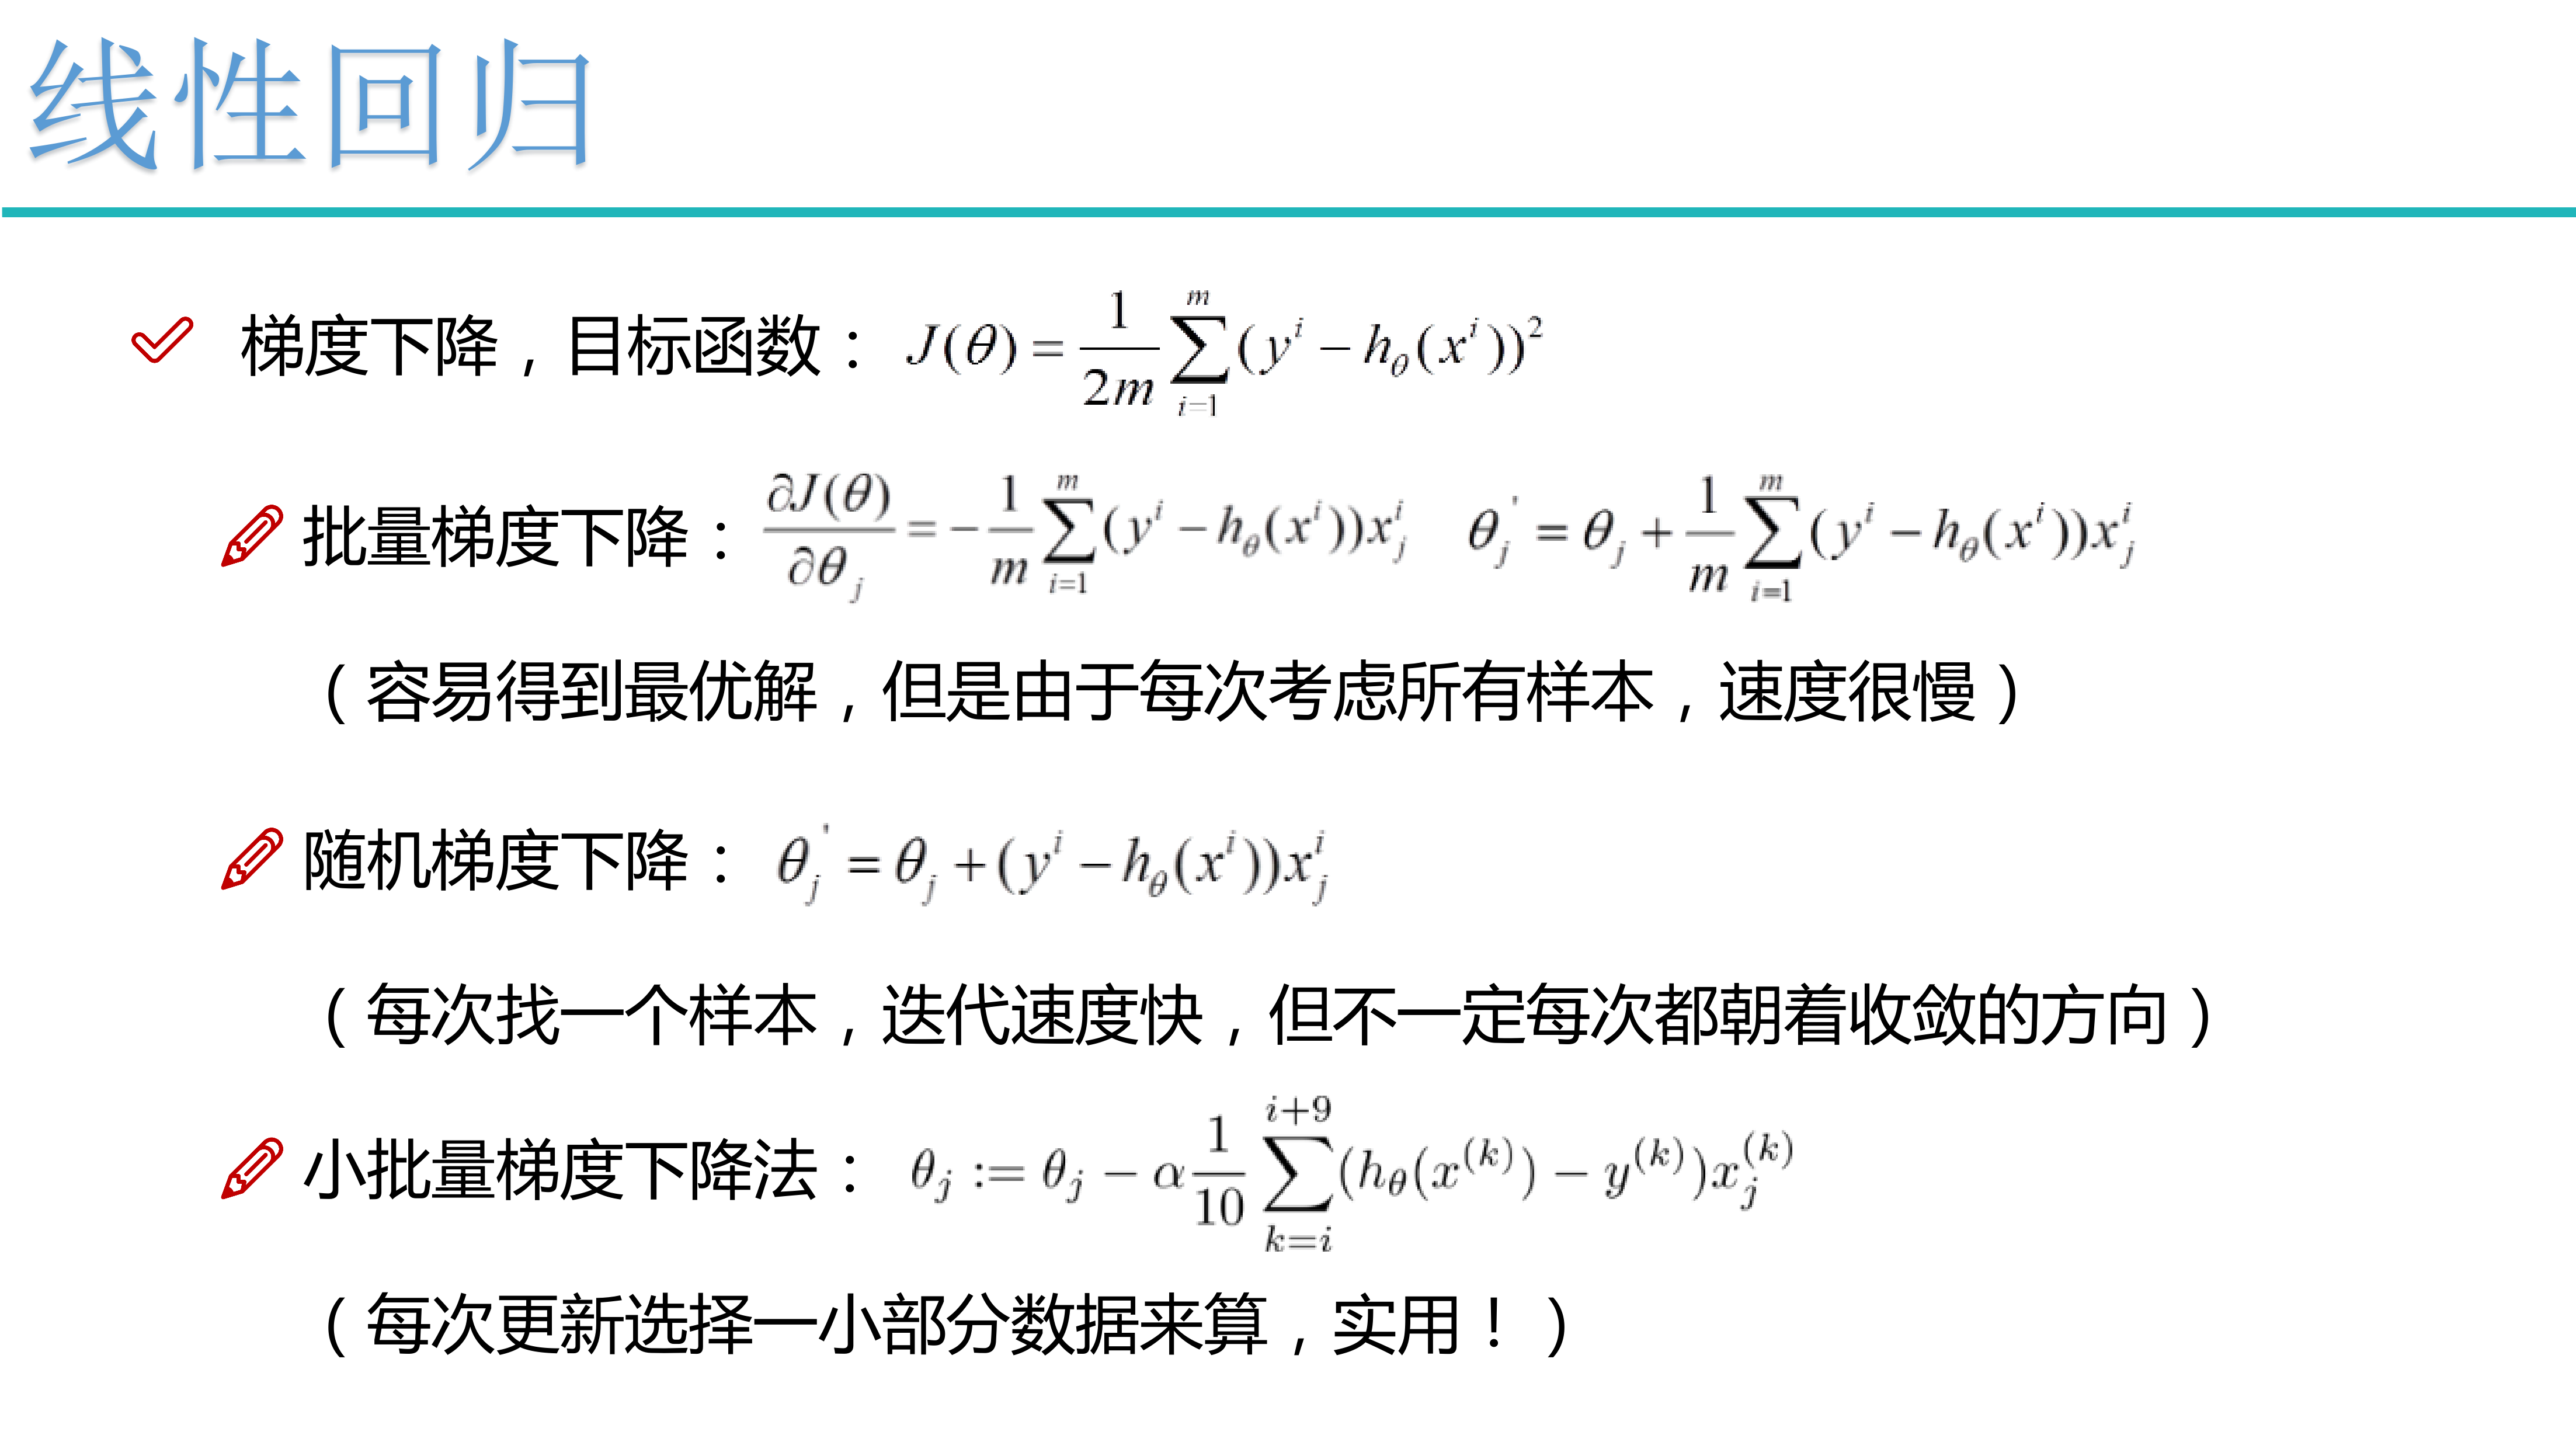
目标函数的构建
\[h_\theta(x) = \theta x + \theta_0 预测函数
\]
#目标函数(损失函数)
def cost(theta0,theta1,x,y):
    J=0
    m = len(x)
    for i in range(m):
        h = theta1*x[i] + theta0  #对应公式 h(x)值
        J += (h-y[i])**2  #目标函数 J = (h(x) - y)**2
    J /= (2*m)
    return J
print(cost(0,1,pga.distance,pga.accuracy))  #1.599438422599817

theta0 = 100
theta1s = np.linspace(-3,2,100)
costs = []
for theta1 in theta1s:
    costs.append(cost(theta0,theta1,pga.distance,pga.accuracy))
print(theta1s.shape)  #(100,)
plt.plot(theta1s,costs)
plt.show()

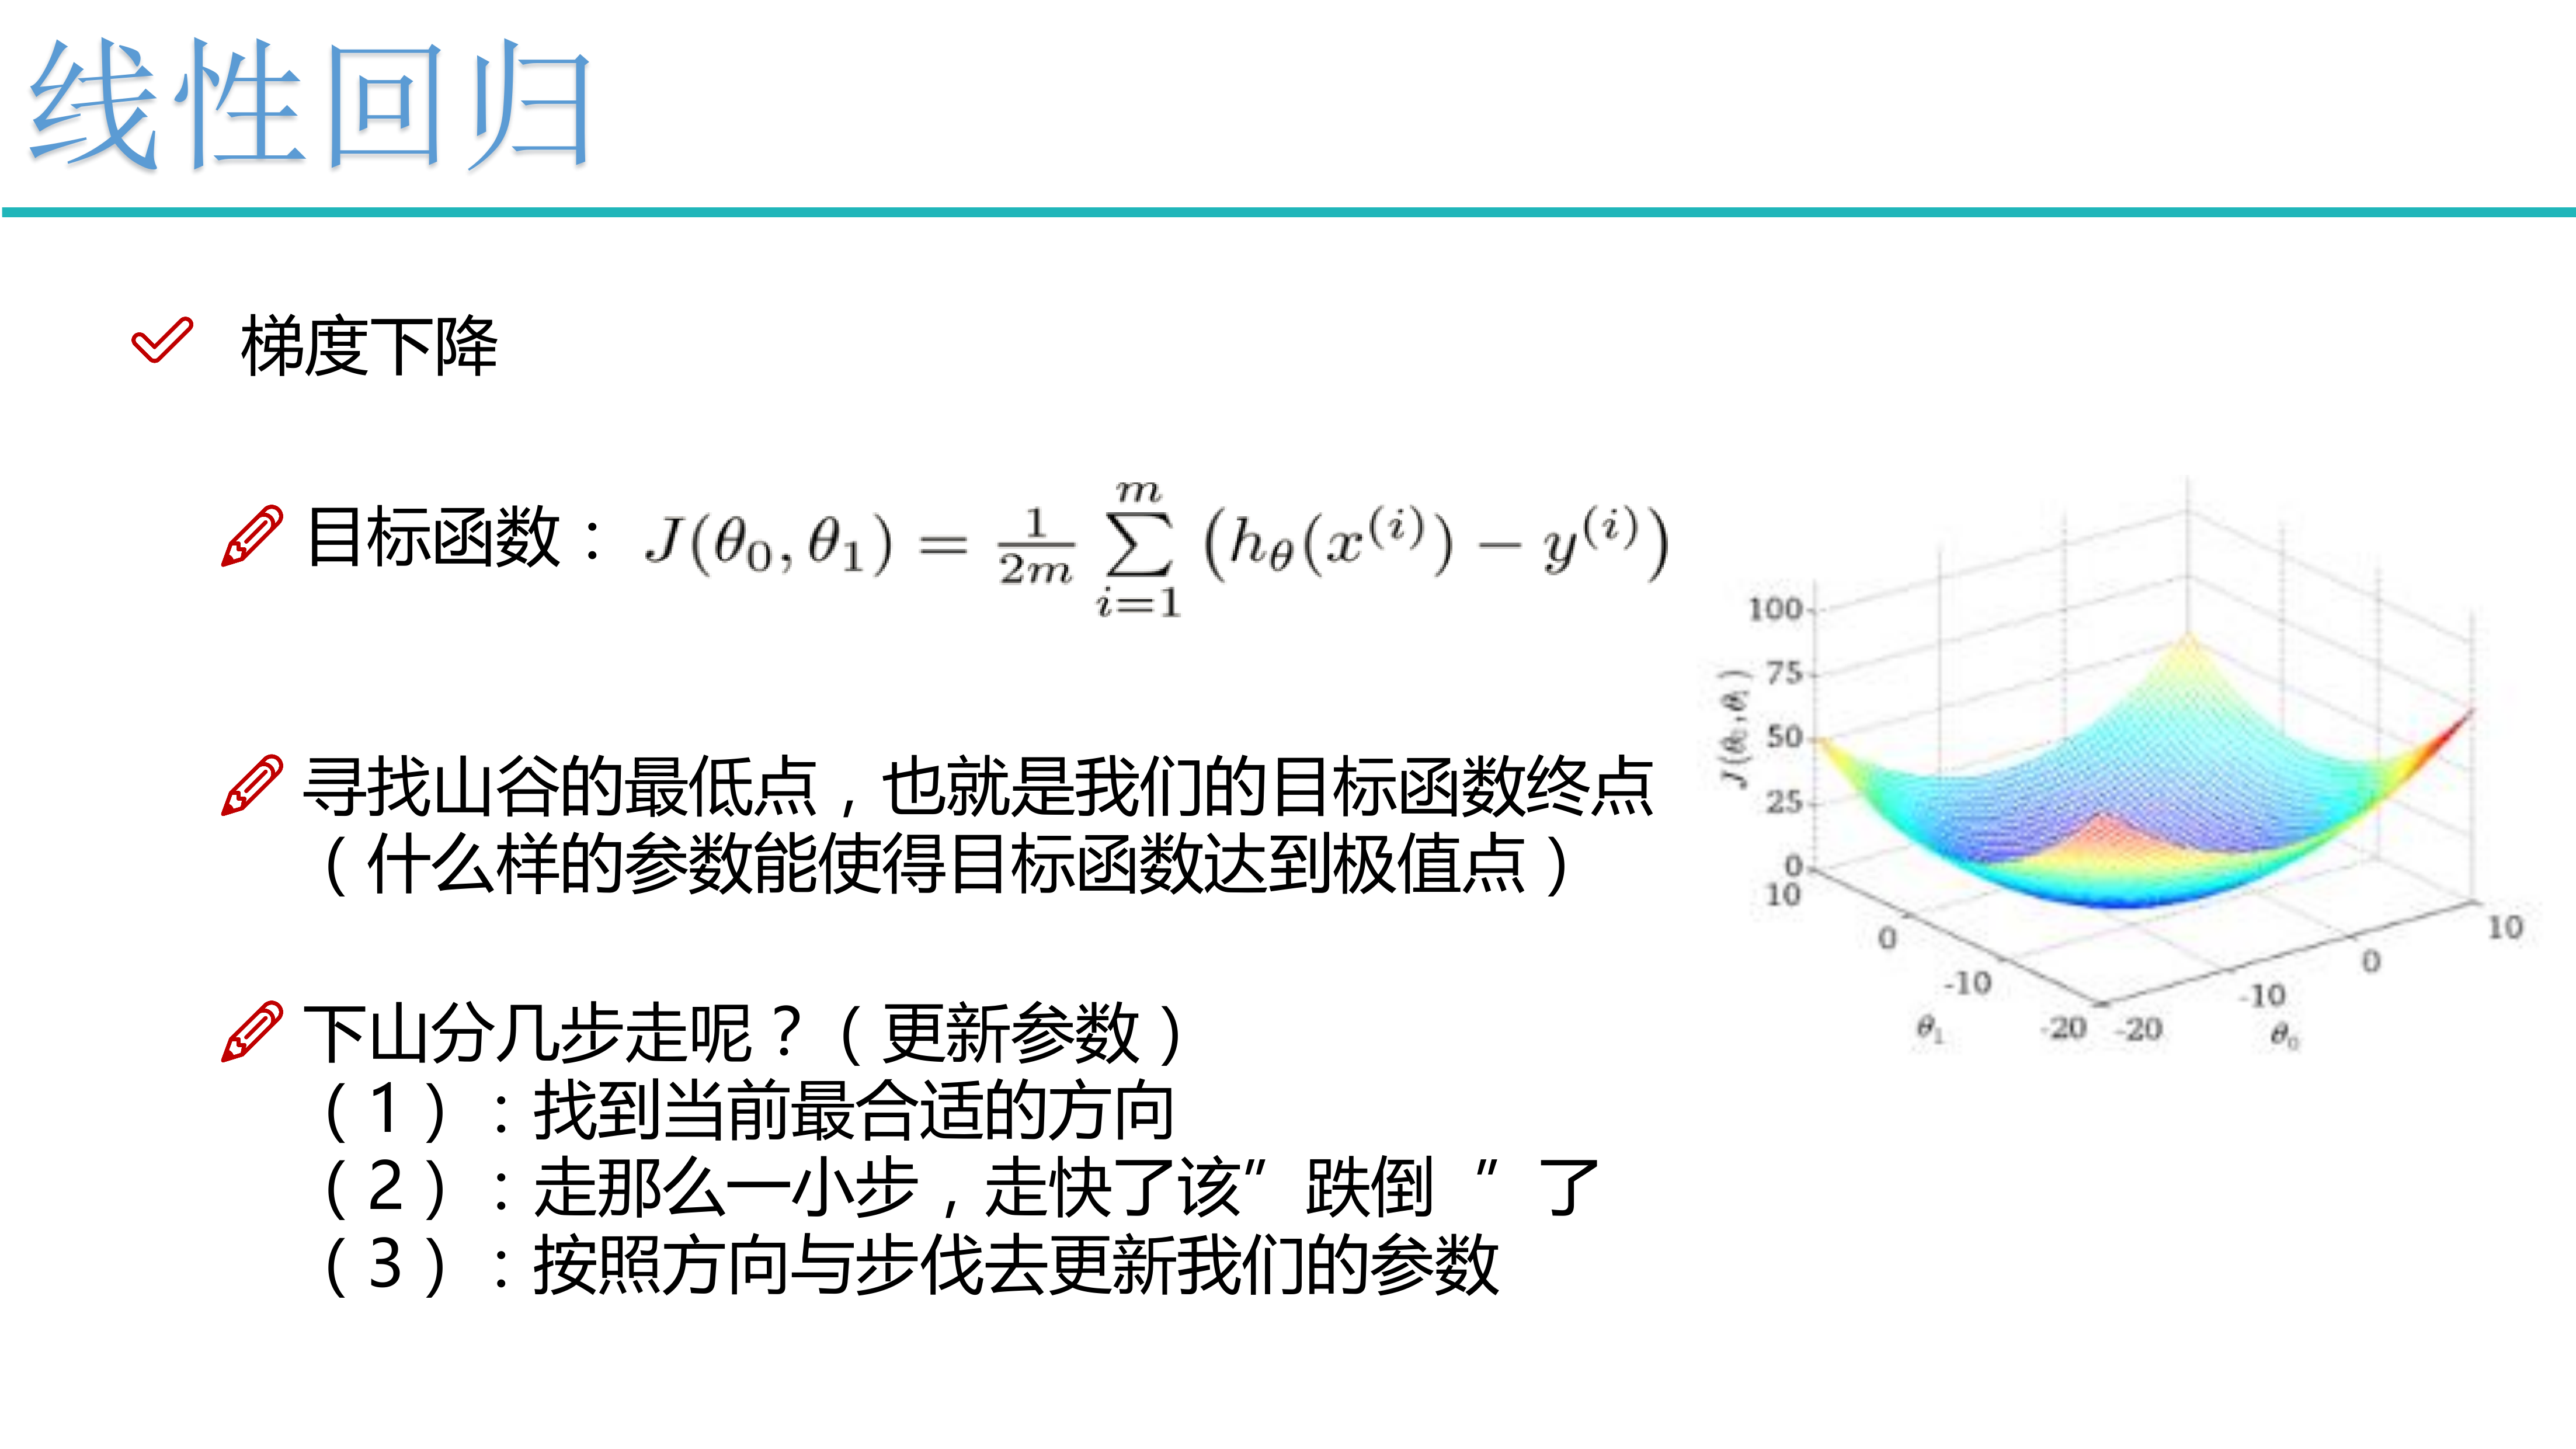
接下里我们采用梯度下降法原理解析这类问题
#梯度下降解决问题
import numpy as np
from mpl_toolkits.mplot3d.axes3d import Axes3D  #导入3D包
import matplotlib.pyplot as plt
%matplotlib inline

theta0s = np.linspace(-2,2,100)
theta1s = np.linspace(-2,2,100)
COST = np.empty(shape=(100,100))  #空白填充(100,100)的数组
print(COST.shape)  #(100, 100)

TOS,TIS = np.meshgrid(theta0s,theta1s)
print(TOS.shape,TIS.shape)  #  (100, 100) (100, 100)

#将标准归一化的数据替换新的数组并绘制
for i in range(100):
    for j in range(100):
        COST[i,j] = cost(TOS[0,i],TIS[j,0],pga.distance,pga.accuracy)
print(COST.shape)  #(100, 100)

fig2 = plt.figure()
ax = fig2.gca(projection='3d')
ax.plot_surface(X=TOS,Y=TIS,Z=COST)
plt.show()

#梯度下降实现原理:  对theta1与theta0进行求偏导值
#对theta1值进行求偏导值
def partial_cost_theta1(theta0,theta1,x,y):
    h = theta0 + theta1*x  #预测函数
    diff = (h-y) *x   # 对theta1进行求偏导  (h(x) - y) * x
    partial = diff.sum()/(x.shape[0])  #进行求和并除以样本数量
    return partial
partial1 = partial_cost_theta1(0,5,pga.distance,pga.accuracy)
print(partial1)

#对theta0进行求偏导值
def partial_cost_theta0(theta0,theta1,x,y):
    h = theta0 + theta1*x   #预测函数
    diff = (h-y)      #对theta0求偏导  (h(x) - y)
    partial = diff.sum() / (x.shape[0])  #进行求和并除以样本数量
    return partial

partial0 = partial_cost_theta0(1,1,pga.distance,pga.accuracy)
print(partial0)

#输出
5.5791338540719
1.0000000000000104
使用梯度下降迭代更新值
#梯度下降迭代更新值  alpha=0.1代表默认步长
def gradient_descent(x,y,alpha=0.1,theta0=0,theta1=0):
    max_epochs = 1000   #迭代次数1000
    counter = 0
    c = cost(theta1,theta0,pga.distance,pga.accuracy)
    costs = [c]
    convergence_thres = 0.00001  #定义下降趋势设置临界值精度
    cprev = c+ 10
    theta0s = [theta0]
    theta1s = [theta1]
    #判断目标函数值大于临界精度或者小于迭代次数,继续迭代
    while (np.abs(cprev-c) > convergence_thres) and (counter < max_epochs):
        cprev = c
        update0 = alpha*partial_cost_theta0(theta0,theta1,x,y)  #alpha乘以 theta0求的偏导值
        update1 = alpha*partial_cost_theta1(theta0,theta1,x,y)  #alpha乘以 theta1求的偏导值
        #更新theta值,梯度下降
        theta0 -= update0
        theta1 -= update1
        #添加到列表中
        theta0s.append(theta0)
        theta1s.append(theta1)
        #计算新的cost值
        c = cost(theta0,theta1,pga.distance,pga.accuracy)
        costs.append(c)
        counter += 1
    return {'theta0':theta0,'theta1':theta1,'costs':costs}

#实现当迭代次数越多,计算的目标函数cost值越低并趋于平缓,从而实现找到目标函数趋近的最低值
print('theta1=',gradient_descent(pga.distance,pga.accuracy)['theta1'])
descend = gradient_descent(pga.distance,pga.accuracy,alpha=0.01)
plt.scatter(range(len(descend['costs'])),descend['costs'])
plt.xlabel('costs_len')
plt.ylabel('costs')
plt.show()

#输出
theta1= -0.5984131176478865


 浙公网安备 33010602011771号