
linux下的 c 和 c++ 开发工具及linux内核开发工具
https://opensource.com/article/18/6/embedded-linux-build-tools
https://github.com/luong-komorebi/Awesome-Linux-Software#development
Anjuta:
http://anjuta.org/, a versatile software development studio featuring a number of advanced programming facilities including project management, application wizard, interactive debugger, source editor, version control, GUI designer, profiler and many more tools. It focuses on providing simple and usable user interface, yet powerful for efficient development.
codeblocks:
http://www.codeblocks.org/home, Code::Blocks is a free C, C++ and Fortran IDE built to meet the most demanding needs of its users. It is designed to be very extensible and fully configurable. Finally, an IDE with all the features you need, having a consistent look, feel and operation across platforms.
Yocto:
Yocto项目是一个开源协作项目,可帮助开发人员创建基于Linux的定制系统,这些系统专为嵌入式产品而设计,无论产品的硬件架构如何。Yocto Project提供灵活的工具集和开发环境,允许全球的嵌入式设备开发人员通过共享技术,软件堆栈,配置和用于创建这些定制的Linux映像的最佳实践进行协作。 yocto与Poky及openembedded是三剑客。
buildroot:
是Linux平台上一个构建嵌入式Linux系统的框架。整个Buildroot是由Makefile脚本和Kconfig配置文件构成的。你可以和编译Linux内核一样,通过buildroot配置,menuconfig修改,编译出一个完整的可以直接烧写到机器上运行的Linux系统软件(包含boot、kernel、rootfs以及rootfs中的各种库和应用程序)。 与gems5及qemu (kqemu是qemu的加速器?)配合使用,非常好,参考这篇文章:https://github.com/cirosantilli/linux-kernel-module-cheat。
使用buildroot搭建基于qemu的虚拟开发平台,参考《通过buildroot+qemu搭建ARM-Linux虚拟开发环境》。
文件系统搭建,强烈建议直接用buildroot,官网 http://buildroot.uclibc.org/ 上有使用教程非常详细。
crosstool-ng: 交叉编译工具链的制作工具。
OpenWRT/LEDE:
Desktop distros:
linux内核调试工具:
内核调试以及工具总结
工具 描述:
官网介绍的工具集: https://www.kernel.org/doc/html/latest/dev-tools/testing-overview.html
计算机软件系统仿真器与调试工具集合: http://pages.cs.wisc.edu/~arch/www/tools.html
dump_stack 当你已知一个函数的名字,想在kernel运行中打印谁调用了这个函数(包括所有调用栈),可以在该函数里加入 dump_stack(); 这一行代码就可以了。
debugfs 等文件系统 提供了 procfs, sysfs, debugfs以及 relayfs 来与用户空间进行数据交互, 尤其是 debugfs, 这是内核开发者们实现的专门用来调试的文件系统接口. 其他的工具或者接口, 多数都依赖于 debugfs.
printk 强大的输出系统, 没有什么逻辑上的bug是用PRINT解决不了的。printk能够解决很多问题,如果不够就加上printk_ratelimited。 printk已经不推荐使用了,推荐用 pr_*() 来代替 printk(),这是一个函数族:pr_emerg(), pr_alert(), pr_crit(), pr_err(), pr_warning(), pr_notice(), pr_info(), pr_cont(), pr_debug()。 dev_emerg(), dev_alert(), dev_crit(), dev_err(), dev_warn(), dev_notice(), dev_info(), dev_dbg():它们的最大特点是需要传入一个 struct device 的参数,并且会打印出这个 device 的名字,一般是在驱动相关的代码里使用。 earlyprintk:一般用来处理一些发生在启动初期时的异常,最常见的现象就是系统打印完 Starting Kernel... 后就 hang 住了的时候。
WARN_ON(): 这个函数可以打印出当前的函数调用栈,一般在高度可疑的地方使用它。除此之外还有BUG() 和 BUG_ON(condition)。 pstore:如果发生 Kernel panic 时,我们并没有连接串口终端,那么这一次的崩溃信息就丢失了,Pstore (persistent storage) 就可以用来处理这种情况。当发生 Kernel painic 时,Pstore 会自动保存 oops 和 panic 的 log,并且在软重启后仍可以查看 log 信息。默认情况下,log 是存储在 RAM 的某个保留区域中,但也可以使用存储设备,例如闪存。 devmem2:这是一个命令行工具,它可以在用户空间去读写内存,大多数情况,用它来读写寄存器,简单粗暴。
Kdump 它似乎很强大,kdump 是一种基于 kexec 系统调用 的内核崩溃转储机制。当系统崩溃时,kdump 使用 kexec 启动进入到第二个内核 (dump-capture kernel),从而获得 coredump 信息。kdump tool中的crash工具是用来分析dump文件的(其功能不输trace32,但trace32需要硬件来连接jtag),安装kdump 只需要执行: sudo apt-get install kdump-tools,如果安装失败,先sudo apt-get update然后再安装。安装后即可运行 crash,kdump,kexec 和 makedumpfile。
ftrace 以及其前端工具trace-cmd (https://www.trace-cmd.org/)等 内核提供了 ftrace 工具来实现检查点, 事件等的检测, 这一框架依赖于 debugfs, 他在 debugfs 中的 tracing 子系统中为用户提供了丰富的操作接口, 我们可以通过该系统对内核实现检测和分析. 功能虽然强大, 但是其操作并不是很简单, 因此使用者们为实现了 trace-cmd 等前端工具, 简化了 ftrace 的使用.可以支持对 tracepoint, kprobes, uprobes 机制的处理, 同时还提供了事件追踪(event tracing, 类似 tracepoint 和 function trace 的组合) , 追踪过滤, 事件的计数和计时, 记录函数执行流程等功能. 我们常用的 perf-tools 工具集就是依赖 ftrace 机制而实现的.
kprobe 以及更强大的systemtap 内核中实现的 krpobe 通过类似与代码劫持一样的技巧, 在内核的代码或者函数执行前后, 强制加上某些调试信息, 可以很巧妙的完成调试工作, 这是一项先进的调试技术, 但是仍然有觉得它不够好, 劫持代码需要用驱动的方式编译并加载, 能不能通过脚本的方式自动生成劫持代码并自动加载和收集数据, 于是systemtap 出现了. 通过 systemtap 用户只需要编写脚本, 就可以完成调试并动态分析内核, systemtap可以完整的替代dtrace的功能,想使用dtrace的时候使用systemtap就可以了。
kgdb && kgtp KGDB 是大名鼎鼎的内核调试工具, KGTP则通过驱动的方式强化了 gdb的功能, 诸如tracepoint, 打印内核变量等。Kgtp开源项目作者还提供了一个专门针对Kgtp有特别帮助的GDB变种gdbt。Kgtp的用法,比如远程跟踪、离线跟踪、条件跟踪等可以直接参考项目主页的帮助文档。说一下Kgtp能做什么,不能做什么。我们要知道Kgtp提供的是trace而不是break,正因为这样,Kgtp才能不干扰中断内核的正常运行,也正因为这样,Kgtp只能做信息的采集功能,而不能做内核或模块的单步调试。那么具体来说,Kgtp提供的优点以及能够做的事情主要包括:一、简单独立,这个是最重要的,简单才方便我们去使用它。Kgtp以单独模块存在,想使用时直接insmod,调试完毕时rmmod即可。同时,Kgtp不干扰中断内核的正常运行,将对内核的影响缩减到最小。二、查看当前系统全局变量,可以利用Kgtp打印当前的内核变量jiffies_64,而且其它内核变量也能类似打印出来,这在我们需要调试内核时有用,无需再去写个模块printk一下或其它变通办法。三、帮助我们调试模块,模块执行出现异常,我们最常用的调式办法是在认为合适的地方加上printk查看对应的变量,发现第一次printk没放对地方或是需要查看的变量值却没有去printk,这时只能换个地方或修改对应的printk,改动和编译耗费不少时间,而通过Kgtp就比较方便。我们只需通过Gdb命令修改对应的变量信息收集即可。另外,Kgtp支持条件设置跟踪点,方便收集与统计更有针对性。四、系统性能瓶颈分析,这才是Kgtp的强项,除了其提供了大量的自定义状态变量,更可以通过GDB scripts编写复杂的信息统计逻辑,方便提供分析,这点对做服务器运维的童鞋在进行系统性能分析时应该特别有用。
perf erf Event是一款随 inux内核代码一同发布和维护的性能诊断工具, 核社区维护和发展. Perf 不仅可以用于应用程序的性能统计分析, 也可以应用于内核代码的性能统计和分析. 得益于其优秀的体系结构设计, 越来越多的新功能被加入 Perf, 使其已经成为一个多功能的性能统计工具集
LTTng LTTng是一个 Linux 平台开源的跟踪工具, 是一套软件组件, 可允许跟踪 Linux 内核和用户程序, 并控制跟踪会话(开始/停止跟踪、启动/停止事件 等等).
用户空间与内核空间数据交换的文件系统
内核中有三个常用的伪文件系统: procfs, debugfs和sysfs.
文件系统 描述
procfs The proc filesystem is a pseudo-filesystem which provides an interface to kernel data structures.
sysfs The filesystem for exporting kernel objects.
debugfs Debugfs exists as a simple way for kernel developers to make information available to user space.
relayfs A significantly streamlined version of relayfs was recently accepted into the -mm kernel tree.
它们都用于Linux内核和用户空间的数据交换, 但是适用的场景有所差异:
procfs 历史最早, 最初就是用来跟内核交互的唯一方式, 用来获取处理器、内存、设备驱动、进程等各种信息.
sysfs 跟 kobject 框架紧密联系, 而 kobject 是为设备驱动模型而存在的, 所以 sysfs 是为设备驱动服务的.
debugfs 从名字来看就是为 debug 而生, 所以更加灵活.
relayfs 是一个快速的转发 (relay) 数据的文件系统, 它以其功能而得名. 它为那些需要从内核空间转发大量数据到用户空间的工具和应用提供了快速有效的转发机制.
slub debug slab是kernel中的对象内存分配系统,区别于buddy伙伴系统的page页分配,slab主要管理经常分配与释放的对象的内存,而buddy管理page等大块内存的分配。slub debug主要监控内核对象的内存访问越界(包括左越界和右越界)。
KASAN Kernel Address SANitizer,主要调试运行中的堆栈和全局变量等越界的访问(函数级别?)。
sysdig 另一种创新的方式获取所有的系统调用, sysdig 以内核模块的方式监控获取所有的系统调用, 其使用方式类似 libpcap/tcpdump 的用法, 可以将一段时间内的系统调用数据暂存起来供后续的跟踪分析. 因为对于 syscall_64 来讲, 用户态层面的系统调用最终都会陷入到内核态, 由内核去完成对应的功能. sysdig 在内核态也就能很方便的获取到进程的上下文信息. sysdig 以非阻塞(non-blocking), 零拷贝(zero-copy) 的方式获取数据, 所以在实际使用中对在线的业务只有很轻微的影响. 线上繁忙程序的分析可以考虑使用 sysdig 而不是 strace. 更多 sysdig 示例可以参考: Sysdig-Examples. 用来调试网络数据流及磁盘io等也非常好用!
ebpf eBPF: extended Berkeley Packet Filter 已经被合并到了 Linux 内核的主版本中, 相当于一个内核虚拟机, 以 JIT(Just In Time) 的方式运行事件相关的追踪程序, 同时 eBPF 也支持对 ftrace, perf_events 等机制的处理. 另外 eBPF 在传统的包过滤器进行很大的变革, 其在内核追踪, 应用性能追踪, 流控等方面都做了很大的改变, 不过在接口的易用性方面还有待提高. 第三方的 bpftrace 实现了对 eBPF 的封装, 支持 python, lua 等接口, 用起来方便了很多, 还有其提供的 bcc 工具集在 > Linux 4.1+ 的系统中被广泛应用. 可以说 eBPF 能够监控所有想监控的, 在 Linux 4.1+ 系统中, 动态追踪工具使用 eBPF 一款即可. 低版本的内核更多的时候需要同时使用多个工具来互相辅助追踪分析.
动态追踪历史
严格来讲 Linux 中的动态追踪技术其实是一种高级的调试技术, 可以在内核态和用户态进行深入的分析, 方便开发者或系统管理者便捷快速的定位和处理问题. Linux 在过去十多年的发展中, 演化了很多追踪技术, 不过一直没有一款可以媲美 Solaris/FreeBSD 系统中的 DTrace 追踪工具, 直到 Linux 4.1+ 版本 eBPF 机制的出现, 这种情况才得到了极大的改善. 不过 eBPF 也不是一蹴而就的, 而是经过了漫长的过程才得以完善.
如下所示, 为 Linux 追踪技术的大致发展历程(时间可能不够准确, 具体可参考 kernel-tracing-page37):
| 年份 | 技术 |
|---|---|
| 2004 | kprobes/kretprobes |
| 2008 | ftrace |
| 2005 | systemtap |
| 2009 | perf_events |
| 2009 | tracepoints |
| 2012 | uprobes |
| 2015 ~ 至今 | eBPF (Linux 4.1+) |
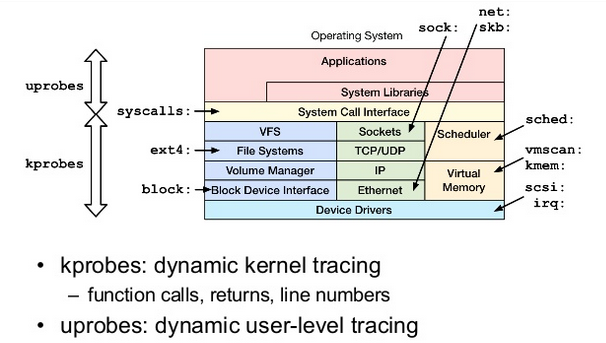
经过长期的发展, kprobes/uprobes 机制在事件(events)的基础上分别为内核态和用户态提供了追踪调试的功能, 这也构成了 tracepoint 机制的基础, 后期的很多工具, 比如 perf_events, ftrace 等都是在其基础上演化而来. 参考由 Brendan Gregg (Linux调试工具大神,其工具集合位于:https://github.com/brendangregg/perf-tools )提供的资料来看, kprobes/uprobes 在 Linux 动态追踪层面起到了基石的作用, 如下所示:
更详细的介绍参见 Tracing: no shortage of options, 下面则简单介绍下每种动态追踪工具的机制.
动态追踪技术总体来说推荐使用 epbf,ftrace, systemtap, sysdig。
User mode Linux (UML)
https://en.wikipedia.org/wiki/User-mode_Linux
听说 FAUmachine 比UML更高级些?
Another virtualization another method that allows step debugging kernel code.
UML is very ingenious: it is implemented as an ARCH, just like x86, but instead of using low level instructions, it implements the ARCH functions with userland system calls.
The result is that you are able to run Linux kernel code as a userland process on a Linux host!
First make a rootfs and run it as shown at: https://unix.stackexchange.com/questions/73203/how-to-create-rootfs-for-user-mode-linux-on-fedora-18/372207#372207
The um defconfig sets CONFIG_DEBUG_INFO=y by default (yup, it is a development thing), so we are fine.
While debugging Linux kernel we can utilize several tools, for example, debuggers (KDB, KGDB), dumping while crashed (LKCD), tracing toolkit (LTT, LTTV, LTTng), custom kernel instruments (dprobes, kprobes). In the following section I tried to summarized most of them, hope these will help.
uml 可以参考两篇文章: https://www.cnblogs.com/274914765qq/p/4655759.html 及 https://hackmd.io/@sysprog/user-mode-linux-env
根文件系统下载地址: http://fs.devloop.org.uk/
LKCD (Linux Kernel Crash Dump) tool allows the Linux system to write the contents of its memory when a crash occurs. These logs can be further analyzed for the root cause of the crash. Resources regarding LKCD
- http://www-01.ibm.com/support/knowledgecenter/linuxonibm/liaax/lkcd.pdf
- https://www.novell.com/coolsolutions/feature/15284.html
- https://www.novell.com/support/kb/doc.php?id=3044267
Oops when kernel detects a problem, it prints an Oops message. Such a message is generated by printk statements in the fault handler (arch/*/kernel/traps.c). A dedicated ring buffer in the kernel being used by the printk statements. Oops contains information like, the CPU where the Oops occurred on, contents of CPU registers, number of Oops, description, stack back trace and others. Resources regarding kernel Oops
- https://www.kernel.org/doc/Documentation/oops-tracing.txt
- http://madwifi-project.org/wiki/DevDocs/KernelOops
- https://wiki.ubuntu.com/DebuggingKernelOops
Dynamic Probes is one of the popular debugging tool for Linux which developed by IBM. This tool allows the placement of a “probe” at almost any place in the system, in both user and kernel space. The probe consists of some code (written in a specialized, stack-oriented language) that is executed when control hits the given point. Resources regarding dprobes / kprobes listed below
- http://www-01.ibm.com/support/knowledgecenter/linuxonibm/liaax/dprobesltt.pdf
- http://citeseerx.ist.psu.edu/viewdoc/download?doi=10.1.1.107.6212&rep=rep1&type=pdf
- https://www.redhat.com/magazine/005mar05/features/kprobes/
- https://sourceware.org/systemtap/kprobes/
- http://www.ibm.com/developerworks/library/l-kprobes/index.html
- https://doc.opensuse.org/documentation/html/openSUSE_121/opensuse-tuning/cha.tuning.kprobes.html
Linux Trace Toolkit is a kernel patch and a set of related utilities that allow the tracing of events in the kernel. The trace includes timing information and can create a reasonably complete picture of what happened over a given period of time. Resources of LTT, LTT Viewer and LTT Next Generation
- http://elinux.org/Linux_Trace_Toolkit
- http://www.linuxjournal.com/article/3829
- http://multivax.blogspot.com/2010/11/introduction-to-linux-tracing-toolkit.html
MEMWATCH is an open source memory error detection tool. It works by defining MEMWATCH in gcc statement and by adding a header file to our code. Through this we can track memory leaks and memory corruptions. Resources regarding MEMWATCH
ftrace is a good tracing framework for Linux kernel. ftrace traces internal operations of the kernel. This tool included in the Linux kernel in 2.6.27. With its various tracer plugins, ftrace can be targeted at different static tracepoints, such as scheduling events, interrupts, memory-mapped I/O, CPU power state transitions, and operations related to file systems and virtualization. Also, dynamic tracking of kernel function calls is available, optionally restrictable to a subset of functions by using globs, and with the possibility to generate call graphs and provide stack usage. You can find a good tutorial of ftrace at https://events.linuxfoundation.org/slides/2010/linuxcon_japan/linuxcon_jp2010_rostedt.pdf
ltrace is a debugging utility in Linux, used to display the calls a user space application makes to shared libraries. This tool can be used to trace any dynamic library function call. It intercepts and records the dynamic library calls which are called by the executed process and the signals which are received by that process. It can also intercept and print the system calls executed by the program.
- http://www.ellexus.com/getting-started-with-ltrace-how-does-it-do-that/?doing_wp_cron=1425295977.1327838897705078125000
- http://developerblog.redhat.com/2014/07/10/ltrace-for-rhel-6-and-7/
KDB is the in-kernel debugger of the Linux kernel. KDB follows simplistic shell-style interface. We can use it to inspect memory, registers, process lists, dmesg, and even set breakpoints to stop in a certain location. Through KDB we can set breakpoints and execute some basic kernel run control (Although KDB is not source level debugger). Several handy resources regarding KDB
- http://www.drdobbs.com/open-source/linux-kernel-debugging/184406318
- http://elinux.org/KDB
- http://dev.man-online.org/man1/kdb/
- https://www.kernel.org/pub/linux/kernel/people/jwessel/kdb/usingKDB.html
KGDB is intended to be used as a source level debugger for the Linux kernel. It is used along with gdb to debug a Linux kernel. Two machines are required for using kgdb. One of these machines is a development machine and the other is the target machine. The kernel to be debugged runs on the target machine. The expectation is that gdb can be used to "break in" to the kernel to inspect memory, variables and look through call stack information similar to the way an application developer would use gdb to debug an application. It is possible to place breakpoints in kernel code and perform some limited execution stepping. Several handy resources regarding KGDB
简单的说kdb只能在目标机上运行,因此不能实现源码级调试;而kgdb是在开发机上运行gdb,目标机上运行kgdb,能实现源码级跟踪调试。但是现在 kdb和kgdb都合并了,都在linux内核里可以无缝切换了,因此就更方便了,切换方法:https://www.kernel.org/doc/html/v5.0/dev-tools/kgdb.html#switching-between-kdb-and-kgdb。
支付宝扫一扫捐赠

微信公众号: 共鸣圈
欢迎讨论,邮件: 924948$qq.com 请把$改成@
QQ群:263132197
QQ: 924948

 浙公网安备 33010602011771号