


pyhton pandas库的学习
pandas两种主要的数据结构:Series和DataFrame
Series:类似于一维数组的对象,由一组数据以及一组与之相关的数据标签(即索引)组成。Series中的索引值可以重复
DataFrame:一个表格型的数据结构,包含有一组有序的列,每列可以是不同的值类型(数值、字符串、布尔型等),DataFrame即有行索引也有列索引,可以被看成是Series组成的字典
1. Seriess
通过一维数组创建:
arr = np.array([1,2,3,4,np.NaN])
series1 = Series(arr)
自定义Series索引:
series2 = Series([90,80,85])
series2.index = [u'语文',u'数学',u'英语']
print(series2)

series2 = Series([90,80,70],index=[u'语文',u'数学',u'英语'])
print(series2)

RangeIndex(start=0, stop=5, step=1)
语文    90
数学    80
英语    85
通过字典方式创建,key重复会被后面的覆盖:
dict1 = {'一':100,'二':200,'三':300,'一':500}
series3 = Series(dict1)
print(series3)
print(series3.index)
print(series3.values)
print(series3.dtype)

一    500
三    300
二    200
dtype: int64
Index([u'一', u'三', u'二'], dtype='object')
[500 300 200]
int64
Series索引可以重复:
series4 = Series([90,80,70,100])
series4.index = [u'一',u'二',u'三',u'一']
print(series4)
print(series4[u'一'])

一     90
二     80
三     70
一    100
dtype: int64
一     90
一    100
dtype: int64
Series的运算
series = Series({'101': -100,'102':200,'103': 300})
print(series)
print(series > 100)
print(series / 100)
print(np.fabs(series))
print(np.exp(series))

101   -100
102    200
103    300
dtype: int64
101    False
102     True
103     True
dtype: bool
101   -1.0
102    2.0
103    3.0
dtype: float64
101    100.0
102    200.0
103    300.0
dtype: float64
101     3.720076e-44
102     7.225974e+86
103    1.942426e+130
dtype: float64
Series缺失值检测
scores = Series({'a':90,'b':80,'c':95})
new = ['a','b','cc','c','d']
scores1 = Series(scores,index=new)
print scores1
print(pd.isnull(scores1))
print(scores1[pd.isnull(scores1)])
print(scores1[pd.notnull(scores1)])

a     90.0
b     80.0
cc     NaN
c     95.0
d      NaN
dtype: float64
a     False
b     False
cc     True
c     False
d      True
dtype: bool
cc   NaN
d    NaN
dtype: float64
a    90.0
b    80.0
c    95.0
dtype: float64
Series自动对齐,在进行运算时会自动匹配相同的索引进行运算
s1 = Series([1,2,3],index=['p1','p2','p3'])
s2 = Series([4,5,6,7],index=['p2','p3','p4','p5'])
print(s1+s2)

p1    NaN
p2    6.0
p3    8.0
p4    NaN
p5    NaN
dtype: float64
2. DataFrame
通过二维数组创建:
df = DataFrame([['a','b','c','d'],[1,2,3,4]])
print(df)
   0  1  2  3
0  a  b  c  d
1  1  2  3  4

arr = np.array([
    [1,2,3,4],
    [2,3,4,5],
    [3,4,5,6]
])

df = DataFrame(arr,index=['one','two','three'],columns=['a','b','c','d'])   #index是行索引,columns是列索引
print(df)
print(df.values)
 a  b  c  d
one    1  2  3  4
two    2  3  4  5
three  3  4  5  6
[[1 2 3 4]
 [2 3 4 5]
 [3 4 5 6]]
通过字典方式创建:
dict1 = {
    'a': ['100','101','102'],
    'b': ['1','2','3'],
    'year': ['2019','2018','2017'],
    'month': '06'
}

df = DataFrame(dict1)   #字典形式创建的DataFrame,key会做为列索引
df.index = ['one','two','three']
print(df)

         a  b month  year
one    100  1    06  2019
two    101  2    06  2018
three  102  3    06  2017
DataFrame数据获取:
可以直接通过列索引获取指定列的数据 df[column_name]
通过ix方法来获取对应行索引的行数据 df.ix[index_name]
dataframe删除原来行索引,重新建立从0开始的索引:
df.reset_index(drop=True)
按指定列排序 dataframe sort_values
升序:
df.sort_values(by="sales" ) by 指定列
降序:
df.sort_values(by="sales" , ascending=False) by 指定列
遍历dataframe:
 for index, row in oneTweetDf.iterrows():
    if index == 0:
       lineData = row.tolist()
    else:
       lineData.extend([row["CrwalTime"], row["Like"], row["Transfer"], row["Comment"]])
3. pandas基本功能
3.1.读写文件
读文件常用的方法是read_csv
df = pd.read_csv("C:/Users/ADMIN/Desktop/data.txt",sep=";",header=None) #header=None,第一行数据不作为索引
print(df)

       0   1   2   3     4
0  gerry  18  90  95  96.0
1    tom  20  92  94   NaN
2   lili  21  98  97  96.0
写文件 writer
file = codecs.open(fileName, 'wb', "utf_8_sig")
csv_writer = csv.writer(finaFile)
#写一行
csv_writer .writerow(header)
#写多行
csv_writer.writerows(datas)
3.2.索引、选取和数据过滤
pandas数据过滤
columns = ['name','age',u'语文',u'数学',u'英语']
df.columns = columns
print(df)

print(df[columns[2:]])

    name  age  语文  数学    英语
0  gerry   18  90  95  96.0
1    tom   20  92  94   NaN
2   lili   21  98  97  96.0
   语文  数学    英语
0  90  95  96.0
1  92  94   NaN
2  98  97  96.0
删除NaN的行
print(df.dropna()) #删除整行包含nan值的行数据
print(df.dropna(how="all")) #删除整行全是nan值的行数据
填充数据fillna
df = DataFrame(np.random.randn(7,3))
df.ix[:4,1] = np.nan
df.ix[:2,2] = np.nan
print(df)
print(df.fillna(0)) #填充所有nan
print(df.fillna({1:1,2:2})) #按列进行填充

 0         1         2
0 -1.181993       NaN       NaN
1 -1.537796       NaN       NaN
2 -0.334437       NaN       NaN
3 -0.629362       NaN  1.336971
4 -0.476075       NaN  1.410920
5  0.661803  1.926648  1.311989
6  0.160683  0.294160 -0.341011
          0         1         2
0 -1.181993  0.000000  0.000000
1 -1.537796  0.000000  0.000000
2 -0.334437  0.000000  0.000000
3 -0.629362  0.000000  1.336971
4 -0.476075  0.000000  1.410920
5  0.661803  1.926648  1.311989
6  0.160683  0.294160 -0.341011
          0         1         2
0 -1.181993  1.000000  2.000000
1 -1.537796  1.000000  2.000000
2 -0.334437  1.000000  2.000000
3 -0.629362  1.000000  1.336971
4 -0.476075  1.000000  1.410920
5  0.661803  1.926648  1.311989
6  0.160683  0.294160 -0.341011
3.3.算法运算和数据对齐
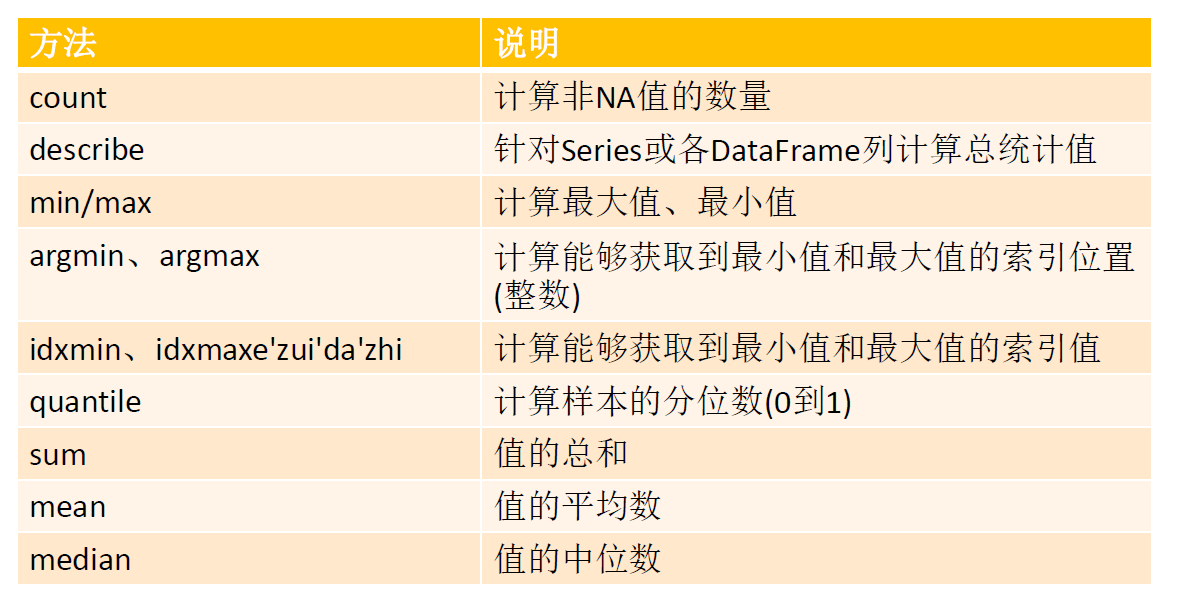
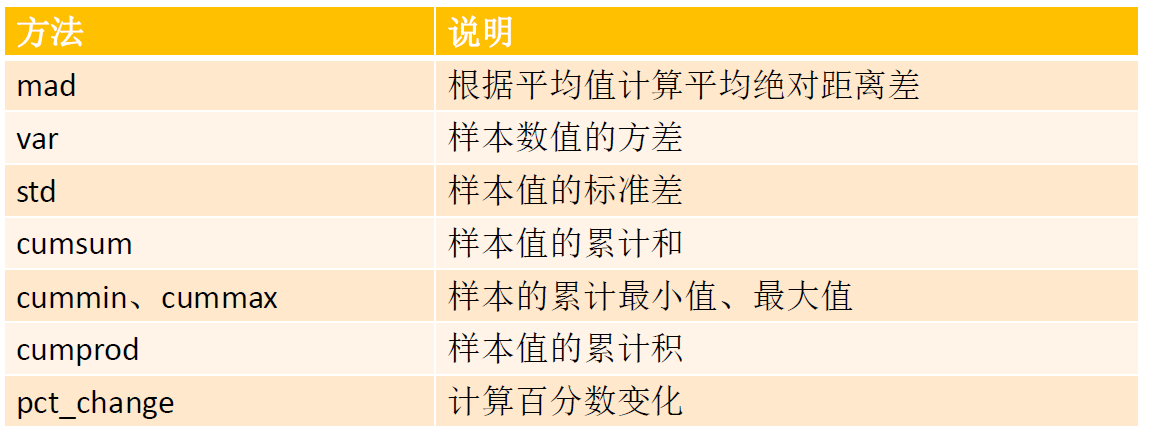
常用的数据统计方法:
相关系数与协方差:
df = DataFrame({
    "GDP":[12,23,34,20,30],
    "air_temperture": [26,27,30,28,29],
    "year": ['2001','2002','2003','2004','2005']
})
print(df)
print u"相关系数:\n",df.corr()
print u"协方差:\n", df.cov()
print df['GDP'].corr(df['air_temperture'])
print df['GDP'].cov(df['air_temperture'])
pandas唯一值、值计数以及成员资格
ser = Series(['a','b','c','d','a','b'])
print(ser)
print ser.unique()  #去重
print ser.value_counts()    #计数,默认按值出现频率降序排列
mask = ser.isin(['b','c'])  #判断每个元素是否为b或c
print mask
print(ser[mask])

0    a
1    b
2    c
3    d
4    a
5    b
dtype: object
['a' 'b' 'c' 'd']
b    2
a    2
d    1
c    1
dtype: int64
0    False
1     True
2     True
3    False
4    False
5     True
dtype: bool
1    b
2    c
5    b
dtype: object
pandas层次索引
df = DataFrame({
    'year': [2005,2005,2006,2006,2007],
    'fruit': ['apple','banana','apple','banana','apple'],
    'production': [2000,2500,3000,2400,3200],
    'profits': [100,150,200,300,210]
})

df = df.set_index(['year','fruit'])
print(df)

             production  profits
year fruit
2005 apple         2000      100
     banana        2500      150
2006 apple         3000      200
     banana        2400      300
2007 apple         3200      210

print df.ix[2005,'apple']

production    2000
profits        100
按层次化索引进行数据统计
print df.sum(level='year')
print df.mean(level='fruit')
print df.min(level=['fruit'])

  production  profits
year
2005        4500      250
2006        5400      500
2007        3200      210
         production  profits
fruit
apple   2733.333333    170.0
banana  2450.000000    225.0
        production  profits
fruit
apple         2000      100
banana        2400      150

 浙公网安备 33010602011771号