安装mysql exporter
安装mysql exporter
Prometheus MySQL Exporter是一个客户端应用程序,用于获取MySQL指标并导出到Prometheus Server。
在这里,我们将介绍如何在数据库服务器上配置Prometheus MySQL Exporter程序,包括MySQL MariaDB和使用Grafana可视化数据。这将使您能够很好地查看数据库性能,并在遇到问题时知道在何处检查。警报规则的配置超出了本指南的范围,但我将尝试在下一个指南中介绍它。
本指南将有三个主要步骤
- Prometheus server的安装和配置
- 在数据库服务器上安装和配置MySQL Prometheus exporter
- 创建/导入MySQL Grafana仪表板 - 我们将使用Percona现成的仪表盘。
官方下载地址:
https://prometheus.io/download/
github地址:
https://github.com/prometheus/mysqld_exporter
下载安装MySQL Exporter
添加Prometheus系统用户和组:
sudo groupadd --system prometheus
sudo useradd -s / sbin / nologin --system -g prometheus prometheus
该用户将管理exporter service。
下载安装MySQL Exporter
这应该在MySQL / MariaDB服务器上完成,包括从服务器和主服务器。您可能需要检查 Prometheus MySQL导出器版本 页面以获取最新版本,然后将最新版本导出到 VER 变量,如下所示:
export VER=0.12.1
wget https://github.com/prometheus/mysqld_exporter/releases/download/v${VER}/mysqld_exporter-${VER}.linux-amd64.tar.gz
tar xvf mysqld_exporter-${VER}.linux-amd64.tar.gz
mv mysqld_exporter-${VER}.linux-amd64/mysqld_exporter /usr/local/bin/
chmod +x /usr/local/bin/mysqld_exporter
通过删除tarball和提取目录来清理安装。
rm -rf mysqld_exporter-${VER}.linux-amd64*
创建Prometheus exporter数据库用户
用户应该有 PROCESS, SELECT, REPLICATION CLIENT grants.
创建用户并分配权限
CREATE USER 'mysqld_exporter'@'localhost' IDENTIFIED BY 'Mysql@123' WITH MAX_USER_CONNECTIONS 3;
GRANT PROCESS, REPLICATION CLIENT, SELECT ON *.* TO 'mysqld_exporter'@'localhost';
FLUSH PRIVILEGES;
EXIT
如果您具有主从数据库体系结构,则仅在主服务器上创建用户。
WITH MAX_USER_CONNECTIONS 2 用于为用户设置最大连接限制,以避免在负载较重的情况下使用监控擦除来使服务器过载。
配置数据库凭据
创建数据库凭证文件,为用户创建添加正确的用户名和密码并设置所有权限:
cat > /etc/.mysqld_exporter.cnf <<EOF
[client]
user=mysqld_exporter
password=Mysql@123
EOF

chown root:prometheus /etc/.mysqld_exporter.cnf
创建systemd单元文件
创建一个新的服务文件:
cat > /etc/systemd/system/mysql_exporter.service <<EOF
[Unit]
Description=Prometheus MySQL Exporter
After=network.target
User=prometheus
Group=prometheus

[Service]
Type=simple
Restart=always
ExecStart=/usr/local/bin/mysqld_exporter \
--config.my-cnf /etc/.mysqld_exporter.cnf \
--collect.global_status \
--collect.info_schema.innodb_metrics \
--collect.auto_increment.columns \
--collect.info_schema.processlist \
--collect.binlog_size \
--collect.info_schema.tablestats \
--collect.global_variables \
--collect.info_schema.query_response_time \
--collect.info_schema.userstats \
--collect.info_schema.tables \
--collect.perf_schema.tablelocks \
--collect.perf_schema.file_events \
--collect.perf_schema.eventswaits \
--collect.perf_schema.indexiowaits \
--collect.perf_schema.tableiowaits \
--collect.slave_status \
--web.listen-address=0.0.0.0:9104

[Install]
WantedBy=multi-user.target
EOF
完成后,重新加载systemd并启动 mysql_exporter 服务。
systemctl daemon-reload
systemctl enable --now mysql_exporter
使用Prometheus监控MySQL
配置要由Prometheus Server抓取的MySQL endpoint.
登录到您的Prometheus服务器并配置端点以进行抓取。下面是两个MySQL数据库服务器的示例。
vim /etc/prometheus/prometheus.yml
#DB Servers
  - job_name: server1_db
    static_configs:
      - targets: ['192.168.93.40:9104']
        labels:
          alias: db1

  - job_name: server2_db
    static_configs:
      - targets: ['192.168.93.41:9104']
        labels:
          alias: db2
第一台服务器有IP地址192.168.93.40 ,第二台服务器是 192.168.93.41。使用类似格式添加其他目标。每个目标的作业名称应该是唯一的。
注意:Prometheus Server应该能够通过网络到达目标。确保您具有正确的网络/防火墙配置。
创建/导入MySQL Grafana仪表板
现在我们已经配置了目标并且要监控代理,我们应该很好地将Prometheus数据源添加到Grafana,以便我们可以进行度量可视化。需要为MySQL Prometheus exporter创建/导入Grafana仪表板。
如果您没有足够的时间来创建自己的仪表板,您可以使用Percona创建的仪表板,它们是开源的。
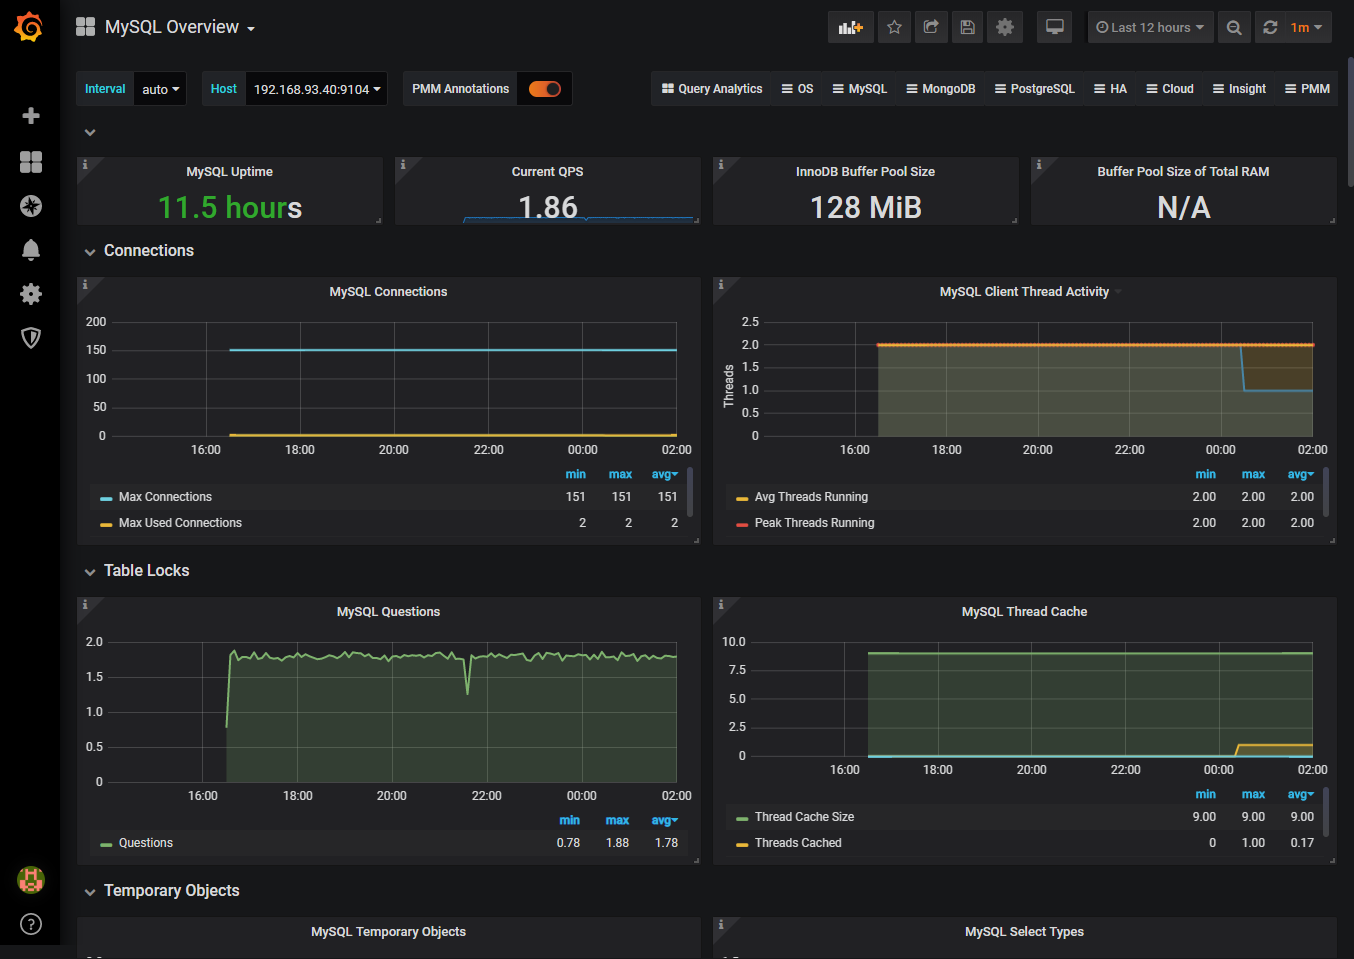
让我们下载MySQL_Overview 仪表板,它可以很好地概述数据库性能。
mkdir ~/grafana-dashboards
cd ~/grafana-dashboards/
wget https://raw.githubusercontent.com/percona/grafana-dashboards/master/dashboards/MySQL_Overview.json
将Prometheus MySQL仪表板上传到grafana
去Dashboards > Import > Upload .json file
使用仪表板文件找到目录并导入,收集的指标应该开始显示.
如果要导入Prometheus的所有Percona仪表板,请将它们安装在Grafana服务器上。
git clone https://github.com/percona/grafana-dashboards.git
cp -r grafana-dashboards/dashboards /var/lib/grafana/
您需要重新启动Grafana服务器才能导入这些仪表板。
sudo systemctl restart grafana-server
sudo service grafana-server restart
查看仪表盘

 浙公网安备 33010602011771号