夜莺监控( Nightingale )
1.简介
1.1夜莺介绍
夜莺监控( Nightingale )是一款国产、开源云原生监控分析系统,采用 All-In-One 的设计,集数据采集、可视化、监控告警、数据分析于一体。于 2020 年 3 月 20 日,在 github 上发布 v1 版本,已累计迭代 60 多个版本。从 v5 版本开始与 Prometheus、VictoriaMetrics、Grafana、Telegraf、Datadog 等生态紧密协同集成,提供开箱即用的企业级监控分析和告警能力,已有众多企业选择将 Prometheus + AlertManager + Grafana 的组合方案升级为使用夜莺监控。夜莺监控,由滴滴开发和开源,并于 2022 年 5 月 11 日,捐赠予中国计算机学会开源发展委员会(CCF ODC),为 CCF ODC 成立后接受捐赠的第一个开源项目。夜莺监控的核心开发团队,也是Open-Falcon项目原核心研发人员。
1.2产品介绍
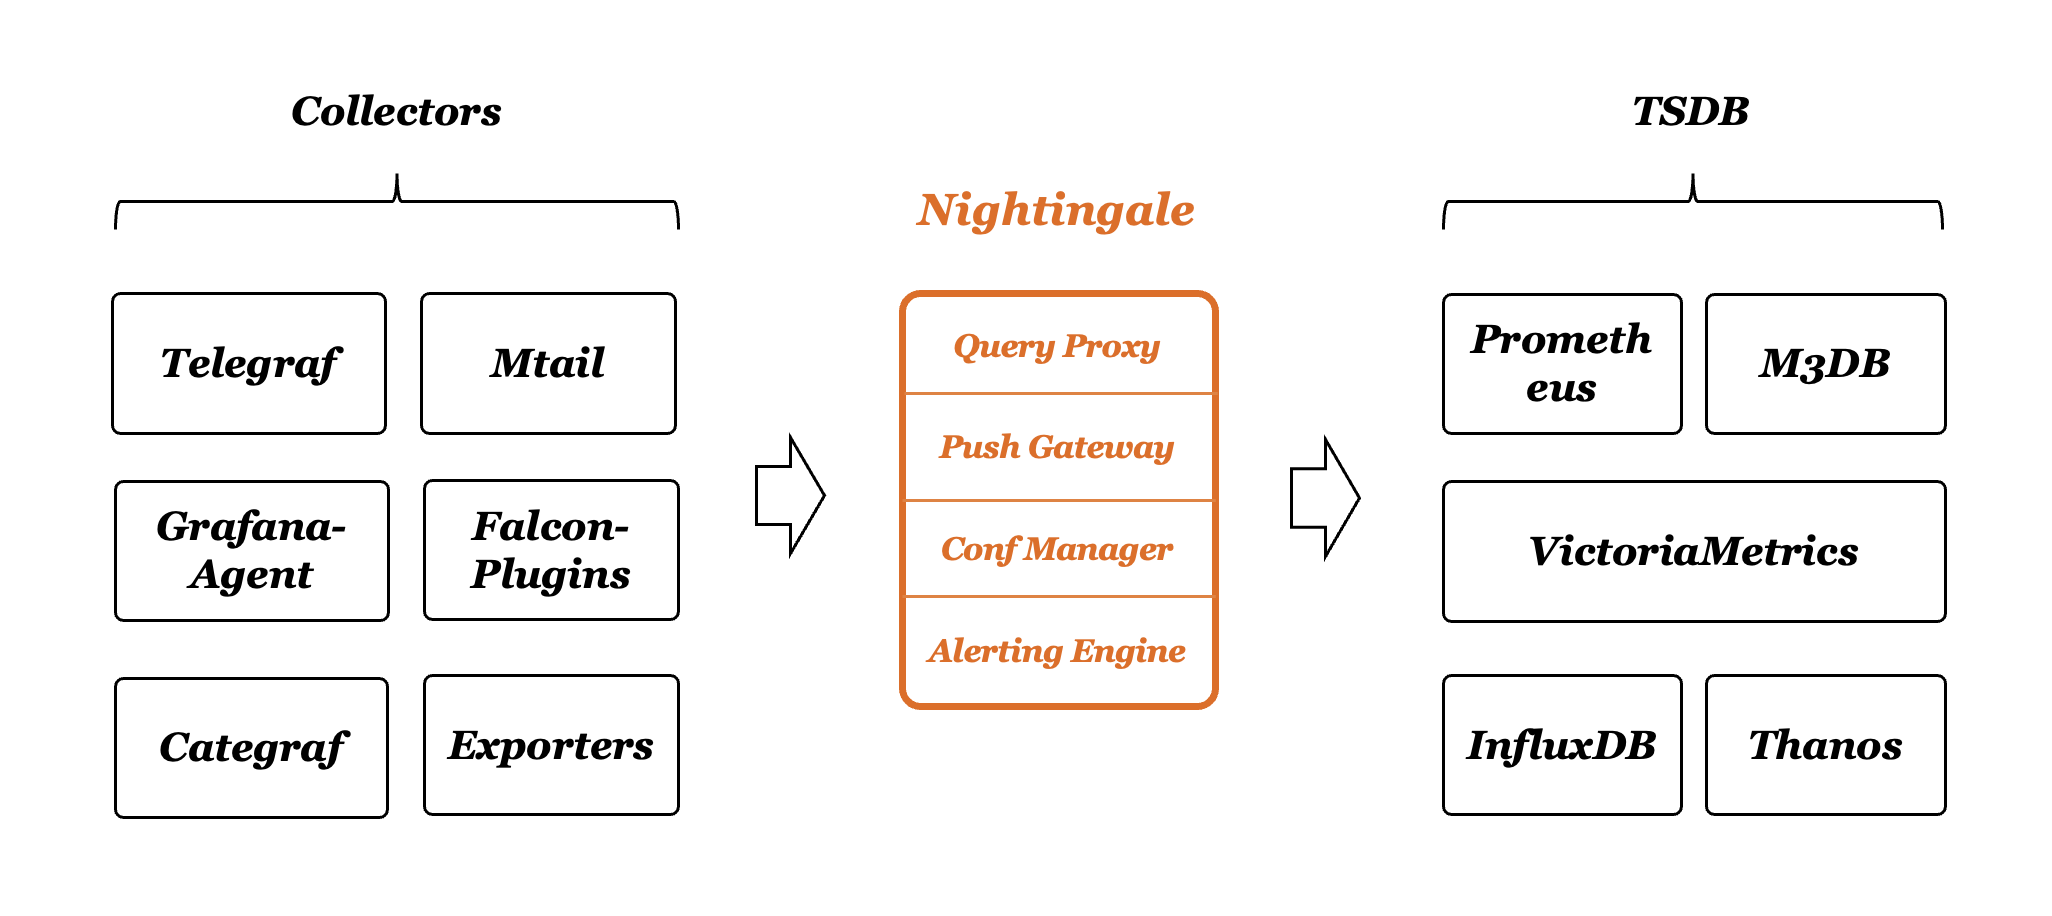
Nightingale 可以接收各种采集器上报的监控数据,转存到时序库(可以支持Prometheus、M3DB、VictoriaMetrics、Thanos等),并提供告警规则、屏蔽规则、订阅规则的配置能力,提供监控数据的查看能力,提供告警自愈机制(告警触发之后自动回调某个webhook地址或者执行某个脚本),提供历史告警事件的存储管理、分组查看的能力。
1.3系统架构
1.4产品对比
Zabbix
Zabbix 是一款老牌的监控系统,对机器和网络设备的监控覆盖很全,比如支持 AIX 系统,常见的开源监控都是支持 Linux、Windows,AIX 较少能够支持,Zabbix 用户群体广泛,国内很多公司基于 Zabbix 做商业化服务,不过 Zabbix 使用数据库做存储,容量有限,监控大盘不足,配置麻烦,服务器较多的话,很卡。
Open-Falcon
因为开发 Open-Falcon 和 Nightingale 的是一拨人,所以很多社区伙伴会比较好奇,为何要新做一个监控开源软件。核心点是 Open-Falcon 和 Nightingale 的差异点实在是太大了,Nightingale 并非是 Open-Falcon 设计逻辑的一个延续,就看做两个不同的软件就好。
Open-Falcon 是 14 年开发的,当时是想解决 Zabbix 的一些容量问题,可以看做是物理机时代的产物,整个设计偏向运维视角,虽然数据结构上已经开始设计了标签,但是查询语法还是比较简单,无法应对比较复杂的场景。
Nightingale 直接支持 PromQL,支持 Prometheus、M3DB、VictoriaMetrics 多种时序库,支持 Categraf、Telegraf、Datadog-Agent、Grafana-Agent 做监控数据采集,支持 Grafana 看图,整个设计更加云原生。
Prometheus
Nightingale 可以简单看做是 Prometheus 的一个企业级版本,把 Prometheus 当做 Nightingale 的一个内部组件(时序库)
Nightingale 可以接入多个 Prometheus,可以允许用户在页面上配置告警规则、屏蔽规则、订阅规则,在页面上查看告警事件、做告警事件聚合统计,配置告警自愈机制,管理监控对象,配置监控大盘等,就把 Nightingale 看做是 Prometheus 的一个 WEBUI 也是可以的,不过实际上,它远远不止是一个 WEBUI,用一下就会深有感触。
2.安装部署
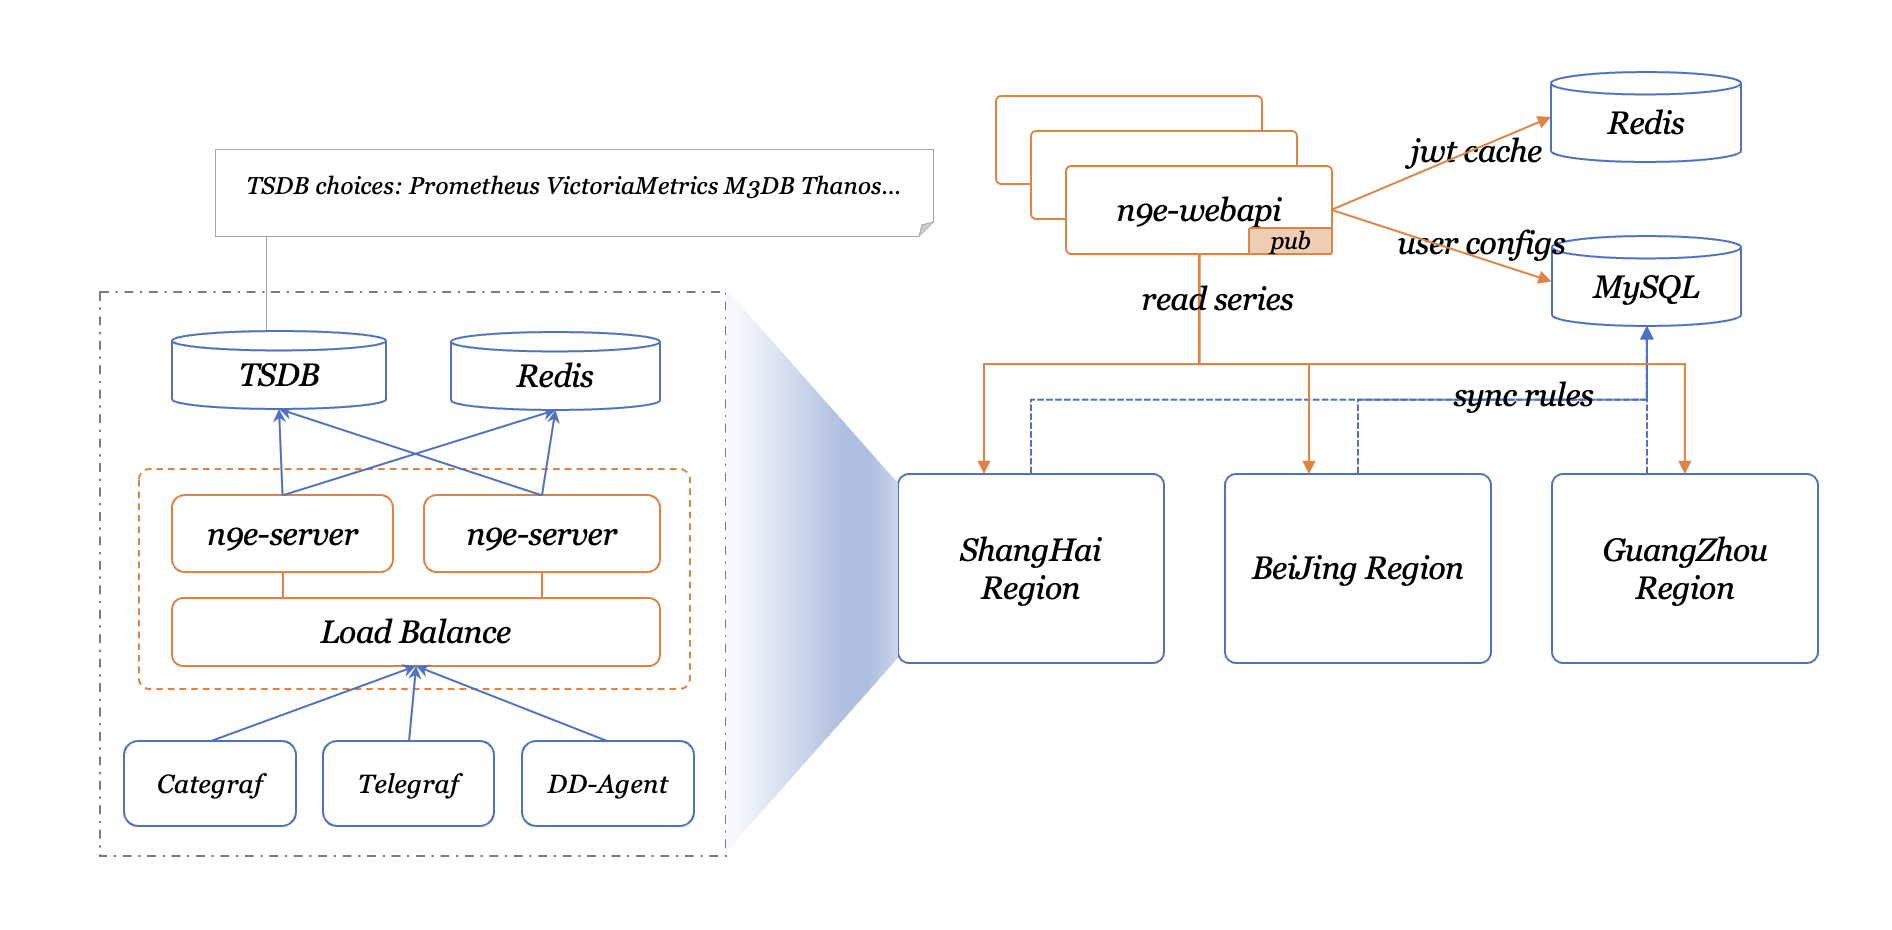
首先我们来看下面的架构图,夜莺的服务端有两个模块:n9e-webapi 和 n9e-server,n9e-webapi 用于提供 API 给前端 JavaScript 使用,n9e-server 的职责是告警引擎和数据转发器。依赖的组件有 MySQL、Redis、时序库,时序库我们这里使用 Prometheus。
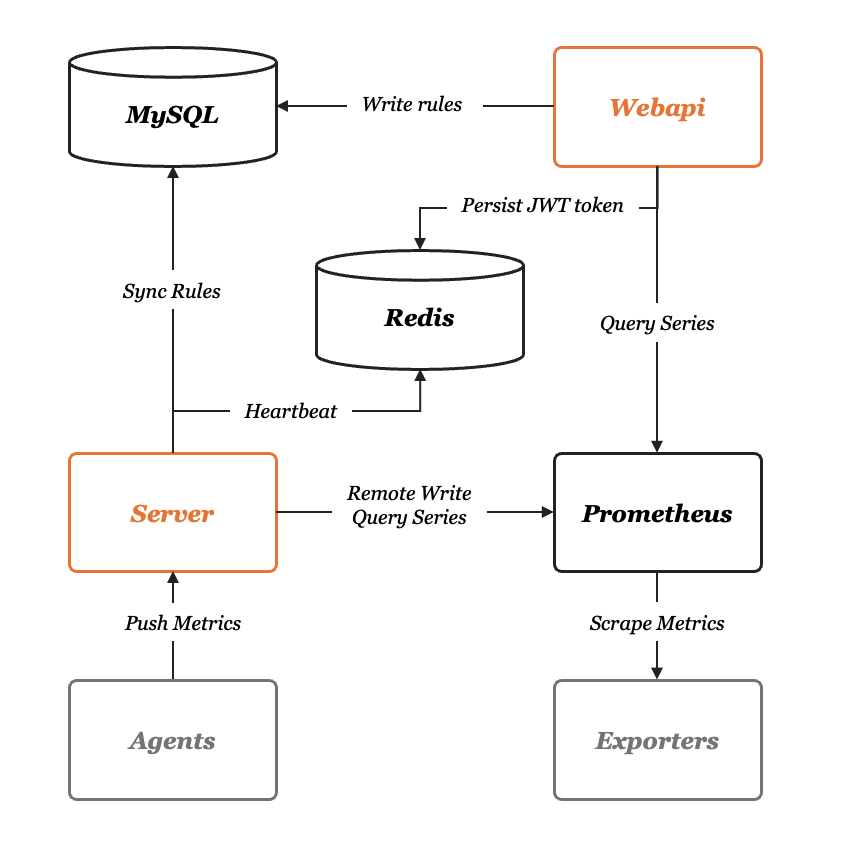
mysql、redis、prometheus,这三个组件都是开源软件,mysql、redis请大家自行安装,其中 prometheus 在启动的时候要注意开启 --enable-feature=remote-write-receiver ,如果已经有 Prometheus 了,也可以直接使用,无需再次部署。这里也提供一个小脚本来安装prometheus,大家可以参考
# install prometheus
mkdir -p /TRS/prometheus  && cd  /TRS/soft

wget  https://github.com/prometheus/prometheus/releases/download/v2.36.2/prometheus-2.36.2.linux-amd64.tar.gz
#如果不能kexue上网请手动上传
tar xf prometheus-2.36.2.linux-amd64.tar.gz
mv prometheus-2.36.2.linux-amd64/*  /TRS/prometheus/

# service
cat <<EOF >/etc/systemd/system/prometheus.service
[Unit]
Description="prometheus"
Documentation=https://prometheus.io/
After=network.target

[Service]
User=zwyuser
Type=simple

ExecStart=/TRS/prometheus/prometheus  --config.file=/TRS/prometheus/prometheus.yml --storage.tsdb.path=/TRS/prometheus/data --web.enable-lifecycle --enable-feature=remote-write-receiver --query.lookback-delta=2m
#>> /var/log/prometheus.log  2>&1"
Restart=on-failure
SuccessExitStatus=0
LimitNOFILE=65536
StandardOutput=syslog
StandardError=syslog
SyslogIdentifier=prometheus


[Install]
WantedBy=multi-user.target
EOF

chown -R zwyuser.zwyuser  /TRS/prometheus/
systemctl daemon-reload
systemctl enable prometheus
systemctl restart prometheus
systemctl status prometheus
journalctl  -u prometheus  #查看日志
#install  nightingale
mkdir -p /TRS/n9e && cd /TRS/n9e
wget https://www.gitlink.org.cn/api/attachments/389627
tar xf  389627  && rm -f 389627

#这里要改数据库密码
mysql -uroot -p1234 < docker/initsql/a-n9e.sql   SH1y6C5$l9o  aCj9n5NjgdCBr5wn

#更改配置文件
vim /TRS/n9e/etc/server.conf   vim /TRS/n9e/etc/webapi.conf
#这两个配置文件中药更改以下配置
[Redis]
Address = "127.0.0.1:6379"
Password = "zbb21"

RedisType = "standalone"

[DB]
DSN="root:z21521@tcp(127.0.0.1:3306)/n9e_v5?charset=utf8mb4&parseTime=True&loc=Local&allowNativePasswords=true"


#启动
#nohup ./n9e server &> server.log &
#nohup ./n9e webapi &> webapi.log &

cat <<EOF >/etc/systemd/system/n9e-server.service
[Unit]
Description="n9e-server"
After=network.target

[Service]
User=zwyuser
Type=simple

ExecStart=/TRS/n9e/n9e server
WorkingDirectory=/TRS/n9e

Restart=on-failure
SuccessExitStatus=0
LimitNOFILE=65536
StandardOutput=syslog
StandardError=syslog
SyslogIdentifier=n9e-server


[Install]
WantedBy=multi-user.target
EOF


cat <<EOF >/etc/systemd/system/n9e-webapi.service
[Unit]
Description="n9e-webapi"
After=network.target

[Service]
User=zwyuser
Type=simple

ExecStart=/TRS/n9e/n9e webapi
WorkingDirectory=/TRS/n9e

Restart=on-failure
SuccessExitStatus=0
LimitNOFILE=65536
StandardOutput=syslog
StandardError=syslog
SyslogIdentifier=n9e-webapi


[Install]
WantedBy=multi-user.target

EOF

chown zwyuser.zwyuser  /TRS/n9e/ -R
systemctl daemon-reload
systemctl enable n9e-server
systemctl enable n9e-webapi
systemctl restart n9e-server
systemctl restart n9e-webapi
如果启动成功,server 默认会监听在 19000 端口,webapi 会监听在 18000 端口
好了,浏览器访问 webapi 的端口(默认是18000)就可以体验相关功能了,默认用户是root,密码是root.2020
3.采集器
基本介绍
Categraf 是一款 all-in-one 的采集器,由 快猫团队 开源,代码托管在两个地方:
- gitlink: https://www.gitlink.org.cn/flashcat/categraf
- github: https://github.com/flashcatcloud/categraf
Categraf 不但可以采集 OS、MySQL、Redis、Oracle 等常见的监控对象,也准备提供日志采集能力和 trace 接收能力,这是夜莺主推的采集器,相关信息请查阅项目 README
Categraf 采集到数据之后,通过 remote write 协议推给远端存储,Nightingale 恰恰提供了 remote write 协议的数据接收接口,所以二者可以整合在一起,重点是配置 Categraf 的 conf/config.toml 中的 writer 部分,其中 url 部分配置为 n9e-server 的 remote write 接口:
[writer_opt]
# default: 2000
batch = 2000
# channel(as queue) size
chan_size = 10000

[[writers]]
url = "http://N9E-SERVER:19000/prometheus/v1/write"

# Basic auth username
basic_auth_user = ""

# Basic auth password
basic_auth_pass = ""

# timeout settings, unit: ms
timeout = 5000
dial_timeout = 2500
max_idle_conns_per_host = 100
对比
categraf 和 telegraf、exporters、grafana-agent、datadog-agent 等的关系是什么?
telegraf 是 influxdb 生态的产品,因为 influxdb 是支持字符串数据的,所以 telegraf 采集的很多 field 是字符串类型,另外 influxdb 的设计,允许 labels 是非稳态结构,比如 result_code 标签,有时其 value 是 0,有时其 value 是 1,在 influxdb 中都可以接受。但是上面两点,在类似 prometheus 的时序库中,处理起来就很麻烦。
prometheus 生态有各种 exporters,但是设计逻辑都是一个监控类型一个 exporter,甚至一个实例一个 exporter,生产环境可能会部署特别多的 exporters,管理起来略麻烦。
grafana-agent import 了大量 exporters 的代码,没有裁剪,没有优化,没有最佳实践在产品上的落地,有些中间件,仍然是一个 grafana-agent 一个目标实例,管理起来也很不方便。
datadog-agent确实是集大成者,但是大量代码是 python 的,整个发布包也比较大,有不少历史包袱,而且生态上是自成一派,和社区相对割裂。
安装
mkdir -p /TRS/categraf && cd /TRS/categraf
wget  https://www.gitlink.org.cn/api/attachments/389628
tar xf  389628  && rm -f 389628
mv   categraf-v0.1.9-linux-amd64/*   . && rm -rf categraf-v0.1.9-linux-amd64


cat <<EOF >/etc/systemd/system/categraf.service
[Unit]
Description="Categraf"
After=network.target

[Service]
User=zwyuser
Type=simple

ExecStart=/TRS/categraf/categraf
WorkingDirectory=/TRS/categraf

Restart=on-failure
SuccessExitStatus=0
LimitNOFILE=65536
StandardOutput=syslog
StandardError=syslog
SyslogIdentifier=categraf


[Install]
WantedBy=multi-user.target

EOF

chown -R  zwyuser.zwyuser  /TRS/categraf/
systemctl daemon-reload
systemctl enable categraf.service
systemctl restart categraf.service
4.监控项
4.1主机监控


4.2站点监控
 vim /TRS/categraf/conf/input.http_response/http_response.toml

[[instances]]
targets = [
    "https://c0",
    "https://www.baidu.com"
]

# # append some labels for series
labels = { region="cloud", product="n9e" }


4.3Mysql监控
vim /TRS/categraf/conf/input.mysql/mysql.toml

interval = 15
[[instances]]
address = "192.168.1.29:3308"
username = "root"
password = "qd30in"

labels = { instance="192.168.1.28:3308" }

4.4Redis监控
interval = 15

[[instances]]
address = "192.168.1.29:6379"
# username = ""
password = "xvTTFfZ2kV6LDc5yGz"
pool_size = 2
labels = { instance="192.168.1.29:6379" }

4.5服务监控
通过端口号判断服务是否存活
[[instances]]
targets = [
     "localhost:8080",
]

labels = { region="cloud", product="IIP" }


[[instances]]
targets = [
     "localhost:8280",
]

labels = { region="cloud", product="test" }

label_values(rabbitmq_identity_info, rabbitmq_cluster)
label_values(mysql_global_status_uptime, instance)
4.6rabbitmq监控
从 rabbitmq 3.8 版本开始,就内置了 prometheus 的支持,即,如果 rabbitmq 启用了 prometheus,可以直接暴露 metrics 接口,Categraf 从这个 metrics 接口拉取数据即可
rabbitmq 启用 prometheus 插件:
rabbitmq-plugins enable rabbitmq_prometheus
启用成功的话,rabbitmq 默认会在 15692 端口起监听,访问 http://localhost:15692/metrics 即可看到符合 prometheus 协议的监控数据。
[[instances]]
 urls = [
     "http://192.168.1.29:15692/metrics"
 ]

url_label_key = "instance"
url_label_value = "{{.Host}}"

## Scrape Services available in Consul Catalog
[instances.consul]
  enabled = false
  agent = "http://localhost:8500"
  query_interval = "5m"

  [[instances.consul.query]]
    name = "a service name"
    tag = "a service tag"
    url = 'http://{{if ne .ServiceAddress ""}}{{.ServiceAddress}}{{else}}{{.Address}}{{end}}:{{.ServicePort}}/{{with .ServiceMeta.metrics_path}}{{.}}{{
else}}metrics{{end}}'
    [instances.consul.query.tags]
      host = "{{.Node}}"

4.7监控ping
ping 监控插件,探测远端目标地址能否 ping 通,如果机器没有禁 ping,这就是一个很好用的探测机器存活的手段
要探测的机器配置到 targets 中,targets 是个数组,可以配置多个,当然也可以拆成多个 [[instances]] 配置段,比如:
[[instances]]
targets = [ "10.4.5.6" ]
labels = { region="cloud", product="n9e" }
[[instances]]
targets = [ "10.4.5.7" ]
labels = { region="cloud", product="zbx" }
上例中是 ping 两个地址,为了信息更丰富,附加了 region 和 product 标签
一般要使用ping命令需要加上
[Service]
...
CapabilityBoundingSet=CAP_NET_RAW
AmbientCapabilities=CAP_NET_RAW
...
4.8监控nginx-vts
1、下载模块
https://github.com/vozlt/nginx-module-vts/releases
2、编译
编译参数添加–add-module=/path/to/nginx-module-vts
3、替换现有bin文件
4、reload nginx
通过nginx -V来查看模块是否添加成功
        location /status {
        #allow  127.0.0.1;
        #deny all;
        vhost_traffic_status_display;
        vhost_traffic_status_display_format html;
        vhost_traffic_status_filter on;
        vhost_traffic_status_filter_by_set_key $status $server_name; #开启状态码统计
        vhost_traffic_status_filter_by_set_key $uri uris::$server_name; #开启url统计
        }
此外还有基于地理信息的统计,根据访问量或访问流量对nginx
做访问限制,详细使用见文档: https://github.com/vozlt/nginx-module-vts#installation
4.9监控zookeeper
注意: >=3.6.0 zookeeper 版本内置 prometheus 的支持,即,如果 zookeeper 启用了 prometheus,Categraf 可使用 prometheus 插件从这个 metrics 接口拉取数据即可;
移植于 dabealu/zookeeper-exporter,适用于 <3.6.0 版本的 zookeeper, 原理就是利用 Zookeper 提供的四字命令(The Four Letter Words)获取监控信息;
需要注意的是,在 zookeeper v3.4.10 以后添加了四字命令白名单,需要在 zookeeper 的配置文件 zoo.cfg 中新增白名单配置:
4lw.commands.whitelist=mntr,ruok
zookeeper 插件的配置在 conf/input.zookeeper/zookeeper.toml 集群中的多个实例地址请用空格分隔:
[[instances]]
cluster_name = "dev-zk-cluster"
addresses = "127.0.0.1:2181"
timeout = 10
如果要监控多个 zookeeper 集群,就增加 instances 即可:
[[instances]]
cluster_name = "dev-zk-cluster"
addresses = "127.0.0.1:2181"
timeout = 10
[[instances]]
cluster_name = "test-zk-cluster"
addresses = "127.0.0.1:2181 127.0.0.1:2182 127.0.0.1:2183"
timeout = 10

4.10监控ES
[root@trs28 input.elasticsearch]# systemctl  restart categraf.service
(reverse-i-search)`grep -': ^Cep -rn 'status'
[root@trs28 input.elasticsearch]# egrep  -v  "^#|^$"  elasticsearch.toml
interval = 15
[[instances]]
labels = { cluster="cloud-n9e-es" }
servers = ["http://localhost:9200"]
http_timeout = "5s"
local = true
cluster_health = true
cluster_health_level = "cluster"
cluster_stats = true
indices_level = ""
node_stats = ["jvm", "breaker", "process", "os", "fs", "indices","thread_pool","transport","http"]
num_most_recent_indices = 1
4.11自定义监控
vim   input.exec/exec.toml
# collect interval
 interval = 15

 [[instances]]
 # commands, support glob
 commands = [
     "/tmp/1.sh"
 ]

 # timeout for each command to complete
 timeout = 5

 # interval = global.interval * interval_times
 interval_times = 1

 # mesurement,labelkey1=labelval1,labelkey2=labelval2 field1=1.2,field2=2.3
 data_format = "influx"
#该插件用于给用户自定义监控脚本,脚本的输出格式支持两种,一种是 influx 格式,一种是 falcon 格式
#输出格式如下
filesize,directory="/home/gxslzy/" size=547754993374
5.告警

模版自带很多监控配置
可根据自定义KEY实现自定义监控
待补充
钉钉报警
新建用户


*在钉钉创建机器人,设置关键字认证方式,关键字填写 20

 浙公网安备 33010602011771号