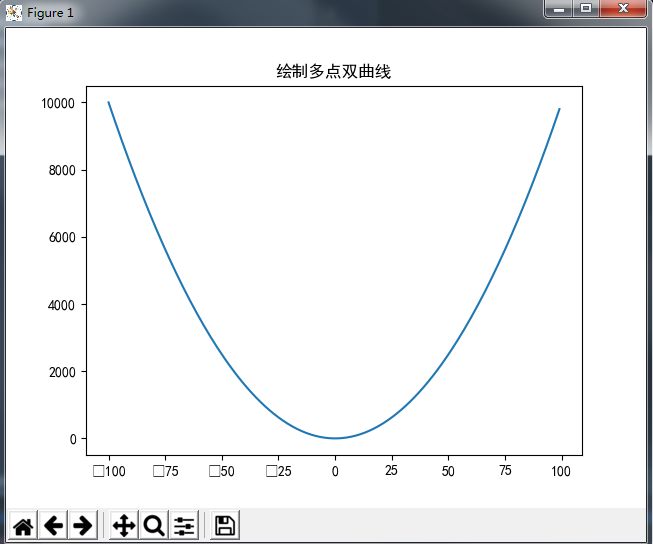
matplotlib 绘制曲线
import matplotlib.pyplot as plt

x = range(-100,100)
y = [i**2 for i in x]

plt.plot(x,y)
plt.rcParams['font.sans-serif'] = ['SimHei']
plt.title("绘制多点双曲线")
plt.savefig("result.jpg")
plt.show()
Time Will Tell
import matplotlib.pyplot as plt x = range(-100,100) y = [i**2 for i in x] plt.plot(x,y) plt.rcParams['font.sans-serif'] = ['SimHei'] plt.title("绘制多点双曲线") plt.savefig("result.jpg") plt.show()

 浙公网安备 33010602011771号