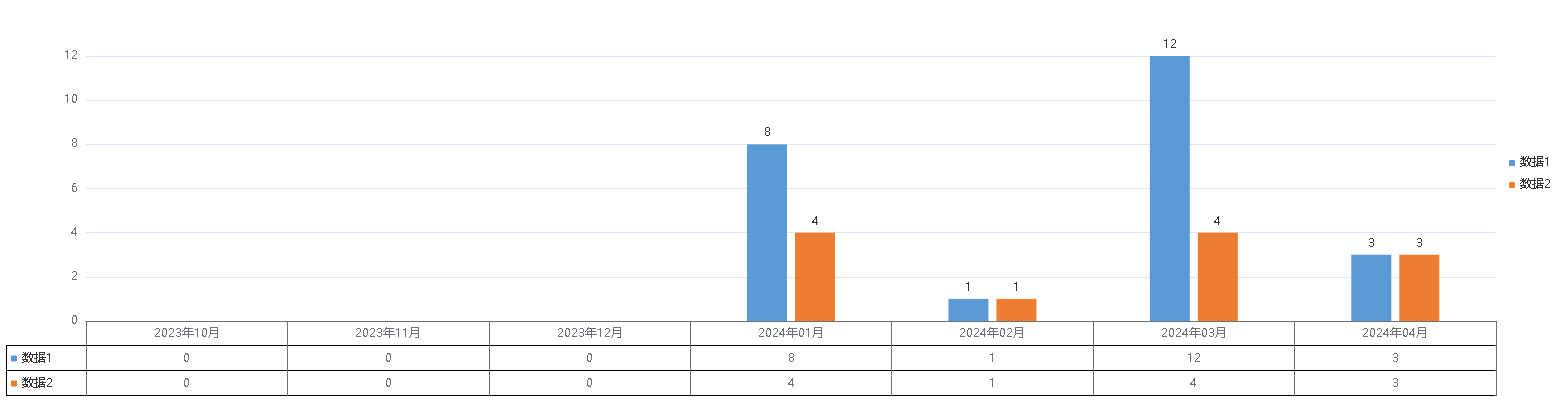
echarts 图表+表格实现上图下表

效果图:

1、结构布局

<div id="graphQuantityStatistics"></div>
2、配置图表
data () {
        return {
            option:{
                legend: [
                    {
                        left: 0,
                        bottom: -5,
                        width: 80,
                        orient: "vertical",
                        itemGap: 0,
                        itemWidth:6,
                        itemHeight:6,
                        textStyle: {
                            width: 80,
                            height: 25,
                            lineHeight: 56,
                            overflow: "truncate"
                        }
                    },
                    {
                        orient: 'vertical',
                        right:0,
                        bottom:'50%',
                        itemWidth:6,
                        itemHeight:6,
                    }
                ],
                grid: {
                    left: 80,
                    right: 60,
                    bottom: 75
                },
                backgroundColor: '#fff',
                tooltip: {
                    trigger: 'axis',
                },
                xAxis: [
                    {
                        type: 'category',
                        data: [],
                        axisTick: {
                            length: 75, // 竖线的长度
                        },
                        axisLine: {
                            lineStyle: {
                                type: 'solid',
                                /*color: 'blue'*/ // 更改坐标轴颜色
                            }
                        }
                    }
                ],
                yAxis: {
                    type: 'value',
                },
                graphic: [], //table
                series: [{
                    data: [],
                    name: "数据1",
                    type: 'bar',
                    yAxisIndex: 0,
                    label: {
                        show: true, position: 'top', formatter: function (params) {
                            if (params.value > 0) {
                                return params.value;
                            } else {
                                return '';
                            }
                        }
                    },
                    barMaxWidth: 40, // 最大宽度
                    itemStyle:{
                        color:'#5b9bd5'
                    },
                }, {
                    data: [],
                    name: '数据2',
                    type: 'bar',
                    label: {
                        show: true, position: 'top', formatter: function (params) {
                            if (params.value > 0) {
                                return params.value;
                            } else {
                                return '';
                            }
                        }
                    },
                    barMaxWidth: 40, // 最大宽度
                    itemStyle:{
                        color:'#ed7d31'
                    },
                }]
            },
            showEchartData:false
        };
    },
3、初始化图表
initChartCol(){
            let that = this;
            let lineList = this.getTableLine(4);//要渲染几条线写几
            lineList.push({
                type: 'line',
                bottom: 0,
                left: 0,
                style: {
                    fill: '#fff',
                    stroke: '#000'
                },
                shape: {
                    x1: 0,
                    y1: 0,
                    x2: 0,
                    y2: 50
                }
            })
            let x_api = “/getEchartsData.json”;
            that.http.get(x_api).then((res) => {
                let time = [];
                let ontologyStatistics = [];
                let graphStatistics = [];
                if(res.data && ((res.data.ontologyStatistics && res.data.ontologyStatistics.length>0) || (res.data.graphStatistics && res.data.graphStatistics.length>0))){
                    if(res.data.ontologyStatistics && res.data.ontologyStatistics.length>0){
                        res.data.ontologyStatistics.map((item)=>{
                            time.push(item.title);
                            ontologyStatistics.push(item.count);
                        })
                    }
                    if(res.data.graphStatistics && res.data.graphStatistics.length>0){
                        res.data.graphStatistics.map((item)=>{
                            if(time.length == 0){
                                time.push(item.title);
                            }
                            graphStatistics.push(item.count);
                        })
                    }
                    that.option.graphic = lineList;
                    that.option.xAxis[0].data = time;
                    that.option.series[0].data = ontologyStatistics;
                    that.option.series[1].data = graphStatistics;
                    that.option.xAxis[0].axisLabel = {
                        margin: 0,
                        interval: 0,
                        axisPointer: {
                            type: 'shadow'
                        },
                        formatter: function (value, index) {
                            var indexNum = 0
                            for (var i = 0; i < time.length; i++) {
                                if (value === time[i]) {
                                    indexNum = i
                                }
                            }
                            return ('{table|' + value + '}\n{table|' + ((ontologyStatistics.length > 0)?ontologyStatistics[indexNum]:0) + '}\n{table|' + (( graphStatistics.length > 0)?graphStatistics[indexNum]:0) + '}\n{table|' + '}')
                        },
                        rich: {
                            table: {
                                height: 25,
                                align: 'center',
                                verticalAlign: 'middle'
                            }
                        }
                    };
                    that.initEchart();
                }
            })
            .catch((err) => {
                that.$message.error(err.message)
            })
        },
        getTableLine(num){
            var list = [];
            var bottom = 75;//底部位置根据自己要求调整,我的理解是这的值应该设置 grid: { left: 60, right: 60, bottom: 90 }是90减30的一个值,
            var height = 25;
            for (var i = 1; i < num; i++) {
                list.push({
                    type: 'line',
                    bottom: bottom - i * height,
                    right: 60,
                    style: {
                        fill: '#fff',
                        stroke: '#000'
                    },
                    shape: {
                        x1: 0,
                        y1: 0,
                        x2: 9999,
                        y2: 0
                    }
                });
            }
            return list;
        },
        initEchart() {
            // 基于准备好的dom,初始化echarts实例
            let chartDom = document.getElementById('graphQuantityStatistics');
            let myChart = echarts.init(chartDom);
            // 绘制图表
            myChart.setOption(this.option,true);
            window.addEventListener("resize", () => {
                myChart.resize();
            });
        },
4、接口数据

{
  "code": "0",
  "data": {
    "graphStatistics": [
      {
        "count": 0,
        "title": "2023年10月",
        "type": null
      },
      {
        "count": 0,
        "title": "2023年11月",
        "type": null
      },
      {
        "count": 0,
        "title": "2023年12月",
        "type": null
      },
      {
        "count": 4,
        "title": "2024年01月",
        "type": null
      },
      {
        "count": 1,
        "title": "2024年02月",
        "type": null
      },
      {
        "count": 4,
        "title": "2024年03月",
        "type": null
      },
      {
        "count": 3,
        "title": "2024年04月",
        "type": null
      }
    ],
    "ontologyStatistics": [
      {
        "count": 0,
        "title": "2023年10月",
        "type": null
      },
      {
        "count": 0,
        "title": "2023年11月",
        "type": null
      },
      {
        "count": 0,
        "title": "2023年12月",
        "type": null
      },
      {
        "count": 8,
        "title": "2024年01月",
        "type": null
      },
      {
        "count": 1,
        "title": "2024年02月",
        "type": null
      },
      {
        "count": 12,
        "title": "2024年03月",
        "type": null
      },
      {
        "count": 3,
        "title": "2024年04月",
        "type": null
      }
    ]
  },
  "message": "success"
}

posted @ 2024-04-27 16:10  我爱敲代码0000  阅读(60)  评论(0编辑  收藏  举报