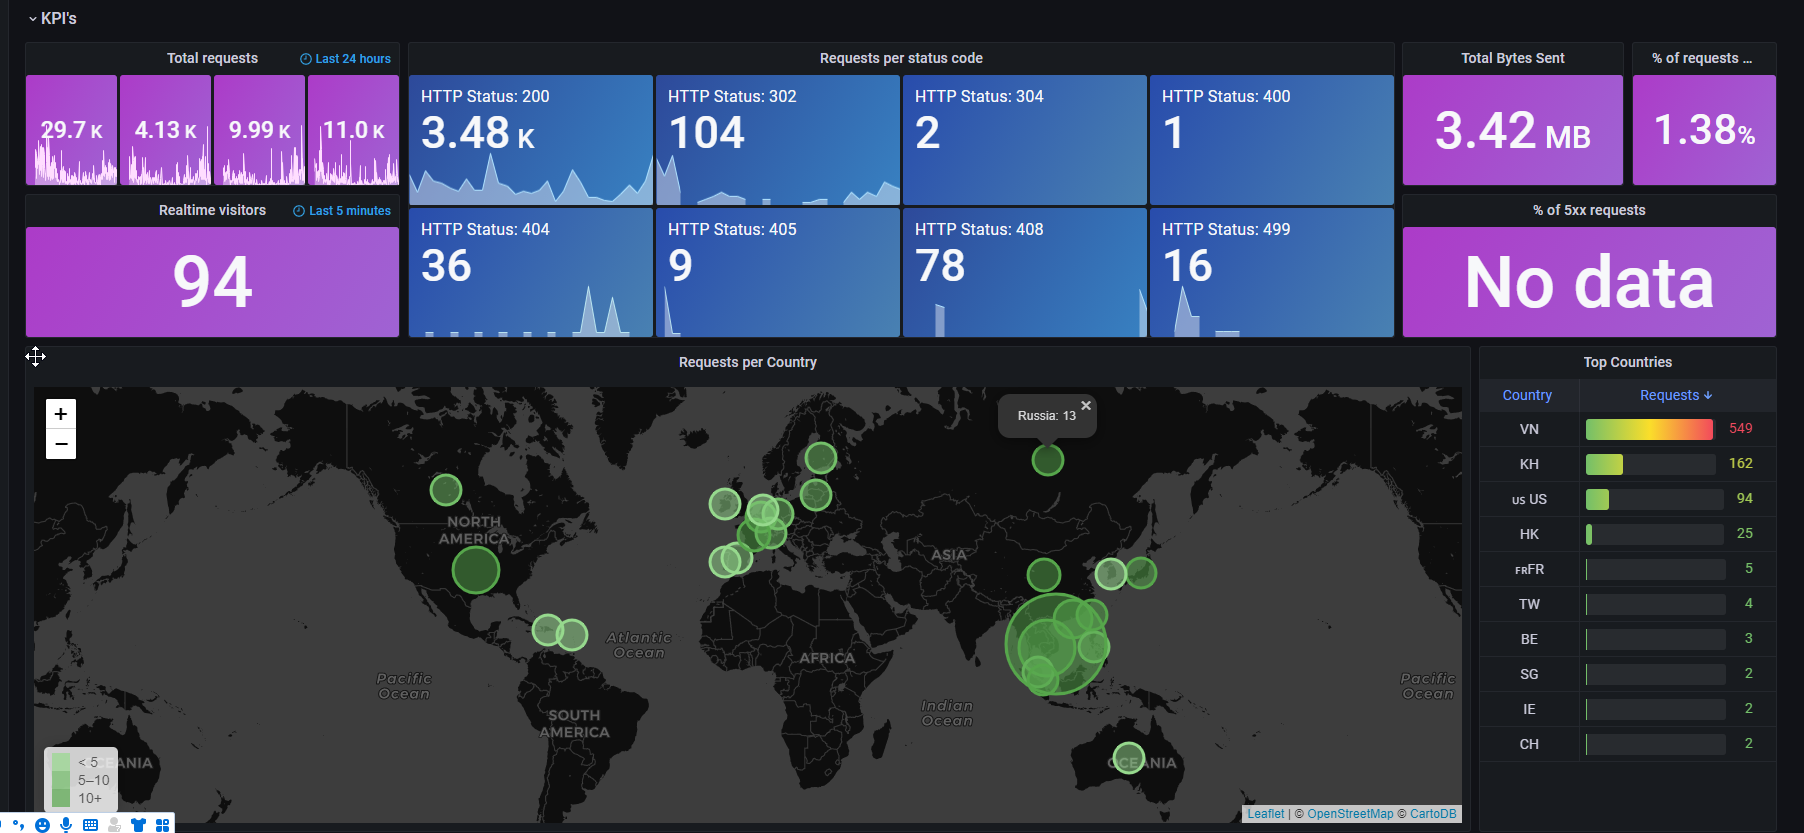
【监控】grafana+loki做nginx_log服务
0、环境
centos7
grafana8.0
loki2.2.1
curl -O -L "https://github.com/grafana/loki/releases/download/v2.2.1/loki-linux-amd64.zip"
promtail 2.2.1
1、安装grafana
cat >> /etc/yum.repos.d/grafana.repo << EOF
[grafana]
name=grafana
baseurl=https://packages.grafana.com/enterprise/rpm
repo_gpgcheck=1
enabled=1
gpgcheck=1
gpgkey=https://packages.grafana.com/gpg.key
sslverify=1
sslcacert=/etc/pki/tls/certs/ca-bundle.crtwe
[grafana]
name=grafana
baseurl=https://packages.grafana.com/oss/rpm
repo_gpgcheck=1
enabled=1
gpgcheck=1
gpgkey=https://packages.grafana.com/gpg.key
sslverify=1
sslcacert=/etc/pki/tls/certs/ca-bundle.crt
EOF
yum install grafana
grafana-cli plugins install grafana-worldmap-panel
systemctl restart grafana
import 模板 12559
2、安装loki2.0.2
unzip loki-linux-amd64.zip
mkdir -p /usr/local/loki/{chunks,index}
vim loki.yml
auth_enabled: false
server:
http_listen_port: 3100
ingester:
lifecycler:
address: 192.168.34.3
ring:
kvstore:
store: inmemory
replication_factor: 1
final_sleep: 0s
chunk_idle_period: 5m
chunk_retain_period: 30s
schema_config:
configs:
- from: 2020-07-21
store: boltdb
object_store: filesystem
schema: v11
index:
prefix: index_
period: 168h
#每张表的时间范围6天
storage_config:
boltdb:
directory: /data/loki/index
#索引文件存储地址
filesystem:
directory: /data/loki/chunks
#块存储地址
limits_config:
enforce_metric_name: false
reject_old_samples: true
reject_old_samples_max_age: 168h
chunk_store_config:
# 最大可查询历史日期 90天
max_look_back_period: 2160h
# 表的保留期90天
table_manager:
retention_deletes_enabled: true
retention_period: 672h
./loki-linux-amd64 -config.file=/usr/local/loki/loki.yml
3、安装配置promtail
unzip promtail-linux-amd64.zip
mkdir -p /usr/local/promtail
cat > /usr/local/promtail/promtail.yaml << EOF
server:
http_listen_port: 0
grpc_listen_port: 0
positions:
filename: /tmp/positions.yaml
clients:
- url: http://45.117.160.27:3100/loki/api/v1/push
scrape_configs:
- job_name: nginx
static_configs:
- targets:
- 103.153.254.31
labels:
job: nginx_access_log
host: proxy-4-vn
agent: promtail
__path__: /www/wwwlogs/*.json.log
EOF
nohup ./promtail-linux-amd64 -config.file=/usr/local/promtail/promtail.yaml &
4、安装配置nginx
cat > /etc/yum.repos.d/nginx.repo << EOF
[nginx-stable]
name=nginx stable repo
baseurl=http://nginx.org/packages/centos/$releasever/$basearch/
gpgcheck=1
enabled=1
gpgkey=https://nginx.org/keys/nginx_signing.key
module_hotfixes=true
[nginx-mainline]
name=nginx mainline repo
baseurl=http://nginx.org/packages/mainline/centos/$releasever/$basearch/
gpgcheck=1
enabled=0
gpgkey=https://nginx.org/keys/nginx_signing.key
module_hotfixes=true
EOF
yum search nginx-module
yum install nginx-module-* rh-nginx
vim /etc/nginx/nginx.conf
# 添加
geoip_country /usr/local/GeoIP/GeoIP.dat;
geoip_city /usr/local/GeoIP/GeoCity.dat
# http {} 中
log_format json_analytics escape=json '{'
'"msec": "$msec", ' # request unixtime in seconds with a milliseconds resolution
'"connection": "$connection", ' # connection serial number
'"connection_requests": "$connection_requests", ' # number of requests made in connection
'"pid": "$pid", ' # process pid
'"request_id": "$request_id", ' # the unique request id
'"request_length": "$request_length", ' # request length (including headers and body)
'"remote_addr": "$remote_addr", ' # client IP
'"remote_user": "$remote_user", ' # client HTTP username
'"remote_port": "$remote_port", ' # client port
'"time_local": "$time_local", '
'"time_iso8601": "$time_iso8601", ' # local time in the ISO 8601 standard format
'"request": "$request", ' # full path no arguments if the request
'"request_uri": "$request_uri", ' # full path and arguments if the request
'"args": "$args", ' # args
'"status": "$status", ' # response status code
'"body_bytes_sent": "$body_bytes_sent", ' # the number of body bytes exclude headers sent to a client
'"bytes_sent": "$bytes_sent", ' # the number of bytes sent to a client
'"http_referer": "$http_referer", ' # HTTP referer
'"http_user_agent": "$http_user_agent", ' # user agent
'"http_x_forwarded_for": "$http_x_forwarded_for", ' # http_x_forwarded_for
'"http_host": "$http_host", ' # the request Host: header
'"server_name": "$server_name", ' # the name of the vhost serving the request
'"request_time": "$request_time", ' # request processing time in seconds with msec resolution
'"upstream": "$upstream_addr", ' # upstream backend server for proxied requests
'"upstream_connect_time": "$upstream_connect_time", ' # upstream handshake time incl. TLS
'"upstream_header_time": "$upstream_header_time", ' # time spent receiving upstream headers
'"upstream_response_time": "$upstream_response_time", ' # time spend receiving upstream body
'"upstream_response_length": "$upstream_response_length", ' # upstream response length
'"upstream_cache_status": "$upstream_cache_status", ' # cache HIT/MISS where applicable
'"ssl_protocol": "$ssl_protocol", ' # TLS protocol
'"ssl_cipher": "$ssl_cipher", ' # TLS cipher
'"scheme": "$scheme", ' # http or https
'"request_method": "$request_method", ' # request method
'"server_protocol": "$server_protocol", ' # request protocol, like HTTP/1.1 or HTTP/2.0
'"pipe": "$pipe", ' # "p" if request was pipelined, "." otherwise
'"gzip_ratio": "$gzip_ratio", '
'"http_cf_ray": "$http_cf_ray",'
'"geoip_country_code": "$geoip_country_code"'
'}';
# access log 添加
access_log /www/wwwlogs/web.yostat.xyz.json.log json_analytics;
/usr/local/nginx/sbin/nginx -s reload
5、自定义模板
{
"annotations": {
"list": [
{
"builtIn": 1,
"datasource": "-- Grafana --",
"enable": true,
"hide": true,
"iconColor": "rgba(0, 211, 255, 1)",
"name": "Annotations & Alerts",
"type": "dashboard"
}
]
},
"description": "Loki v2+ showcase using JSON NGINX access logs.",
"editable": true,
"gnetId": 12559,
"graphTooltip": 0,
"id": 3,
"iteration": 1624354604449,
"links": [],
"panels": [
{
"collapsed": false,
"datasource": null,
"gridPos": {
"h": 1,
"w": 24,
"x": 0,
"y": 0
},
"id": 36,
"panels": [],
"title": "Request statistics over time real",
"type": "row"
},
{
"datasource": "$datasource",
"description": "",
"fieldConfig": {
"defaults": {
"color": {
"mode": "palette-classic"
},
"custom": {
"axisLabel": "",
"axisPlacement": "auto",
"barAlignment": 0,
"drawStyle": "line",
"fillOpacity": 100,
"gradientMode": "hue",
"hideFrom": {
"legend": false,
"tooltip": false,
"viz": false
},
"lineInterpolation": "smooth",
"lineWidth": 1,
"pointSize": 5,
"scaleDistribution": {
"log": 2,
"type": "log"
},
"showPoints": "never",
"spanNulls": false,
"stacking": {
"group": "A",
"mode": "none"
},
"thresholdsStyle": {
"mode": "area"
}
},
"mappings": [],
"thresholds": {
"mode": "absolute",
"steps": [
{
"color": "green",
"value": null
},
{
"color": "#EAB839",
"value": 0.2
},
{
"color": "red",
"value": 0.3
}
]
},
"unit": "s"
},
"overrides": [
{
"matcher": {
"id": "byName",
"options": "95th percentile"
},
"properties": [
{
"id": "color",
"value": {
"fixedColor": "blue",
"mode": "fixed"
}
}
]
},
{
"matcher": {
"id": "byName",
"options": "max latency"
},
"properties": [
{
"id": "color",
"value": {
"fixedColor": "super-light-blue",
"mode": "fixed"
}
}
]
},
{
"matcher": {
"id": "byName",
"options": "max latency"
},
"properties": [
{
"id": "custom.fillOpacity",
"value": 30
}
]
}
]
},
"gridPos": {
"h": 9,
"w": 8,
"x": 0,
"y": 1
},
"id": 16,
"interval": null,
"maxDataPoints": 50,
"options": {
"legend": {
"calcs": [],
"displayMode": "list",
"placement": "bottom"
},
"tooltip": {
"mode": "single"
}
},
"pluginVersion": "8.0.0-beta3",
"targets": [
{
"expr": "quantile_over_time(0.95,{$label_name=~\"$label_value\", job=~\"$job\", instance=~\"$instance\"} | json | unwrap request_time | __error__=\"\" [$__interval]) by (host)",
"legendFormat": "95th percentile",
"refId": "C"
},
{
"expr": "max by (host) (max_over_time({$label_name=~\"$label_value\", job=~\"$job\", instance=~\"$instance\"} | json | unwrap request_time | __error__=\"\" [$__interval]))",
"legendFormat": "max latency",
"refId": "D"
}
],
"timeFrom": null,
"timeShift": null,
"title": "95th percentile of Request Time",
"type": "timeseries"
},
{
"datasource": "$datasource",
"description": "",
"fieldConfig": {
"defaults": {
"color": {
"mode": "palette-classic"
},
"custom": {
"axisLabel": "",
"axisPlacement": "auto",
"barAlignment": 0,
"drawStyle": "line",
"fillOpacity": 39,
"gradientMode": "hue",
"hideFrom": {
"legend": false,
"tooltip": false,
"viz": false
},
"lineInterpolation": "smooth",
"lineWidth": 1,
"pointSize": 5,
"scaleDistribution": {
"log": 2,
"type": "log"
},
"showPoints": "never",
"spanNulls": true,
"stacking": {
"group": "A",
"mode": "none"
},
"thresholdsStyle": {
"mode": "off"
}
},
"decimals": 0,
"mappings": [],
"thresholds": {
"mode": "absolute",
"steps": [
{
"color": "green",
"value": null
},
{
"color": "red",
"value": 80
}
]
},
"unit": "short"
},
"overrides": [
{
"matcher": {
"id": "byName",
"options": "HTTP Status 500"
},
"properties": [
{
"id": "color",
"value": {
"fixedColor": "dark-orange",
"mode": "fixed"
}
}
]
},
{
"matcher": {
"id": "byName",
"options": "{statuscode=\"200\"} 200"
},
"properties": [
{
"id": "color",
"value": {
"fixedColor": "green",
"mode": "fixed"
}
}
]
},
{
"matcher": {
"id": "byName",
"options": "{statuscode=\"404\"} 404"
},
"properties": [
{
"id": "color",
"value": {
"fixedColor": "semi-dark-purple",
"mode": "fixed"
}
}
]
},
{
"matcher": {
"id": "byName",
"options": "{statuscode=\"500\"} 500"
},
"properties": [
{
"id": "color",
"value": {
"fixedColor": "dark-red",
"mode": "fixed"
}
}
]
},
{
"matcher": {
"id": "byName",
"options": "HTTP Status 404"
},
"properties": [
{
"id": "color",
"value": {
"fixedColor": "light-orange",
"mode": "fixed"
}
}
]
},
{
"matcher": {
"id": "byName",
"options": "HTTP Status 301"
},
"properties": [
{
"id": "color",
"value": {
"fixedColor": "light-blue",
"mode": "fixed"
}
}
]
},
{
"matcher": {
"id": "byName",
"options": "HTTP Status 200"
},
"properties": [
{
"id": "color",
"value": {
"fixedColor": "semi-dark-blue",
"mode": "fixed"
}
}
]
}
]
},
"gridPos": {
"h": 9,
"w": 8,
"x": 8,
"y": 1
},
"id": 2,
"interval": null,
"maxDataPoints": 50,
"options": {
"legend": {
"calcs": [],
"displayMode": "list",
"placement": "bottom"
},
"tooltip": {
"mode": "single"
}
},
"pluginVersion": "8.0.0-beta3",
"targets": [
{
"expr": "sum by (status) (count_over_time({$label_name=~\"$label_value\", job=~\"$job\", instance=~\"$instance\"} | json | __error__=\"\" [$__interval]))",
"legendFormat": "HTTP Status {{status}}",
"refId": "A"
}
],
"timeFrom": null,
"timeShift": null,
"title": "HTTP status codes over time",
"transformations": [
{
"id": "filterFieldsByName",
"options": {
"include": {
"names": [
"Time",
"HTTP Status 200",
"HTTP Status 301",
"HTTP Status 304",
"HTTP Status 404",
"HTTP Status 406",
"HTTP Status 500"
]
}
}
}
],
"type": "timeseries"
},
{
"datasource": "$datasource",
"description": "",
"fieldConfig": {
"defaults": {
"color": {
"mode": "palette-classic"
},
"custom": {
"axisLabel": "",
"axisPlacement": "auto",
"barAlignment": 0,
"drawStyle": "line",
"fillOpacity": 100,
"gradientMode": "hue",
"hideFrom": {
"legend": false,
"tooltip": false,
"viz": false
},
"lineInterpolation": "smooth",
"lineWidth": 1,
"pointSize": 5,
"scaleDistribution": {
"type": "linear"
},
"showPoints": "never",
"spanNulls": false,
"stacking": {
"group": "A",
"mode": "none"
},
"thresholdsStyle": {
"mode": "off"
}
},
"mappings": [],
"thresholds": {
"mode": "absolute",
"steps": [
{
"color": "green",
"value": null
},
{
"color": "red",
"value": 80
}
]
},
"unit": "decbytes"
},
"overrides": [
{
"matcher": {
"id": "byName",
"options": "Bytes sent"
},
"properties": [
{
"id": "color",
"value": {
"fixedColor": "light-blue",
"mode": "fixed"
}
}
]
},
{
"matcher": {
"id": "byName",
"options": "appfelstrudel"
},
"properties": [
{
"id": "color",
"value": {
"fixedColor": "yellow",
"mode": "fixed"
}
}
]
}
]
},
"gridPos": {
"h": 9,
"w": 8,
"x": 16,
"y": 1
},
"id": 9,
"interval": null,
"maxDataPoints": 50,
"options": {
"legend": {
"calcs": [],
"displayMode": "list",
"placement": "bottom"
},
"tooltip": {
"mode": "single"
}
},
"pluginVersion": "8.0.0-beta3",
"targets": [
{
"expr": "sum by (host) (sum_over_time({$label_name=~\"$label_value\", job=~\"$job\", instance=~\"$instance\"} | json | status=200 | unwrap body_bytes_sent | __error__=\"\" [$__interval]))",
"legendFormat": "Bytes sent",
"refId": "A"
}
],
"timeFrom": null,
"timeShift": null,
"title": "Bytes Sent",
"transformations": [],
"type": "timeseries"
},
{
"datasource": "$datasource",
"description": "",
"fieldConfig": {
"defaults": {
"color": {
"mode": "thresholds"
},
"custom": {
"align": null,
"displayMode": "auto",
"filterable": false
},
"mappings": [],
"thresholds": {
"mode": "absolute",
"steps": [
{
"color": "green",
"value": null
},
{
"color": "red",
"value": 80
}
]
}
},
"overrides": [
{
"matcher": {
"id": "byName",
"options": "Requests"
},
"properties": [
{
"id": "custom.displayMode",
"value": "gradient-gauge"
},
{
"id": "color",
"value": {
"mode": "continuous-BlPu"
}
}
]
},
{
"matcher": {
"id": "byName",
"options": "Requests"
},
"properties": [
{
"id": "custom.width",
"value": 300
}
]
}
]
},
"gridPos": {
"h": 6,
"w": 9,
"x": 0,
"y": 10
},
"id": 6,
"interval": null,
"maxDataPoints": 1,
"options": {
"showHeader": true,
"sortBy": [
{
"desc": true,
"displayName": "Requests"
}
]
},
"pluginVersion": "8.0.3",
"targets": [
{
"expr": "topk(10, sum by (http_referer) (count_over_time({$label_name=~\"$label_value\", job=~\"$job\", instance=~\"$instance\"} | json | http_referer != \"\" and http_referer !~ \".*?$host.*?\" and http_referer !~ \".*?\\\\*\\\\*\\\\*.*?\" | __error__=\"\" [15m])))",
"instant": true,
"legendFormat": "{{http_referer}}",
"range": false,
"refId": "A"
}
],
"timeFrom": "15m",
"timeShift": null,
"title": "Top 10 HTTP Referers",
"transformations": [
{
"id": "organize",
"options": {
"excludeByName": {
"Time": true
},
"indexByName": {},
"renameByName": {
"Field": "Referer",
"Total": "Requests",
"Value #A": "Requests",
"http_referer": "HTTP Referrer"
}
}
}
],
"type": "table"
},
{
"datasource": "$datasource",
"description": "",
"fieldConfig": {
"defaults": {
"color": {
"mode": "thresholds"
},
"custom": {
"align": null,
"displayMode": "auto",
"filterable": false
},
"mappings": [],
"thresholds": {
"mode": "absolute",
"steps": [
{
"color": "green",
"value": null
},
{
"color": "red",
"value": 80
}
]
}
},
"overrides": [
{
"matcher": {
"id": "byName",
"options": "Requests"
},
"properties": [
{
"id": "custom.width",
"value": 300
},
{
"id": "custom.displayMode",
"value": "gradient-gauge"
},
{
"id": "color",
"value": {
"mode": "continuous-BlPu"
}
}
]
},
{
"matcher": {
"id": "byName",
"options": "User agent"
},
"properties": [
{
"id": "custom.width",
"value": null
}
]
}
]
},
"gridPos": {
"h": 6,
"w": 15,
"x": 9,
"y": 10
},
"id": 7,
"interval": null,
"maxDataPoints": 1,
"options": {
"showHeader": true,
"sortBy": [
{
"desc": true,
"displayName": "Requests"
}
]
},
"pluginVersion": "8.0.3",
"targets": [
{
"expr": "topk(10, sum by (http_user_agent) (count_over_time({$label_name=~\"$label_value\", job=~\"$job\", instance=~\"$instance\"} | json | __error__=\"\" [15m])))",
"instant": true,
"legendFormat": "{{http_user_agent}}",
"range": false,
"refId": "A"
}
],
"timeFrom": "15m",
"timeShift": null,
"title": "Top 10 User Agents",
"transformations": [
{
"id": "organize",
"options": {
"excludeByName": {
"Field": false,
"Time": true
},
"indexByName": {},
"renameByName": {
"Field": "Agent",
"Total": "Requests",
"Value #A": "Requests",
"http_user_agent": "User agent"
}
}
}
],
"type": "table"
},
{
"datasource": "$datasource",
"description": "",
"fieldConfig": {
"defaults": {
"color": {
"mode": "thresholds"
},
"custom": {
"align": null,
"displayMode": "auto",
"filterable": false
},
"mappings": [
{
"options": {
"NL": {
"index": 1,
"text": "🇳🇱"
},
"US": {
"index": 0,
"text": "🇺🇸"
}
},
"type": "value"
}
],
"thresholds": {
"mode": "absolute",
"steps": [
{
"color": "green",
"value": null
},
{
"color": "red",
"value": 80
}
]
}
},
"overrides": [
{
"matcher": {
"id": "byName",
"options": "Requests"
},
"properties": [
{
"id": "custom.width",
"value": 300
},
{
"id": "custom.displayMode",
"value": "gradient-gauge"
},
{
"id": "color",
"value": {
"mode": "continuous-BlPu"
}
}
]
},
{
"matcher": {
"id": "byName",
"options": "Country"
},
"properties": [
{
"id": "custom.width",
"value": 74
}
]
}
]
},
"gridPos": {
"h": 8,
"w": 9,
"x": 0,
"y": 16
},
"id": 3,
"interval": null,
"maxDataPoints": 1,
"options": {
"showHeader": true,
"sortBy": [
{
"desc": true,
"displayName": "Requests"
}
]
},
"pluginVersion": "8.0.3",
"targets": [
{
"expr": "topk(10, sum by (remote_addr, geoip_country_code) (count_over_time({$label_name=~\"$label_value\", job=~\"$job\", instance=~\"$instance\"} | json | __error__=\"\" [15m])))",
"instant": true,
"legendFormat": "{{remote_addr}}",
"range": false,
"refId": "A"
}
],
"timeFrom": "15m",
"timeShift": null,
"title": "Top 10 visitor IPs",
"transformations": [
{
"id": "organize",
"options": {
"excludeByName": {
"Field": false,
"Time": true
},
"indexByName": {
"Time": 0,
"Value #A": 3,
"geoip_country_code": 2,
"remote_addr": 1
},
"renameByName": {
"Field": "IP Address",
"Total": "Requests",
"Value #A": "Requests",
"geoip_country_code": "Country",
"remote_addr": "IP Address "
}
}
}
],
"type": "table"
},
{
"datasource": "$datasource",
"description": "",
"fieldConfig": {
"defaults": {
"color": {
"mode": "thresholds"
},
"custom": {
"align": null,
"displayMode": "auto",
"filterable": false
},
"mappings": [],
"thresholds": {
"mode": "absolute",
"steps": [
{
"color": "green",
"value": null
},
{
"color": "red",
"value": 80
}
]
}
},
"overrides": [
{
"matcher": {
"id": "byName",
"options": "Requests"
},
"properties": [
{
"id": "custom.width",
"value": 300
},
{
"id": "custom.displayMode",
"value": "gradient-gauge"
},
{
"id": "color",
"value": {
"mode": "continuous-BlPu"
}
}
]
}
]
},
"gridPos": {
"h": 8,
"w": 15,
"x": 9,
"y": 16
},
"id": 12,
"interval": null,
"maxDataPoints": 1,
"options": {
"showHeader": true,
"sortBy": [
{
"desc": true,
"displayName": "Requests"
}
]
},
"pluginVersion": "8.0.3",
"targets": [
{
"expr": "topk(10, sum by (request_uri) (count_over_time({$label_name=~\"$label_value\", job=~\"$job\", instance=~\"$instance\"} !~ `\\.ico|\\.svg|\\.css|\\.png|\\.txt|\\.js|\\.xml` | json | status = 200 and request_uri != \"/\" | __error__=\"\" [15m])))",
"instant": true,
"legendFormat": "{{request_uri}}",
"range": false,
"refId": "A"
}
],
"timeFrom": "15m",
"timeShift": null,
"title": "Top 10 Requested Pages",
"transformations": [
{
"id": "organize",
"options": {
"excludeByName": {
"Time": true
},
"indexByName": {},
"renameByName": {
"Field": "Page",
"Time": "",
"Total": "",
"Value #A": "Requests",
"request_uri": "Path"
}
}
}
],
"type": "table"
},
{
"datasource": null,
"description": "",
"fieldConfig": {
"defaults": {
"color": {
"mode": "thresholds"
},
"custom": {
"align": "auto",
"displayMode": "auto"
},
"mappings": [],
"thresholds": {
"mode": "absolute",
"steps": [
{
"color": "green",
"value": null
},
{
"color": "red",
"value": 80
}
]
}
},
"overrides": [
{
"matcher": {
"id": "byName",
"options": "Rquests Time(s)"
},
"properties": [
{
"id": "custom.displayMode",
"value": "gradient-gauge"
},
{
"id": "color",
"value": {
"mode": "continuous-BlPu"
}
},
{
"id": "custom.width",
"value": 302
}
]
},
{
"matcher": {
"id": "byName",
"options": "Rquests Time(s)"
},
"properties": [
{
"id": "custom.width",
"value": 300
}
]
}
]
},
"gridPos": {
"h": 7,
"w": 9,
"x": 0,
"y": 24
},
"id": 38,
"libraryPanel": {
"description": "",
"meta": {
"connectedDashboards": 1,
"created": "2021-06-22T14:25:09+07:00",
"createdBy": {
"avatarUrl": "/avatar/46d229b033af06a191ff2267bca9ae56",
"id": 1,
"name": "admin"
},
"folderName": "General",
"folderUid": "",
"updated": "2021-06-22T14:40:01+07:00",
"updatedBy": {
"avatarUrl": "/avatar/46d229b033af06a191ff2267bca9ae56",
"id": 1,
"name": "admin"
}
},
"name": "Top10 Request Slow Time",
"type": "table",
"uid": "1a96zrRnz",
"version": 3
},
"options": {
"showHeader": true,
"sortBy": [
{
"desc": true,
"displayName": "Rquests Time(s)"
}
]
},
"pluginVersion": "8.0.3",
"targets": [
{
"expr": "topk(10, sum by (http_referer) (max_over_time({$label_name=~\"$label_value\", job=~\"$job\", instance=~\"$instance\"} | json | unwrap request_time | http_referer != \"\" and http_referer !~ \".*?$host.*?\" and http_referer !~ \".*?\\\\*\\\\*\\\\*.*?\" | __error__=\"\" [15m])))",
"instant": true,
"legendFormat": "{{ http_referer }}",
"range": false,
"refId": "A"
}
],
"title": "Top10 Request Slow Time",
"transformations": [
{
"id": "organize",
"options": {
"excludeByName": {
"Time": true
},
"indexByName": {},
"renameByName": {
"Value #A": "Rquests Time(s)",
"http_referer": "HTTP Referrer"
}
}
}
],
"type": "table"
},
{
"datasource": null,
"fieldConfig": {
"defaults": {
"color": {
"mode": "thresholds"
},
"custom": {
"align": "auto",
"displayMode": "auto"
},
"mappings": [],
"thresholds": {
"mode": "absolute",
"steps": [
{
"color": "green",
"value": null
},
{
"color": "red",
"value": 80
}
]
}
},
"overrides": [
{
"matcher": {
"id": "byName",
"options": "Request Time(s)"
},
"properties": [
{
"id": "custom.displayMode",
"value": "gradient-gauge"
},
{
"id": "color",
"value": {
"mode": "continuous-BlYlRd"
}
}
]
},
{
"matcher": {
"id": "byName",
"options": "Request Time(s)"
},
"properties": [
{
"id": "custom.width",
"value": 300
}
]
}
]
},
"gridPos": {
"h": 7,
"w": 15,
"x": 9,
"y": 24
},
"id": 40,
"options": {
"showHeader": true,
"sortBy": [
{
"desc": true,
"displayName": "Request Time(s)"
}
]
},
"pluginVersion": "8.0.3",
"targets": [
{
"expr": "sum by (request) (max_over_time({filename=~\"/www/wwwlogs/api\\\\.yostat\\\\.xyz\\\\.json\\\\.log\", job=~\"nginx_access_log\", instance=~\"\"} | json | unwrap request_time | request != \"\" and request !~ \".*version.*\" | __error__=\"\" [15m]))",
"instant": true,
"legendFormat": "{{ request }}",
"range": false,
"refId": "A"
}
],
"title": "Requests Slow Go Http",
"transformations": [
{
"id": "organize",
"options": {
"excludeByName": {
"Time": true
},
"indexByName": {},
"renameByName": {
"Value #A": "Request Time(s)",
"request": "Request"
}
}
}
],
"type": "table"
},
{
"collapsed": false,
"datasource": "$datasource",
"gridPos": {
"h": 1,
"w": 24,
"x": 0,
"y": 31
},
"id": 24,
"panels": [],
"title": "KPI's",
"type": "row"
},
{
"datasource": "$datasource",
"description": "",
"fieldConfig": {
"defaults": {
"color": {
"mode": "thresholds"
},
"mappings": [],
"thresholds": {
"mode": "absolute",
"steps": [
{
"color": "purple",
"value": null
}
]
},
"unit": "short"
},
"overrides": []
},
"gridPos": {
"h": 4,
"w": 5,
"x": 0,
"y": 32
},
"hideTimeOverride": false,
"id": 4,
"interval": null,
"maxDataPoints": 300,
"options": {
"colorMode": "background",
"graphMode": "area",
"justifyMode": "center",
"orientation": "auto",
"reduceOptions": {
"calcs": [
"sum"
],
"fields": "",
"values": false
},
"text": {},
"textMode": "value"
},
"pluginVersion": "8.0.3",
"targets": [
{
"expr": "sum by(host) (count_over_time({$label_name=~\"$label_value\", job=~\"$job\", instance=~\"$instance\"}[$__interval])) ",
"legendFormat": "",
"refId": "A"
}
],
"timeFrom": "24h",
"timeShift": null,
"title": "Total requests ",
"transformations": [],
"type": "stat"
},
{
"datasource": "$datasource",
"description": "",
"fieldConfig": {
"defaults": {
"color": {
"mode": "thresholds"
},
"mappings": [],
"thresholds": {
"mode": "percentage",
"steps": [
{
"color": "rgba(110, 157, 228, 0.76)",
"value": null
},
{
"color": "rgba(73, 124, 202, 1)",
"value": 20
}
]
},
"unit": "short"
},
"overrides": []
},
"gridPos": {
"h": 8,
"w": 13,
"x": 5,
"y": 32
},
"id": 5,
"interval": null,
"maxDataPoints": 20,
"options": {
"colorMode": "background",
"graphMode": "area",
"justifyMode": "auto",
"orientation": "auto",
"reduceOptions": {
"calcs": [
"sum"
],
"fields": "",
"values": false
},
"text": {},
"textMode": "auto"
},
"pluginVersion": "8.0.3",
"targets": [
{
"expr": "sum by (status) (count_over_time({$label_name=~\"$label_value\", job=~\"$job\", instance=~\"$instance\"} | json | __error__=\"\" [$__interval]))",
"instant": false,
"legendFormat": "HTTP Status: {{status}}",
"range": true,
"refId": "A"
}
],
"timeFrom": null,
"timeShift": null,
"title": "Requests per status code",
"transformations": [],
"type": "stat"
},
{
"datasource": "$datasource",
"description": "",
"fieldConfig": {
"defaults": {
"color": {
"mode": "thresholds"
},
"mappings": [],
"thresholds": {
"mode": "absolute",
"steps": [
{
"color": "purple",
"value": null
}
]
},
"unit": "decbytes"
},
"overrides": []
},
"gridPos": {
"h": 4,
"w": 3,
"x": 18,
"y": 32
},
"id": 8,
"interval": null,
"maxDataPoints": 1,
"options": {
"colorMode": "background",
"graphMode": "none",
"justifyMode": "center",
"orientation": "auto",
"reduceOptions": {
"calcs": [
"sum"
],
"fields": "",
"values": false
},
"text": {},
"textMode": "value"
},
"pluginVersion": "8.0.3",
"targets": [
{
"expr": "sum by (host) (sum_over_time({$label_name=~\"$label_value\", job=~\"$job\", instance=~\"$instance\"} | json | unwrap body_bytes_sent | __error__=\"\" [$__interval]))",
"instant": true,
"legendFormat": "Bytes sent",
"range": false,
"refId": "A"
}
],
"timeFrom": null,
"timeShift": null,
"title": "Total Bytes Sent",
"transformations": [],
"type": "stat"
},
{
"cacheTimeout": null,
"datasource": "$datasource",
"description": "",
"fieldConfig": {
"defaults": {
"color": {
"mode": "thresholds"
},
"mappings": [],
"max": 100,
"min": 0,
"thresholds": {
"mode": "absolute",
"steps": [
{
"color": "purple",
"value": null
}
]
},
"unit": "percent"
},
"overrides": []
},
"gridPos": {
"h": 4,
"w": 2,
"x": 21,
"y": 32
},
"hideTimeOverride": true,
"id": 18,
"interval": "10m",
"links": [],
"maxDataPoints": 1,
"options": {
"colorMode": "background",
"graphMode": "none",
"justifyMode": "auto",
"orientation": "auto",
"reduceOptions": {
"calcs": [
"last"
],
"fields": "",
"values": false
},
"text": {},
"textMode": "value"
},
"pluginVersion": "8.0.3",
"targets": [
{
"expr": "sum(count_over_time(({$label_name=~\"$label_value\", job=~\"$job\", instance=~\"$instance\"} |= \"Googlebot\")[$__interval])) / (sum(count_over_time(({$label_name=~\"$label_value\", job=~\"$job\", instance=~\"$instance\"} != \"Googlebot\")[$__interval])) / 100)",
"instant": true,
"legendFormat": "",
"range": false,
"refId": "A"
}
],
"timeFrom": "1h",
"timeShift": null,
"title": "% of requests by Googlebot",
"type": "stat"
},
{
"datasource": "$datasource",
"description": "",
"fieldConfig": {
"defaults": {
"color": {
"mode": "thresholds"
},
"mappings": [],
"thresholds": {
"mode": "absolute",
"steps": [
{
"color": "purple",
"value": null
}
]
}
},
"overrides": []
},
"gridPos": {
"h": 4,
"w": 5,
"x": 0,
"y": 36
},
"id": 22,
"interval": "5m",
"options": {
"colorMode": "background",
"graphMode": "none",
"justifyMode": "auto",
"orientation": "auto",
"reduceOptions": {
"calcs": [
"mean"
],
"fields": "",
"values": false
},
"text": {},
"textMode": "value"
},
"pluginVersion": "8.0.3",
"targets": [
{
"expr": "count(sum by (remote_addr) (count_over_time({$label_name=~\"$label_value\", job=~\"$job\", instance=~\"$instance\"} | json | __error__=\"\" [$__interval])))",
"instant": true,
"legendFormat": "",
"range": false,
"refId": "A"
}
],
"timeFrom": "5m",
"timeShift": null,
"title": "Realtime visitors ",
"transformations": [],
"type": "stat"
},
{
"cacheTimeout": null,
"datasource": "$datasource",
"description": "",
"fieldConfig": {
"defaults": {
"color": {
"mode": "thresholds"
},
"decimals": 1,
"mappings": [],
"max": 100,
"min": 0,
"thresholds": {
"mode": "absolute",
"steps": [
{
"color": "purple",
"value": null
},
{
"color": "red",
"value": 80
}
]
},
"unit": "percent"
},
"overrides": []
},
"gridPos": {
"h": 4,
"w": 5,
"x": 18,
"y": 36
},
"hideTimeOverride": true,
"id": 19,
"interval": null,
"links": [],
"maxDataPoints": 1,
"options": {
"colorMode": "background",
"graphMode": "none",
"justifyMode": "center",
"orientation": "auto",
"reduceOptions": {
"calcs": [
"max"
],
"fields": "",
"values": false
},
"text": {},
"textMode": "value"
},
"pluginVersion": "8.0.3",
"targets": [
{
"expr": "sum(count_over_time({$label_name=~\"$label_value\", job=~\"$job\", instance=~\"$instance\"} | json | status >= 500 |__error__=\"\"[$__interval])) / (sum(count_over_time({$label_name=~\"$label_value\", job=~\"$job\", instance=~\"$instance\"} | json | __error__=\"\"[$__interval]))/ 100)",
"instant": false,
"legendFormat": "",
"range": true,
"refId": "A"
}
],
"timeFrom": "1h",
"timeShift": null,
"title": "% of 5xx requests ",
"type": "stat"
},
{
"circleMaxSize": "50",
"circleMinSize": "15",
"colors": [
"#96D98D",
"#73BF69",
"#56A64B"
],
"datasource": "$datasource",
"decimals": null,
"description": "",
"esMetric": "Count",
"gridPos": {
"h": 13,
"w": 19,
"x": 0,
"y": 40
},
"hideEmpty": false,
"hideZero": false,
"id": 14,
"initialZoom": "2",
"interval": null,
"locationData": "countries",
"mapCenter": "(0°, 0°)",
"mapCenterLatitude": 0,
"mapCenterLongitude": 0,
"maxDataPoints": 1,
"mouseWheelZoom": false,
"pluginVersion": "7.4.0",
"showLegend": true,
"stickyLabels": true,
"tableQueryOptions": {
"geohashField": "geohash",
"latitudeField": "latitude",
"longitudeField": "longitude",
"metricField": "metric",
"queryType": "geohash"
},
"targets": [
{
"expr": "sum by (geoip_country_code) (count_over_time({$label_name=~\"$label_value\", job=~\"$job\", instance=~\"$instance\"} | json | geoip_country_code != \"\" | __error__=\"\" [$__interval]))",
"instant": false,
"legendFormat": "{{geoip_country_code}}",
"range": true,
"refId": "A"
}
],
"thresholds": "5,10",
"timeFrom": null,
"timeShift": null,
"title": "Requests per Country",
"transformations": [],
"type": "grafana-worldmap-panel",
"unitPlural": "",
"unitSingle": "",
"valueName": "total"
},
{
"datasource": "$datasource",
"description": "",
"fieldConfig": {
"defaults": {
"color": {
"mode": "thresholds"
},
"custom": {
"align": "center",
"displayMode": "auto",
"filterable": false
},
"mappings": [
{
"options": {
"CN": {
"color": "transparent",
"index": 4,
"text": "🇨🇳CN"
},
"DE": {
"color": "transparent",
"index": 2,
"text": "🇩🇪DE"
},
"FR": {
"color": "transparent",
"index": 3,
"text": "🇫🇷FR"
},
"GB": {
"color": "transparent",
"index": 7,
"text": "🇬🇧GB"
},
"IN": {
"color": "transparent",
"index": 5,
"text": "🇮🇳IN"
},
"IT": {
"color": "transparent",
"index": 6,
"text": "🇮🇹IT"
},
"NL": {
"color": "transparent",
"index": 1,
"text": "🇳🇱NL"
},
"US": {
"color": "transparent",
"index": 0,
"text": "🇺🇸 US"
}
},
"type": "value"
}
],
"thresholds": {
"mode": "percentage",
"steps": [
{
"color": "transparent",
"value": null
}
]
}
},
"overrides": [
{
"matcher": {
"id": "byName",
"options": "Requests"
},
"properties": [
{
"id": "custom.displayMode",
"value": "gradient-gauge"
},
{
"id": "color",
"value": {
"mode": "continuous-GrYlRd"
}
}
]
},
{
"matcher": {
"id": "byName",
"options": "Country"
},
"properties": [
{
"id": "custom.width",
"value": 100
}
]
},
{
"matcher": {
"id": "byName",
"options": "Requests"
},
"properties": [
{
"id": "custom.width",
"value": 200
}
]
}
]
},
"gridPos": {
"h": 13,
"w": 4,
"x": 19,
"y": 40
},
"hideTimeOverride": true,
"id": 32,
"interval": null,
"maxDataPoints": 1,
"options": {
"showHeader": true,
"sortBy": [
{
"desc": true,
"displayName": "Requests"
}
]
},
"pluginVersion": "8.0.3",
"targets": [
{
"expr": "topk(10, sum by (geoip_country_code) (count_over_time({$label_name=~\"$label_value\", job=~\"$job\", instance=~\"$instance\"} | json | geoip_country_code != \"\" and __error__=\"\" [$__interval])))",
"instant": true,
"legendFormat": "{{remote_addr}}",
"maxLines": null,
"range": false,
"refId": "A"
}
],
"timeFrom": "15m",
"timeShift": null,
"title": "Top Countries",
"transformations": [
{
"id": "organize",
"options": {
"excludeByName": {
"Field": false,
"Time": true,
"Value #A": false
},
"indexByName": {
"Time": 0,
"Value #A": 3,
"geoip_country_code": 2,
"remote_addr": 1
},
"renameByName": {
"Field": "IP Address",
"Total": "Requests",
"Value #A": "Requests",
"geoip_country_code": "Country",
"remote_addr": "IP Address "
}
}
}
],
"type": "table"
},
{
"datasource": "$datasource",
"description": "",
"gridPos": {
"h": 5,
"w": 23,
"x": 0,
"y": 53
},
"id": 11,
"options": {
"dedupStrategy": "signature",
"enableLogDetails": false,
"showLabels": false,
"showTime": false,
"sortOrder": "Descending",
"wrapLogMessage": false
},
"targets": [
{
"expr": "{$label_name=~\"$label_value\", job=~\"$job\", instance=~\"$instance\"} | json | line_format \"➡️ {{.request_method}} {{.request_uri}} with HTTP status: {{.status}} \"",
"legendFormat": "",
"refId": "A"
}
],
"timeFrom": null,
"timeShift": null,
"title": "Recent requests",
"transformations": [],
"type": "logs"
}
],
"refresh": "",
"schemaVersion": 30,
"style": "dark",
"tags": [],
"templating": {
"list": [
{
"current": {
"selected": false,
"text": "Loki",
"value": "Loki"
},
"description": null,
"error": null,
"hide": 0,
"includeAll": false,
"label": "Datasource",
"multi": false,
"name": "datasource",
"options": [],
"query": "loki",
"queryValue": "",
"refresh": 1,
"regex": "",
"skipUrlSync": false,
"type": "datasource"
},
{
"allValue": null,
"current": {
"selected": false,
"text": "filename",
"value": "filename"
},
"datasource": "$datasource",
"definition": "label_names()",
"description": null,
"error": null,
"hide": 0,
"includeAll": false,
"label": "Label Name",
"multi": false,
"name": "label_name",
"options": [],
"query": "label_names()",
"refresh": 1,
"regex": "",
"skipUrlSync": false,
"sort": 1,
"tagValuesQuery": "",
"tagsQuery": "",
"type": "query",
"useTags": false
},
{
"allValue": null,
"current": {
"selected": true,
"text": [
"All"
],
"value": [
"$__all"
]
},
"datasource": "$datasource",
"definition": "label_values($label_name)",
"description": null,
"error": null,
"hide": 0,
"includeAll": true,
"label": "Label Value",
"multi": true,
"name": "label_value",
"options": [],
"query": "label_values($label_name)",
"refresh": 1,
"regex": "",
"skipUrlSync": false,
"sort": 1,
"tagValuesQuery": "",
"tagsQuery": "",
"type": "query",
"useTags": false
},
{
"allValue": null,
"current": {
"selected": true,
"text": [
"All"
],
"value": [
"$__all"
]
},
"datasource": "$datasource",
"definition": "label_values({$label_name=~\"$label_value\"}, job)",
"description": null,
"error": null,
"hide": 0,
"includeAll": true,
"label": "Job",
"multi": true,
"name": "job",
"options": [],
"query": "label_values({$label_name=~\"$label_value\"}, job)",
"refresh": 1,
"regex": "",
"skipUrlSync": false,
"sort": 0,
"tagValuesQuery": "",
"tagsQuery": "",
"type": "query",
"useTags": false
},
{
"allValue": null,
"current": {
"selected": true,
"text": [
"All"
],
"value": [
"$__all"
]
},
"datasource": "$datasource",
"definition": "label_values({$label_name=~\"$label_value\"}, instance)",
"description": null,
"error": null,
"hide": 0,
"includeAll": true,
"label": "Instance",
"multi": true,
"name": "instance",
"options": [],
"query": "label_values({$label_name=~\"$label_value\"}, instance)",
"refresh": 1,
"regex": "",
"skipUrlSync": false,
"sort": 0,
"tagValuesQuery": "",
"tagsQuery": "",
"type": "query",
"useTags": false
},
{
"datasource": "$datasource",
"description": null,
"error": null,
"filters": [],
"hide": 0,
"label": null,
"name": "Filters",
"skipUrlSync": false,
"type": "adhoc"
}
]
},
"time": {
"from": "now-6h",
"to": "now"
},
"timepicker": {
"refresh_intervals": [
"10s",
"30s",
"1m",
"5m",
"15m",
"30m",
"1h",
"2h",
"1d"
]
},
"timezone": "Asia/Bangkok",
"title": "Grafana Loki Dashboard for NGINX Service Mesh",
"uid": "EqSs2wR7z",
"version": 22
}

 浙公网安备 33010602011771号