
Flowchart of SCFT iteration
Within the standard framework of SCFT,
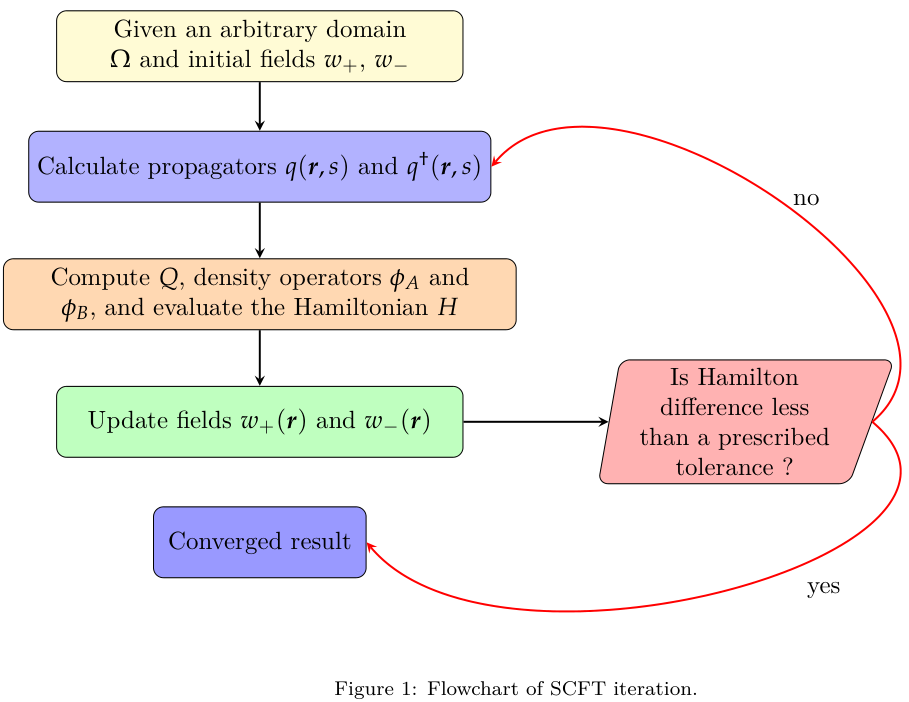
finding the stationary states requires the self-consistent iterative procedure, as shown in the following flowchart.
\begin{figure}[H]
	\begin{center}
		\label{fig:scftiter}
		\tikzstyle{startstop} = [rectangle, rounded corners, minimum width=3cm, minimum height=1cm, text centered, text width=5.5cm, draw=black, fill=yellow!20]
		\tikzstyle{io} = [rectangle, rounded  corners,minimum width=4cm,minimum height=1cm,text centered,draw=black,fill=blue!30]
		\tikzstyle{ioo} = [rectangle, rounded  corners,minimum width=3cm,minimum height=1cm,text centered,draw=black,fill=blue!40]
		\tikzstyle{process1} = [rectangle, rounded  corners, minimum width=3cm,minimum height=1cm,text width=7cm, text centered,draw=black,fill=orange!30]
		\tikzstyle{process2} = [rectangle, rounded  corners, minimum width=3cm,minimum height=1cm,text width=5.5cm, text centered,draw=black,fill=green!25]
		\tikzstyle{decision} = [trapezium, trapezium left angle=80, trapezium right angle=110, rounded corners, minimum width=3cm,minimum height=1cm,text centered,text width=3cm, draw=black,fill=red!30]
		\tikzstyle{arrow} = [thick=50cm,->,>=stealth]
		\begin{tikzpicture}[node distance=1.7cm]
		minimum	\node (start) [startstop] {Given an arbitrary domain $\Omega$ and initial fields $w_+$, $w_{-}$};
		\node (input1) [io,below of=start] {Calculate propagators $q(\br,s)$ and $q^\dag(\br, s)$};
		\node (process1) [process1,below of=input1,yshift=-0.1cm] {Compute $Q$, density operators $\phi_A$ and $\phi_B$, and evaluate the Hamiltonian $H$};
		\node (process2) [process2,below of=process1,yshift=-0.1cm] {Update fields $w_+(\br)$ and $w_-(\br)$};
		\node (decision) [decision,right of =process2,xshift=5cm] {Is Hamilton difference less than a prescribed tolerance ?};
		\node (out1) [ioo,below of=process2] {Converged result};
		\draw [arrow] (start) -- (input1);
		\draw [arrow] (input1) -- (process1);
		\draw [arrow] (process1) -- (process2);
		\draw [arrow,draw=red,thick=3cm] (decision.east) to [out=-400,in=-50] node [right=1cm]{yes} (out1.east);
		\draw [arrow,draw=red] (decision.east) to [ out=400,in=50]node[right=0.1cm]{no} (input1.east);
		\draw [arrow] (process2) -- (decision);
		\end{tikzpicture}
	\end{center}
	\vspace{-1.0cm}
	\caption{Flowchart of SCFT iteration.}
\end{figure}

 浙公网安备 33010602011771号