
可视化图表工具库--GoJS
1.GoJS简介
GoJS是Northwoods Software的产品。Northwoods Software创立于1995年,专注于交互图控件和类库。旗下四款产品:
| GoJS | 用于在HTML上创建交互图的纯javaSCript库 |
| GoDiagram | 用于WinForms的.NET图控件。 |
| GoXam | 用于WPF/Silverlight的图控件。( Silverlight是一个跨浏览器的、跨平台的插件, 与flash竞争的富客户端技术) |
| JGo | 用于Swing/SWT中创建交互图的java库 |
1.1 GoJS可以做什么?
GoJS是一个实现交互类可视化图表(比如流程图,柱状图 ,线形图 ,树图,关系图, 蜡烛图 ,力导图,决策树 ,思维导图,管道图,进度图等等)的JS库。GoJS为用户交互提供了许多高级功能,如拖放,删除,复制和粘贴,撤销与重做,文本编辑,工具提示,上下文菜单,自动布局,数据绑定和模型,事务状态和撤销管理,事件处理程序,命令以及用于自定义操作的可扩展工具系统等等。
1.2 为什么使用GoJS
用对象数据表达数据之间的逻辑关系,远不如用图像展示形象直观 ,一图胜千言,为了更直观地表达信息,我们常常需要用图形来展示数据以及逻辑关系。goJS图表种类,交互行为丰富,自定义模板灵活,已经有非常多的图表例子,支持复杂的模板定义和数据绑定,足够解决实际业务中的常见图表需求。
2. GoJS概念
2.1 MV架构
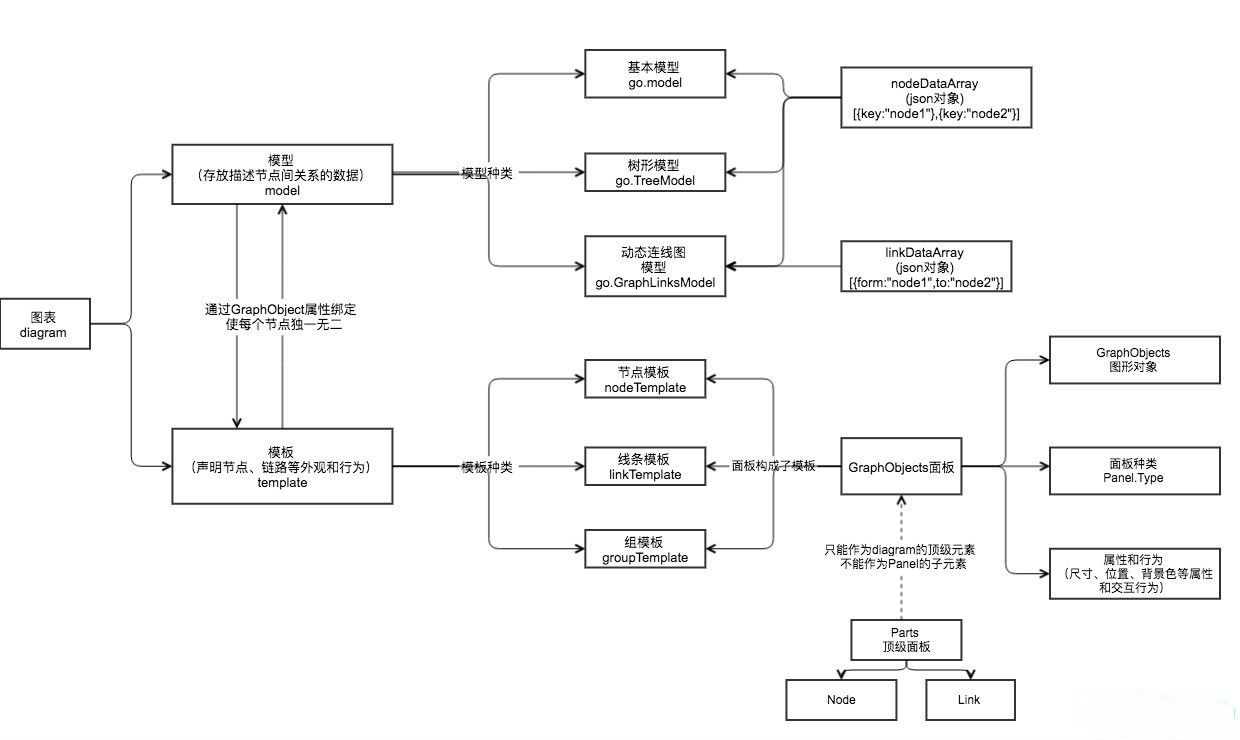
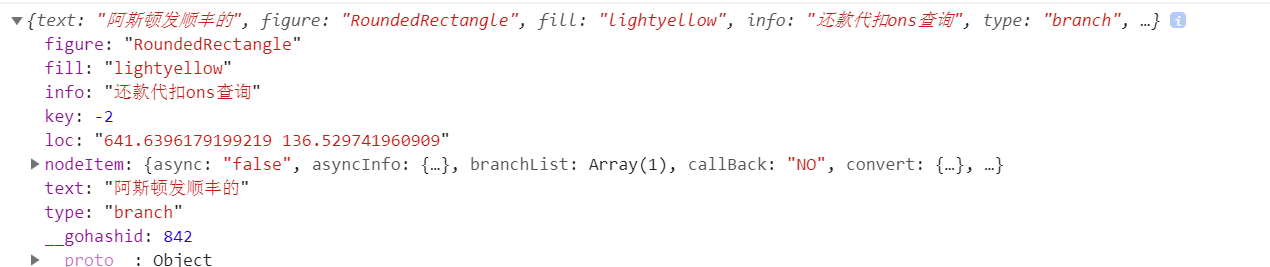
GoJs使用model-view(MV架构)的模式,Models作为数据层来管理那些描述性的数据(JS数组对象),Diagrams则负责视图层,将Nodes和Links的数据以可视化的方式渲染出来。Diagrams中的Nodes(节点)和Links(连线)呈现是由Model进行管理的。model和Diagrams实现了数据绑定,通过监听Model数据,自动改变Nodes上的GraphObjects外观和行为。Model数据对象是一个普通的JavaScript对象。我们编程操作只针对Model的数据层,而不是Diagrams的视图层。可以按照业务需求在Models数据对象上面添加任意属性,一般不需要修改Diagram的prototype(原型)和GraphObject(绘图单元)的classes(类).
数据绑定是指从源对象中提取值并在目标对象上设置属性。目标对象就是图形对象(GraphObject),源对象是模型中保存的js数据对象。
使用模板和数据绑定简化了存储在模型数据中的信息,灵活性非常强。当然并不是所有的数据属性都需要绑定使用
go.Binding VS 双向数据绑定(Two-way data binding)
go.Binding绑定只将属性的值从源数据转移到目标对象。但有时我们希望能够将GraphObject中的值传输回模型数据,使得模型数据与ui界面的图标中的数据保持一致。这可以通过使用TwoWay 绑定,它可以完成从源数据到目标对象,以及从目标对象到源数据的值传递。
2.2 图表(Diagram)
所有GoJS的属性和方法都在go这个命名空间下。所有GoJS的类名,例如Diagram、Node、Panel、 Shape、TextBlock也都使用go作为前缀,go.GraphObject.make来创建一个GoJS对象
GoJS图表即最后看到的可视化视图,它是由这些部分构成的:一个或多个可能有连接关系的、可能成组的节点。所有这些节点和链路聚集在相同或不同的层中,并呈现出一定的布局(开发者预定好的或GoJS自动布局)。
Diagram(图表属性)
| 画布初始位置(定义之后就不能拖动了) | initialContentAlignment: go.Spot.Center |
| 初始坐标 | initialPosition: new go.Point(0, 0) |
| 禁止移动节点 | allowMove:false |
| 禁止复制 | allowCopy: false |
| 禁止删除 | allowDelete:false |
| 禁止选中 | allowSelect:false |
| 禁止缩放 | allowZoom: false |
| 禁止撤销和重做 | "undoManager.isEnabled": false |
|
禁止水平拖动画布 禁止水平滚动条 |
allowHorizontalScroll: false |
|
禁止垂直拖动画布 禁止垂直滚动条 |
allowVerticalScroll: false |
| 只读 | isReadOnly: true |
| 画布初始化动画时间 | "animationManager.duration": 600 |
| 禁止画布初始化动画 | "animationManager.isEnabled": false |
| 画布比例 | scale:1.5 |
| 画布最小比例 | minScale:1.2, |
| 画布最大比例 | maxScale:2.0, |
| 显示网格 | "grid.visible":true, |
| 禁止鼠标拖动区域选中 | "dragSelectingTool.isEnabled" : false, |
| 画布边距padding Margin | padding:80或者new go.Margin(2, 0)或new go.Margin(1, 0, 0, 1) |
更多设置参见 https://gojs.net/latest/api/symbols/Diagram.html
2.3 模型(Model)
每个图表都有一个数据模型,用于保存开发者程序的数据。模型描述了节点之间的连接关系和组成员关系。用模型 Model.nodeDataArray 为每个数据项创建一个节点或组, 用模型 GraphLinksModel.linkDataArray 为每个数据项创建一个链接。而且,我们可以为每个数据对象添加所需的任何属性。
Models的种类
自定义的node模板让我们的图表看起来更美观,如果要创建一个完整的关系图,通过添加一些连线来表示这些独立的节点之间的对应关系,同时这些节点能够进行自动定位和排版。在我们的图表里为了得到这些连线,基本的Model已经满足不了需求。我们必须从GOJS中的支持连线的另外两个Models里选择,GraphLinksModel和TreeModel
GraphLinksModel中,除了model.nodeDataArray还有model.linkDataArray。它包含一个数组对象,通过”to”和”from”来描述没一个连线。
GraphLinksModel允许两个节点之间存在任何数量和任意方向的连线。比如A到B可以连10条线,B到A可以连3条以上反方向的线
TreeModel比GraphLinksModel更简单,但是不能随意的建利连接关系,就像2个节点之间有多条线,又或者有多个父级节点。
2.4 模板(Template)
模板声明了每个节点或链路的外观、位置和行为。
2.4.1 Nodes模板
* Shape 预定义的或者自定义的几何图形
 "Rectangle"--矩形, "RoundedRectangle"--圆角矩形, "Square"--正方形 "Ellipse"--椭圆  "Diamond"--菱形,  "Circle"--圆形   各种三角形 "TriangleRight", "TriangleDown", "TriangleLeft", "TriangleUp", "Triangle",

 "LineH", "LineV", "BarH", "BarV", "MinusLine", "PlusLine", "XLine"
* TextBlock 拥有各种各样字体的文本(可编辑)
* Picture 图片
* Panel 根据不同面板的类型,它可以包含其他位置或是尺寸不同的对象。(列如表格、 竖形列表和拉伸容器等)
TextBlocks不能包含图片;Shapes不能包含文字。如果你想让你的Node显示文字,你必须使用TextBlocks。如果你想绘制一些几何图形,你就必须使用Shape。
myDiagram.nodeTemplate = $(
        go.Node,
        "Horizontal",
        { background: "#44CCFF" },
        $(
          go.Shape,
          "Rectangle",
          {
            portId: "",
            fromLinkable: true,
            toLinkable: true,
            cursor: "pointer",
            fill: "white",
            strokeWidth: 1
          },
          new go.Binding("figure"),
          new go.Binding("fill")
        ),
        $(go.Picture, { margin: 10, width: 50, height: 50, background: "red" }, new go.Binding("source"), new go.Binding("figure")),
        $(go.TextBlock, "Default Text", { margin: 12, stroke: "white", font: "bold 16px sans-serif" }, new go.Binding("text", "name"))
      );
所有的这些building block类都是由GraphObjects抽象对象衍生出来。因为GraphObject不是DOM元素,所以创建和修改它们对性能开销不大。多个不同样式的Node节点模板可以通过myDiagram.nodeTemplateMap.add(go.Node)添加
 myDiagram.nodeTemplateMap.add("Center",
        $(go.Node, "Spot",
          {
            selectable: false,
            isLayoutPositioned: false,  // the Diagram.layout will not position this node
            locationSpot: go.Spot.Center
          },
          $(go.Shape, "Circle",
            { fill: radBrush, strokeWidth: 0, stroke: null, desiredSize: new go.Size(200, 200) }), // no outline
          $(go.TextBlock, "Arrowheads",
            { margin: 1, stroke: "white", font: "bold 14px sans-serif" })
        ));
 myDiagram.model =
        $(go.GraphLinksModel,
          { // this gets copied automatically when there's a link data reference to a new node key
            // and is then added to the nodeDataArray
            archetypeNodeData: {},
            // the node array starts with just the special Center node
            nodeDataArray: [{ category: "Center", key: "Center" }],
            // the link array was created above
            linkDataArray: linkdata
          });
    }
2.4.2 links模板
接下来我们构造一个新的连线模板,在没有为连线指定样式类型的条件下,默认的连线样式。
      myDiagram.linkTemplate =
        $(go.Link,  // the whole link panel
          { routing: go.Link.Normal },
          $(go.Shape,  // the link shape
            // the first element is assumed to be main element: as if isPanelMain were true
            { stroke: "gray", strokeWidth: 2 }),
          $(go.Shape,  // the "from" arrowhead
            new go.Binding("fromArrow", "fromArrow"),
            { scale: 2, fill: "#D4B52C" }),
          $(go.Shape,  // the "to" arrowhead
            new go.Binding("toArrow", "toArrow"),
            { scale: 2, fill: "#D4B52C" }),
          {
            click: showArrowInfo,
            toolTip:  // define a tooltip for each link that displays its information
              $("ToolTip",
                $(go.TextBlock, { margin: 4 },
                  new go.Binding("text", "", infoString).ofObject())
              )
          }
        );
2.4.3 面板(Panel)
每个模板由GoJS中的面板Panel构成,面板本身作为一个图形对象GraphObject,保存其他图形对象作为它的元素,同时,面板需要负责图形对象的尺寸、位置。
每个面板建立自己的坐标系,面板中的元素按顺序绘制,从而确定了内部这些元素的z坐标。
面板有很多种类,比如 Panel.Position,Panel.Auto,Panel.Vertical,Panel.Horizontal ,Panel.Spot ,Panel.Table,Panel.Viewbox, Panel.Link,Panel.Grid等等。
最简单的面板是“Position”(Panel.Position)。每个元素获得其正常大小
每个元素的位置是由GraphObject.position属性指定。如果没有指定位置时,元件被定位在(0,0)。所有位置都是面板自己的坐标系中,而不是在图表范围的坐标系。位置可能包括负坐标。
面板的大小刚好足以容纳所有元素。
Panel.Vertical 面板的所有面板元件的排列垂直从上到下
构成面板的图形对象有Shapes、Pictures、TextBlocks Placeholder,它们都有默认模板。
2.5 图表布局
图表(Diagram)在节点没有指定坐标的时候,图表会显示一个用网格形式排列的默认布局。我们可以显式的给每个节点分配一个位置来给组织排序来解决这个混乱的组织结构,更容易的解决方案是,我们会使用布局来自动排列位置。
设置了布局之后,会影响节点位置和链路属性.常见的布局有: 网格布局 go.GridLayout 力导向布局 go.ForceDirectedLayout, 树形布局 go.TreeLayout, 径向布局(需要引RadialLayout.js) RadialLayout

布局算法可以重写
myDiagram =
$(go.Diagram, "myDiagramDiv", // 画布定义
    {layout:$(go.GridLayout, //自动布局定义,设置为网格布局
              { comparer: go.GridLayout.smartComparer,//设置从小到大排序
                spacing: go.Size.parse("20 20"),//设置节点间隔
                comparer: function(a, b){
                    //重写布局算法,根据其他属性值重新增设置顺序
                    var ay = a.data.type;
                    var by = b.data.type;
                    if(!!ay&&!!by){
                        if(ay > by) return -1;
                        if(ay < by) return 1;
                    }else if(!!ay){
                        return -1;
                    }else if(!!by){
                        return 1;
                    }
                }
              });
    });
更多布局方式 https://gojs.net/latest/intro/layouts.html
2.6 画布事件
利用绘图过程中的一些DiagramListener可以完成更多的数据交互体验和业务逻辑
| 节点生成事件 | ExternalObjectsDropped |
| 线生成事件 | LinkDrawn |
| 线重新连接事件 | LinkRelinked |
| 删除后事件 | SelectionDeleted |
| 删除前事件 | SelectionDeleting |
| 节点移动事件 | SelectionMoved |
| 节点修改 | Modified |
| 选择节点更改完成 | ChangeeSelection |
添加图表事件的两种方式
第一种在创建Diagram时注册对应的事件的监听
myDiagram = goObj(go.Diagram, "myDiagramDiv",
{
  initialContentAlignment: go.Spot.Center,
  allowDrop: true,
  "LinkDrawn": showLinkLabel,
  "LinkRelinked": showLinkLabel,
  "animationManager.duration": 800,
  "undoManager.isEnabled": true
});
function showLinkLabel(e) {
  var label = e.subject.findObject("LABEL");
  if (label !== null) label.visible = (e.subject.fromNode.data.figure === "RoundedRectangle");
}
第二种在创建Diagram时完成后监听对应的事件
myDiagram.addDiagramListener("Modified", function(e) {
var button = document.getElementById("SaveButton");
  if (button) button.disabled = !myDiagram.isModified;
  var idx = document.title.indexOf("*");
  if (myDiagram.isModified) {
    if (idx < 0) document.title += "*";
  } else {
    if (idx >= 0) document.title = document.title.substr(0, idx);
  }

});
事件应用举例: 约束编程--如果是孤立节点则删除
      myDiagram.addDiagramListener("ExternalObjectsDropped", function(e) {
        var newnode = e.diagram.selection.first();
        if (newnode.linksConnected.count === 0) {
          // when the selection is dropped but not hooked up to the rest of the graph, delete it
          e.diagram.commandHandler.deleteSelection();
        }
      });
更多事件参见 https://gojs.net/latest/api/symbols/DiagramEvent.html
2.7 画布工具栏
结合undoManager创建撤销重做删除的工具栏
 $('#deletePart').click(function(){
       if("undefined" == typeof myDiagram){
              result_prompt(0, "浏览器不兼容此功能,请使用高版本谷歌浏览器!");
              return false;
       }
       myDiagram.remove(Select_Port);
  });

  $('#undo-buttun').click(function(){
   if("undefined" == typeof myDiagram){
          result_prompt(0, "浏览器不兼容此功能,请使用高版本谷歌浏览器!");
          return false;
   }
   myDiagram.undoManager.undo();
  });

  $('#redo-buttun').click(function(){
   if("undefined" == typeof myDiagram){
          result_prompt(0, "浏览器不兼容此功能,请使用高版本谷歌浏览器!");
          return false;
   }
   myDiagram.undoManager.redo();
  });
3 如何使用GoJS
step1 下载gojs 源码 并在页面中引用
step2 在页面中创建goJS图表容器,一定要设置宽高,否则图形绘制不出来
step3 创建GraphObject图表实例,(定义样式,交互,布局,属性)
step4 定义图表属性及事件 节点样式事件 链路样式及事件
step5 绑定图表节点和链路数据, 渲染图表,综合节点模板、链接模板、TreeModel和Treelayout,就生成了一张家族图谱。
项目中用到的几个功能点的实现
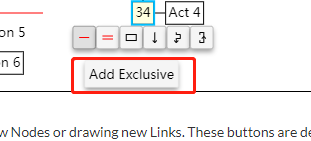
3.1 鼠标右键菜单
 {
          contextMenu: $(go.Adornment, "Vertical", new go.Binding("itemArray", "commands"), {
            itemTemplate: $(
              "ContextMenuButton",
              $(go.Shape, { figure: "RoundedRectangle", fill: "transparent", width: 40, height: 24, stroke: "gray", strokeWidth: 1, scale: 1.0, areaBackground: "transparent" }),
              $(go.TextBlock, { stroke: "deepskyblue", height: 24, width: 40, margin: 0, font: "bold 12px serif", textAlign: "center", verticalAlignment: go.Spot.Center }, new go.Binding("text")),
              {
                click: function(e, button) {
                  if (myDiagram.isReadOnly) return;
                  var cmd = button.data;
                  var nodedata = button.part.adornedPart.data;
                  // console.log(nodedata);
                  let curNode = myDiagram.findNodeForKey(nodedata.key);
                  options.contextMenu(curNode, cmd.text);
                  // console.log("On " + nodedata.text + "  " + cmd.text + ": " + cmd.action);
                }
              }
            )
          })
 }
        {
          text: "开始策略",
          figure: "Ellipse",
          fill: "#FEF7E7",
          stroke: '#FDCF90',
          info: "",
          type: "start",
          commands: [{ text: "查看", action: "view" }, { text: "删除", action: "view" }],
        },
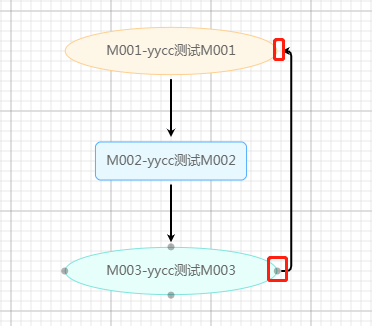
3.2 虚线及节点虚线框
{fromPort: "B", toPort: "T", from: -1, to: -3,category: "auditedDottedLine"}
// 自定义虚线样式
  myDiagram.linkTemplateMap.add(
    "auditedDottedLine",
    $(
      go.Link,
      {
        selectable: true,
        selectionAdornmentTemplate: linkSelectionAdornmentTemplate
      },
      {
        relinkableFrom: true,
        relinkableTo: true,
        reshapable: true
      },
      {
        routing: go.Link.AvoidsNodes,
        curve: go.Link.JumpOver,
        corner: 5,
        toShortLength: 4
      },
      $(go.Shape, {
        isPanelMain: true,
        strokeWidth: 2,
        strokeDashArray: [3, 3]
      }),
      $(go.Shape, {
        toArrow: "Standard",
        stroke: null
      }),
      $(
        go.Panel,
        "Auto",
        $(
          go.Shape,
          "RoundedRectangle",
          new go.Binding("fill", "text", function(v) {
            return v ? "#F8F8F8" : null;
          }),
          {
            stroke: null,
            fill: null
          }
        ),
        $(
          go.TextBlock,
          {
            segmentIndex: 1,
            segmentFraction: 0.5,
            textAlign: "center",
            font: "10pt helvetica, arial, sans-serif",
            stroke: "blue",
            margin: 2,
            minSize: new go.Size(10, NaN)
            // editable: true
          },
          new go.Binding("text").makeTwoWay()
        )
      )
    )
  );
设置节点虚线边框
$(go.Shape, "Rectangle", { width: 40, height: 60, margin: 4, fill: null, strokeWidth: 2, strokeDashArray: [6, 6, 2, 2] }),
  myDiagram.nodeTemplate = $(
    go.Node,
    "Spot",
    $(
      go.Panel,
      "Auto",
      { name: "PANEL" },
      new go.Binding("desiredSize", "size", go.Size.parse).makeTwoWay(go.Size.stringify),
      $(
        go.Shape,
        "Rectangle",
        {
          portId: "",
          fromLinkable: true,
          toLinkable: true,
          cursor: "pointer",
          fill: "white",
          stroke: "black",
          strokeWidth: 1
        },
        new go.Binding("figure"),
        new go.Binding("strokeDashArray"),
        new go.Binding("fill")
      ),
  )
3.3 自动补全
selectionChanged: function(eventPart) {
var dom = $$(".my-diagram-div canvas");
        dom.unbind("click", myFunction).bind("click", myFunction);
        function myFunction(e) {
          let position = {
            x: e.clientX,
            y: e.clientY
          };
          options.changeNodeSelection(eventPart.data, position);
          dom.unbind("click", myFunction);
        }
      }
let canvas = $(".my-diagram-div");
let selectHandlerDom = $('.select-handler');
            canvas.on('input propertychange','textarea',e => {
              selectHandlerDom.css({
                top:position.y + 20 +'px',
                left:position.x - 20 +'px',
                'z-index':10000
              });
              this.filterHandlerOptions(e.target.value);
            })
            selectHandlerDom.unbind('click').on('click','li',e => {
              let val = $(e.target).text()
              this.myDiagram.model.setDataProperty(data, 'text',val);
              canvas.find('textarea').val(val);

            })
            canvas.click(e => {
              selectHandlerDom.css({
                'z-index':-1
              })
            })
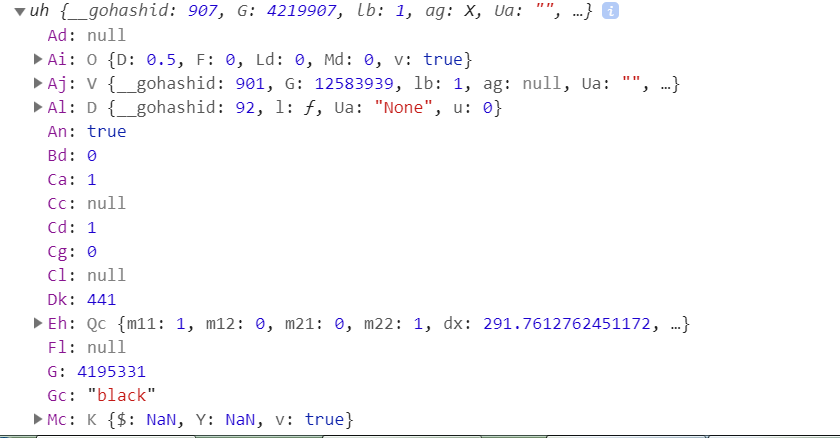
3.4 GoJS版本过低操作节点时引起的事务执行出错信息

3.5 去除水印
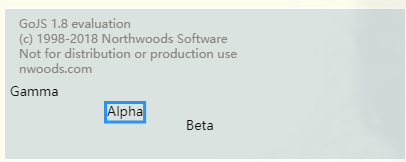
1) 在文件中搜索7eba17a4ca3b1a8346,找到类似a.Jv=d[w.Jg("7eba17a4ca3b1a8346")][w.Jg("78a118b7")](d,w.um,4,4);这样结构的代码
2) 将其注释,替换成a.Jv=function(){return true;};
3.6 设置了布局引起连线不美观的问题
layout: $(go.TreeLayout, { angle: 90 }),
设置了布局,连线的起点和重点就会受布局的影响,可以即使不保存节点的位置信息,绘制出来的图形也按照一定规律排列
layout: $(go.LayeredDigraphLayout, { isInitial: false, direction: 90, columnSpacing: 50, isOngoing: false, layerSpacing: 50 }),
取消了布局设置,需要保存节点的位置信息,才能还原出节点的连线位置信息

3.7 图形对象part和data属性,有些事件传入的事件对象,不能直接获取data属性,要先索引part属性,然后再去引用data属性
      $(
        go.TextBlock,
        {
          font: "bold 11pt Helvetica, Arial, sans-serif",
          margin: 8,
          maxSize: new go.Size(300, NaN),
          wrap: go.TextBlock.WrapFit,
          editable: true,
          textEdited: function(textBlock, previousText, currentText) {
            console.log(textBlock,textBlock.part.data);
            options.changeNodeSelection(textBlock.part.data);
          }
        },

        new go.Binding("text").makeTwoWay()
      )
3.8 下载Canvas图片
makeImageData方法通过HTMLCanvasElement.toDataURL()方法实现的
    downLoadImage(name) {
      // 不设置,下载的图片残缺不全
      // this.myDiagram.autoScale = go.Diagram.Uniform;
      var a = document.createElement("a");
      a.href = this.myDiagram.makeImageData({
        scale: 1,
        type: "image/png",
        maxSize: new go.Size(Infinity, Infinity)
      });
      a.download = name;
      a.click();
    },
3.9 GoJS图表实例重复初始化报错
Invalid div id; div already has a Diagram associated with it.
解决方法:myDiagram.div=null;
10.设置了树形折叠菜单之后,当树形菜单有超过一级以上的叶子节点时,本该隐藏的叶子节点显示出来,解决的要点,要向下面这样设置显示和隐藏
      myDiagram.nodeTemplate =
        $(go.Node, "Horizontal",
          {
            deletable: false,
            selectable: false,
            isTreeExpanded: false,//折叠全部子节点
            // toolTip: tooltiptemplate,
          },

      myDiagram.addDiagramListener("InitialLayoutCompleted", function (e) {
        if (EditType != 'export') {
          // 只展示一级菜单
          e.diagram.findTreeRoots().each(function (r) { r.expandTree(2) });
        }
      });
4.一些小功能点的实现
4.1添加图例
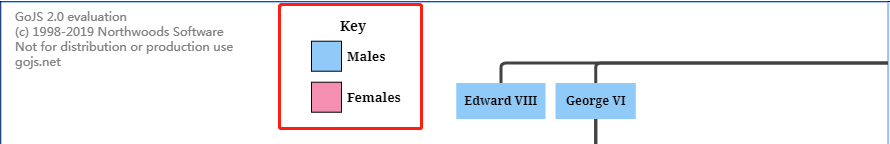
      myDiagram.add(
        $(go.Part, "Table",
          { position: new go.Point(300, 10), selectable: false },
          $(go.TextBlock, "Key",
            { row: 0, font: "700 14px Droid Serif, sans-serif" }),  // end row 0
          $(go.Panel, "Horizontal",
            { row: 1, alignment: go.Spot.Left },
            $(go.Shape, "Rectangle",
              { desiredSize: new go.Size(30, 30), fill: bluegrad, margin: 5 }),
            $(go.TextBlock, "Males",
              { font: "700 13px Droid Serif, sans-serif" })
          ),  // end row 1
          $(go.Panel, "Horizontal",
            { row: 2, alignment: go.Spot.Left },
            $(go.Shape, "Rectangle",
              { desiredSize: new go.Size(30, 30), fill: pinkgrad, margin: 5 }),
            $(go.TextBlock, "Females",
              { font: "700 13px Droid Serif, sans-serif" })
          )  // end row 2
        ));
4.2 上下两行文字
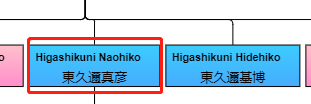
 myDiagram.nodeTemplate =
        $(go.Node, "Auto",
          { deletable: false, toolTip: tooltiptemplate },
          new go.Binding("text", "name"),
          $(go.Shape, "Rectangle",
            {
              fill: "orange",
              stroke: "black",
              stretch: go.GraphObject.Fill,
              alignment: go.Spot.Center
            },
            new go.Binding("fill", "gender", genderBrushConverter)),
          $(go.Panel, "Vertical",
            $(go.TextBlock,
              {
                font: "bold 8pt Helvetica, bold Arial, sans-serif",
                alignment: go.Spot.Center,
                margin: 6
              },
              new go.Binding("text", "name")),
            $(go.TextBlock,
              new go.Binding("text", "kanjiName"))
          )
        );
4.3 展开折叠按钮效果实现 faultTree.html

myDiagram.nodeTemplate = $(
          ...
          $("TreeExpanderButton", { alignment: go.Spot.Right, alignmentFocus: go.Spot.Left, "ButtonBorder.figure": "Rectangle" })
         ...
4.4 框内折叠 entityRelationship.html
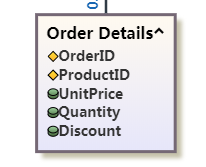
      // define the Node template, representing an entity
      myDiagram.nodeTemplate =
        $(go.Node, "Auto",  // the whole node panel
          {
            selectionAdorned: true,
            resizable: true,
            layoutConditions: go.Part.LayoutStandard & ~go.Part.LayoutNodeSized,
            fromSpot: go.Spot.AllSides,
            toSpot: go.Spot.AllSides,
            isShadowed: true,
            shadowColor: "#C5C1AA"
          },
          new go.Binding("location", "location").makeTwoWay(),
          // whenever the PanelExpanderButton changes the visible property of the "LIST" panel,
          // clear out any desiredSize set by the ResizingTool.
          new go.Binding("desiredSize", "visible", function(v) { return new go.Size(NaN, NaN); }).ofObject("LIST"),
          // define the node's outer shape, which will surround the Table
          $(go.Shape, "Rectangle",
            { fill: lightgrad, stroke: "#756875", strokeWidth: 3 }),
          $(go.Panel, "Table",
            { margin: 8, stretch: go.GraphObject.Fill },
            $(go.RowColumnDefinition, { row: 0, sizing: go.RowColumnDefinition.None }),
            // the table header
            $(go.TextBlock,
              {
                row: 0, alignment: go.Spot.Center,
                margin: new go.Margin(0, 14, 0, 2),  // leave room for Button
                font: "bold 16px sans-serif"
              },
              new go.Binding("text", "key")),
            // the collapse/expand button
            $("PanelExpanderButton", "LIST",  // the name of the element whose visibility this button toggles
              { row: 0, alignment: go.Spot.TopRight }),
            // the list of Panels, each showing an attribute
            $(go.Panel, "Vertical",
              {
                name: "LIST",
                row: 1,
                padding: 3,
                alignment: go.Spot.TopLeft,
                defaultAlignment: go.Spot.Left,
                stretch: go.GraphObject.Horizontal,
                itemTemplate: itemTempl
              },
              new go.Binding("itemArray", "items"))
          )  // end Table Panel
        );  // end Node
4.5 拖拽回收站功能实现 动态创建节点和连线 flowBuilder.html
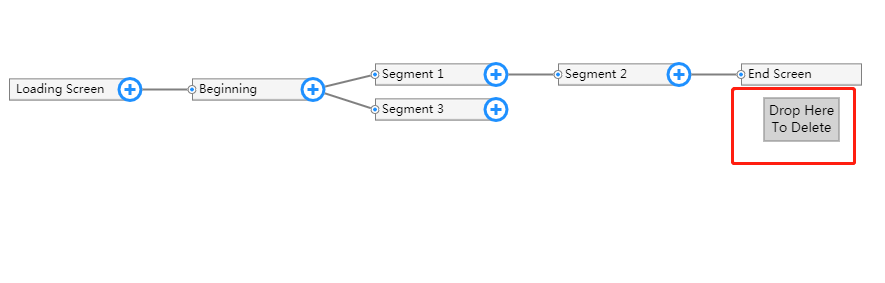
      myDiagram.nodeTemplateMap.add("Recycle",
        $(go.Node, "Auto",
          {
            portId: "to", toLinkable: true, deletable: false,
            layerName: "Background", locationSpot: go.Spot.Center
          },
          new go.Binding("location", "loc", go.Point.parse).makeTwoWay(go.Point.stringify),
          { dragComputation: function(node, pt, gridpt) { return pt; } },
          { mouseDrop: function(e, obj) { myDiagram.commandHandler.deleteSelection(); } },
          $(go.Shape,
            { fill: "lightgray", stroke: "gray" }),
          $(go.TextBlock, "Drop Here\nTo Delete",
            { margin: 5, textAlign: "center" })
        ));
4.6 提示工具
function makeTooltip(str) {
// a helper function for defining tooltips for buttons
        return $("ToolTip",
          $(go.TextBlock, str));
}
4.7 创建组
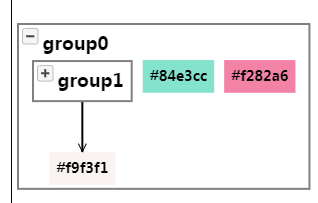
    myDiagram.groupTemplate =
        $(go.Group, "Auto",
          { // define the group's internal layout
            layout: $(go.TreeLayout,
              { angle: 90, arrangement: go.TreeLayout.ArrangementHorizontal, isRealtime: false }),
            // the group begins unexpanded;
            // upon expansion, a Diagram Listener will generate contents for the group
            isSubGraphExpanded: false,
            // when a group is expanded, if it contains no parts, generate a subGraph inside of it
            subGraphExpandedChanged: function(group) {
              if (group.memberParts.count === 0) {
                randomGroup(group.data.key);
              }
            }
          },
          $(go.Shape, "Rectangle",
            { fill: null, stroke: "gray", strokeWidth: 2 }),
          $(go.Panel, "Vertical",
            { defaultAlignment: go.Spot.Left, margin: 4 },
            $(go.Panel, "Horizontal",
              { defaultAlignment: go.Spot.Top },
              // the SubGraphExpanderButton is a panel that functions as a button to expand or collapse the subGraph
              $("SubGraphExpanderButton"),
              $(go.TextBlock,
                { font: "Bold 18px Sans-Serif", margin: 4 },
                new go.Binding("text", "key"))
            ),
            // 设置 go.Placeholder 对象的目的是, 让组自适应内部节点的大小;
            $(go.Placeholder,
              { padding: new go.Margin(0, 10) })
          )  // end Vertical Panel
        );  // end Group
myDiagram.model.addNodeData({ key: name, isGroup: true, group: group });
4.8 交互面板
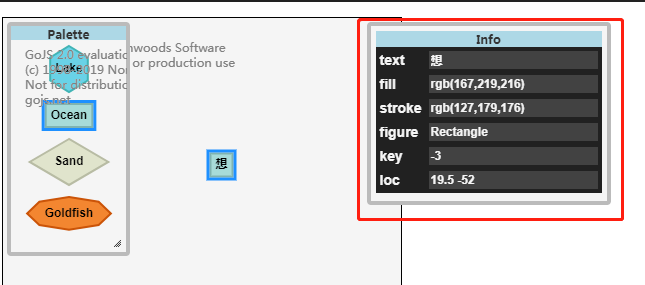
          var inspector = new Inspector("myInfo", myDiagram, {
            properties: {
              // key would be automatically added for nodes, but we want to declare it read-only also:
              "key": { readOnly: true, show: Inspector.showIfPresent },
              // fill and stroke would be automatically added for nodes, but we want to declare it a color also:
              "fill": { show: Inspector.showIfPresent, type: 'color' },
              "stroke": { show: Inspector.showIfPresent, type: 'color' }
            }
          });
4.9 自定义tooltip
      // get tooltip text from the object's data
      function tooltipTextConverter(person) {
        var str = "";
        str += "Born: " + person.birthYear;
        if (person.deathYear !== undefined) str += "\nDied: " + person.deathYear;
        if (person.reign !== undefined) str += "\nReign: " + person.reign;
        return str;
      }

      // define tooltips for nodes
      var tooltiptemplate =
        $("ToolTip",
          { "Border.fill": "whitesmoke", "Border.stroke": "black" },
          $(go.TextBlock,
            {
              font: "bold 8pt Helvetica, bold Arial, sans-serif",
              wrap: go.TextBlock.WrapFit,
              margin: 5
            },
            new go.Binding("text", "", tooltipTextConverter))
        );

      myDiagram.nodeTemplate =
        $(go.Node, "Horizontal",
          {
            deletable: false,
            selectable: false,
            toolTip: tooltiptemplate,
          })
4.10 其它效果参见GoJS的示例
1.各种箭头样式 arrowheads.html
2.所有的形状shapes.html
3.自定义节点上下文 customContextMenu.html
4.自定义卷起折叠 customExpandCollapse.html
5.自定义选择输入框 customTextEditingTool.html
6.定义多个连线的入口和出口 dataFlow.html draggablePorts.html 鼠标右键动态增删端口 dynamicPorts.html
7.实体关系 连线会动态链接 避免交错在一起 entityRelationship.html
8.鼠标经过时显示多行节点信息 dataVisualization.html
9.拖动排序 dragDropFields.html
10.限制节点在特定范围内移动 且不能触碰到边缘 dragUnoccupied.html
11.手势缩放功能 gestureBehavior.html
12.鼠标经过时显示按钮 hoverButtons.html
4.11 常用的API
批量删除连线
var removeLinks=[];
//首先拿到这个节点的对象
var node = myDiagram.findNodeForKey('key');
//获取节点所有线
node.findLinksConnected().each(function(link) {
     removeLinks.push(link.data);
    }
 );
myDiagram.model.removeLinkDataCollection(removeLinks);
监听连线完成事件
myDiagram.addDiagramListener("LinkDrawn",function(e){
       (e.subject.data )    //这是这个线条的数据
 }) ;
监听新拖拽到画布的节点
diagram.addModelChangedListener(function(evt) {
    // ignore unimportant Transaction events
    if (!evt.isTransactionFinished) return;
    var txn = evt.object;  // a Transaction
    if (txn === null) return;
    // iterate over all of the actual ChangedEvents of the Transaction
    txn.changes.each(function(e) {
      // ignore any kind of change other than adding/removing a node
      if (e.modelChange !== "nodeDataArray") return;
      // record node insertions and removals
      if (e.change === go.ChangedEvent.Insert) {
        console.log(evt.propertyName + " added node with key: " + e.newValue.key);
      } else if (e.change === go.ChangedEvent.Remove) {
        console.log(evt.propertyName + " removed node with key: " + e.oldValue.key);
      }
    });
  });
通过key值去查找节点
myDiagram.findNodeForKey(key).data //key值是节点的key
添加节点
let nodeData={ text: "Start", figure: "Ellipse", fill: "#00AD5F", info: "", type: "start" };
myDiagram.model.addNodeData(nodeData); // 须有位置信息
删除节点
myDiagram.remove(part)
添加线
let linkData ={ from: newnode.data.key, to: oldnode.data.key, text: "true", side: "Left", isHighlighted:false};
myDiagram.model.addLinkData(linkData); // linkData是连线数据
查找该节点的下一级节点
key.findNodesOutOf()
获取当前画布的json
myDiagram.model.toJson(); // 得到结果为json字符串
加载json刷新画布
myDiagram.model = go.Model.fromJson(model); // 传入参数model为json字符串
获取节点对象
var node=myDiagram.findNodeForKey('key');
获取节点data
var nodeData=myDiagram.model.findNodeDataForKey('key');
获取画布全部节点
var nodes=myDiagram.nodes;
//遍历输出节点对象
nodes.each(function (node) {
console.log(node.data.text);
});
根据甲,找甲的子级元素
node.findTreeChildrenNodes().each(function(cNode) {
console.log(cNode.data)
});
获取节点的线
var node=myDiagram.findNodeForKey('key');

node.findLinksConnected().each(function(link) {console.log(link.data)});
获取从节点出来的线
var node=myDiagram.findNodeForKey('key');

node.findLinksOutOf().each(function(link) {console.log(link.data)});
更新节点
// 修改单个节点属性
myDiagram.model.updateTargetBindings(node.data)

// 批量修改节点属性
myDiagram.model.nodeDataArray
myDiagram.model.linkDataArray
//修改完成调用以下方法完成重建
myDiagram.rebuildParts()
更新节点API
// 更新方式一
let curDataNode = myDiagram.model.findNodeDataForKey(this.clickNodeKey);
curDataNode.nodeItem = this[obj.type + "Info"];
myDiagram.model.updateTargetBindings(curDataNode);
// 更新方式二
myDiagram.model.setDataProperty(curNode, "data", curNode.data);
console.log("curNode.data", curNode.data);
参考文章
[2] gojs简单入门---去除水印
[3] goJS 绘制web流程图
[4] 关于 Gojs 你可能用到的方法
[5] gojs 官网api翻译
[7] GoJS官方教程
[10] gojs的一些使用技巧

 浙公网安备 33010602011771号