
Prometheus安装部署及监控linux主机
Prometheus(普罗米修斯)是一套开源的监控&报警&时间序列数据库的组合,起始是由SoundCloud公司开发的.Prometheus基本原理是通过HTTP协议周期性抓取被监控组件的状态,这样做的好处是任意组件只要提供HTTP接口就可以接入监控系统,不需要任何SDK或者其他的集成过程。这样做非常适合虚拟化环境比如VM或者Docker 。
Prometheus官网下载地址: https://prometheus.io/download/
grafana官网下载值:https://grafana.com/grafana/download/
本章部署软件及版本如下:
https://github.com/prometheus/prometheus/releases/download/v2.26.0/prometheus-2.26.0.linux-amd64.tar.gz
https://github.com/prometheus/node_exporter/releases/download/v1.1.2/node_exporter-1.1.2.linux-amd64.tar.gz
https://github.com/prometheus/alertmanager/releases/download/v0.21.0/alertmanager-0.21.0.linux-amd64.tar.gz
https://dl.grafana.com/oss/release/grafana-7.1.4-1.x86_64.rpm
一、安装Prometheus

###########################################
#创建用户组
# groupadd prometheus
# useradd -g prometheus -m -s /sbin/nologin prometheus

# 解压配置
# tar -zxvf prometheus-2.26.0.linux-amd64.tar.gz
# mv prometheus-2.26.0.linux-amd64 /usr/local/prometheus
# sed -i 's/localhost/10.0.2.118/g' /usr/local/prometheus/prometheus.yml

# 创建数据目录
$ mkdir /usr/local/prometheus/data/

# 权限修改
# chown -R prometheus.prometheus /usr/local/prometheus

# 检查并加载配置文件
 [root@localhost prometheus]# ./promtool check config prometheus.yml

# 创建systemd服务

cat <<EOF > /usr/lib/systemd/system/prometheus.service
[Unit]
Description=prometheus
After=network.target
[Service]
Type=simple
User=prometheus
ExecStart=/usr/local/prometheus/prometheus --config.file=/usr/local/prometheus/prometheus.yml --storage.tsdb.path=/usr/local/prometheus/data/ --web.enable-lifecycle --storage.tsdb.retention.time=30d
Restart=on-failure
[Install]
WantedBy=multi-user.target
EOF

# --config.file: 指定配置文件
# --web.enable-lifecycle: 支持通过http请求重载配置
# --storage.tsdb.path: 指定数据存储目录(默认当前目录的的data目录,若不存在则新建)
# --storage.tsdb.retention.time: 指定数据保留时间(默认15d)

# 启动服务
# systemctl daemon-reload
# systemctl start prometheus
# systemctl status prometheus && systemctl enable prometheus

# 确认端口已经被监听
# ss -lnput | grep 9090
tcp    LISTEN     0      128    [::]:9090               [::]:*                   users:(("prometheus",pid=71025,fd=8))
浏览器访问:
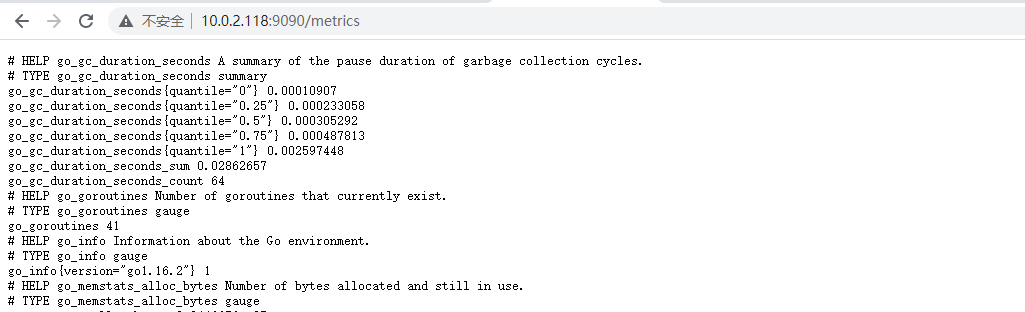
Prometheus管理接口:
# curl  http://10.0.2.118:9090/-/healthy
Prometheus is Healthy.
# curl  http://10.0.2.118:9090/-/ready
Prometheus is Ready.

# curl -XPOST http://10.0.2.118:9090/-/reload
# 通过web接口重载,启动时需增加选项  --web.enable-lifecycle

# curl -XPUT http://10.0.2.118:9090/-/quit
# 停止Prometheus
# 同样需启动时增加--web.enable-lifecycle选项
二、安装grafana
# wget https://dl.grafana.com/oss/release/grafana-7.1.4-1.x86_64.rpm
# yum -y install grafana-7.1.4-1.x86_64.rpm
# systemctl daemon-reload
# systemctl enable grafana-server && systemctl start grafana-server
# ss -lnput | grep 3000
tcp    LISTEN     0      1024     :::3000                 :::*                   users:(("grafana-server",pid=8843,fd=8))
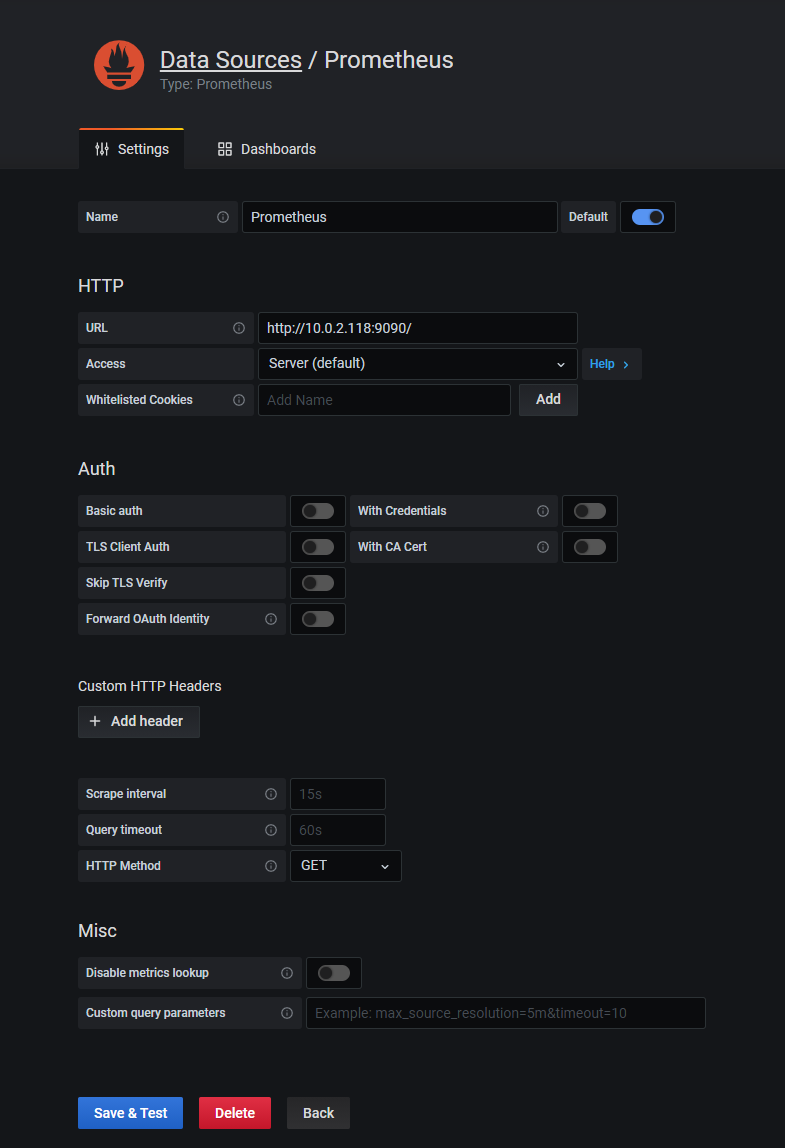
三、grafana添加Prometheus数据源
访问grafana的3000端口进行登录,默认用户名和密码为: admin/admin。第一次登陆修改更改密码!
Configuration -> Data Sources -> Prometheus
四、安装node_exporter
node_exporter用于收集主机运行信息,比如CPU、内存、磁盘等资源使用情况。
各种监控exporter,可以去官网下载
#创建用户组
# groupadd prometheus
# useradd -g prometheus -m -s /sbin/nologin prometheus

#安装并解压
# tar -zxvf node_exporter-1.1.2.linux-amd64.tar.gz -C /usr/local/
# cd /usr/local/
# mv node_exporter-1.1.2.linux-amd64/ node_exporter

# 权限修改
# chown -R prometheus.prometheus /usr/local/node_exporter


# 创建systemd服务
cat > /usr/lib/systemd/system/node_exporter.service <<EOF

[Unit]
Description=node_export
Documentation=https://github.com/prometheus/node_exporter
After=network.target
[Service]
Type=simple
User=prometheus
ExecStart=/usr/local/node_exporter/node_exporter
Restart=on-failure
[Install]
WantedBy=multi-user.target
EOF

# 启动服务
# systemctl daemon-reload
# systemctl enable node_exporter && systemctl start node_exporter
# systemctl status node_exporter
# ss -lnput | grep 9100
tcp    LISTEN     0      128    [::]:9100               [::]:*                   users:(("node_exporter",pid=78546,fd=3))
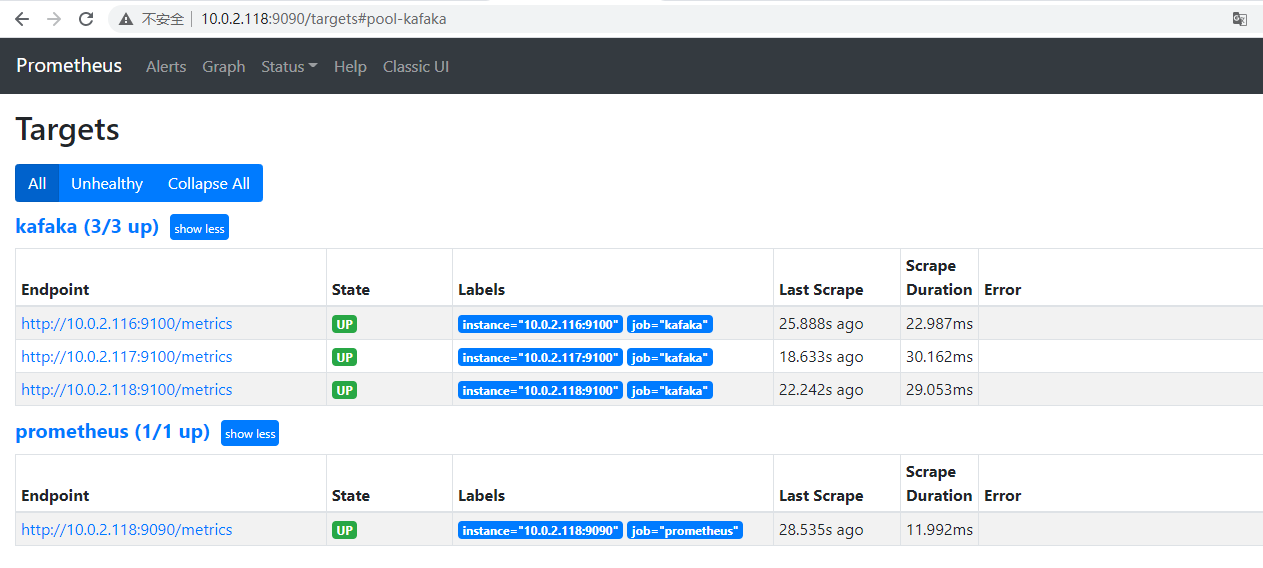
五、调整Prometheus配置获取主机及应用监控数据,添加116、117两台主机作为agent端.
116/117主机安装agent客户端node_exporter,方法同上.
#创建用户组
# groupadd prometheus
# useradd -g prometheus -m -s /sbin/nologin prometheus

#安装并解压
# tar -zxvf node_exporter-1.1.2.linux-amd64.tar.gz -C /usr/local/
# cd /usr/local/
# mv node_exporter-1.1.2.linux-amd64/ node_exporter

# 权限修改
# chown -R prometheus.prometheus /usr/local/node_exporter


# 创建systemd服务
cat > /usr/lib/systemd/system/node_exporter.service <<EOF

[Unit]
Description=node_export
Documentation=https://github.com/prometheus/node_exporter
After=network.target
[Service]
Type=simple
User=prometheus
ExecStart=/usr/local/node_exporter/node_exporter
Restart=on-failure
[Install]
WantedBy=multi-user.target
EOF

# 启动服务
# systemctl daemon-reload
# systemctl enable node_exporter && systemctl start node_exporter
# systemctl status node_exporter
# ss -lnput | grep 9100
tcp    LISTEN     0      128    [::]:9100               [::]:*                   users:(("node_exporter",pid=78546,fd=3))
调整Prometheus配置,并重启prometheus服务.
# vim  prometheus.yml
global:
  scrape_interval:     15s # Set the scrape interval to every 15 seconds. Default is every 1 minute.
  evaluation_interval: 15s # Evaluate rules every 15 seconds. The default is every 1 minute.
  # scrape_timeout is set to the global default (10s).
alerting:
  alertmanagers:
  - static_configs:
    - targets:
      # - alertmanager:9093
rule_files:
  # - "first_rules.yml"
  # - "second_rules.yml"
scrape_configs:
  # The job name is added as a label `job=<job_name>` to any timeseries scraped from this config.
  - job_name: 'prometheus'
    static_configs:
    - targets: ['10.0.2.118:9090']

#增加以下配置,其中job_name为自定义
  - job_name: 'kafaka'
    static_configs:
    - targets: ['10.0.2.116:9100','10.0.2.117:9100','10.0.2.118:9100']
确定Prometheus已采集到数据
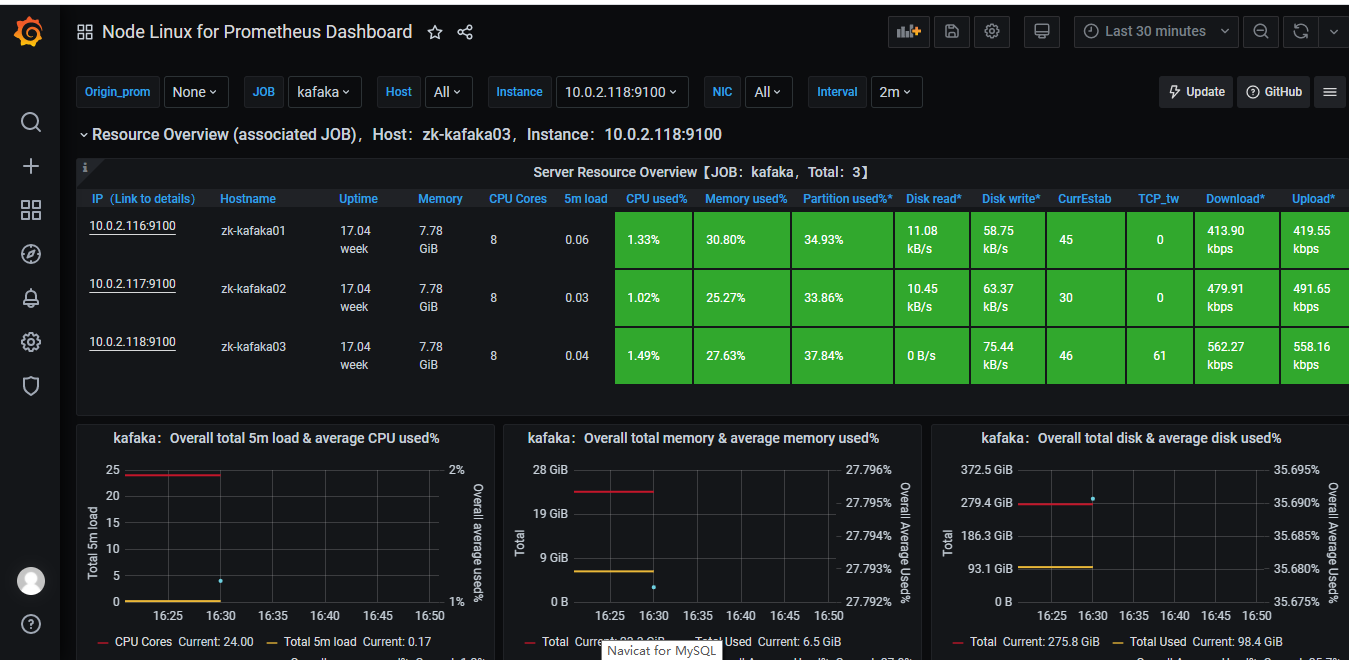
六、验证
使用Grafana添加图形,便于展示!(监控Linux主机推荐使用11074模板)!
grafana模板地址:点击查看
Grafana插件扩展之饼图安装
有些时候导入的插件里面有饼图类型,但是Grafana饼图插件默认并没有安装,所以需要自行安装!(强烈推荐在线安装,避免版本的问题)!
官网:https://grafana.com/grafana/plugins/grafana-piechart-panel
# grafana-cli plugins install grafana-piechart-panel
# systemctl restart grafana-server         # 安装完成后重启生效

 浙公网安备 33010602011771号