
echarts.js使用心得--demo
首先要感谢一下我的公司,因为公司需求上面的新颖(奇葩)的需求,让我有幸可以学习到一些好玩有趣的前端技术.
废话不多时 , 直接开始.
第一步: 导入echarts.js文件 下载地址:http://echarts.baidu.com/download.html
<script type="text/javascript" src="hs/js/plug-in/js/echarts.min.js"></script>
第二步: 在页面上定义一个固定高度的div
<div id="chart" style="width: auto; height: 600px;"/>
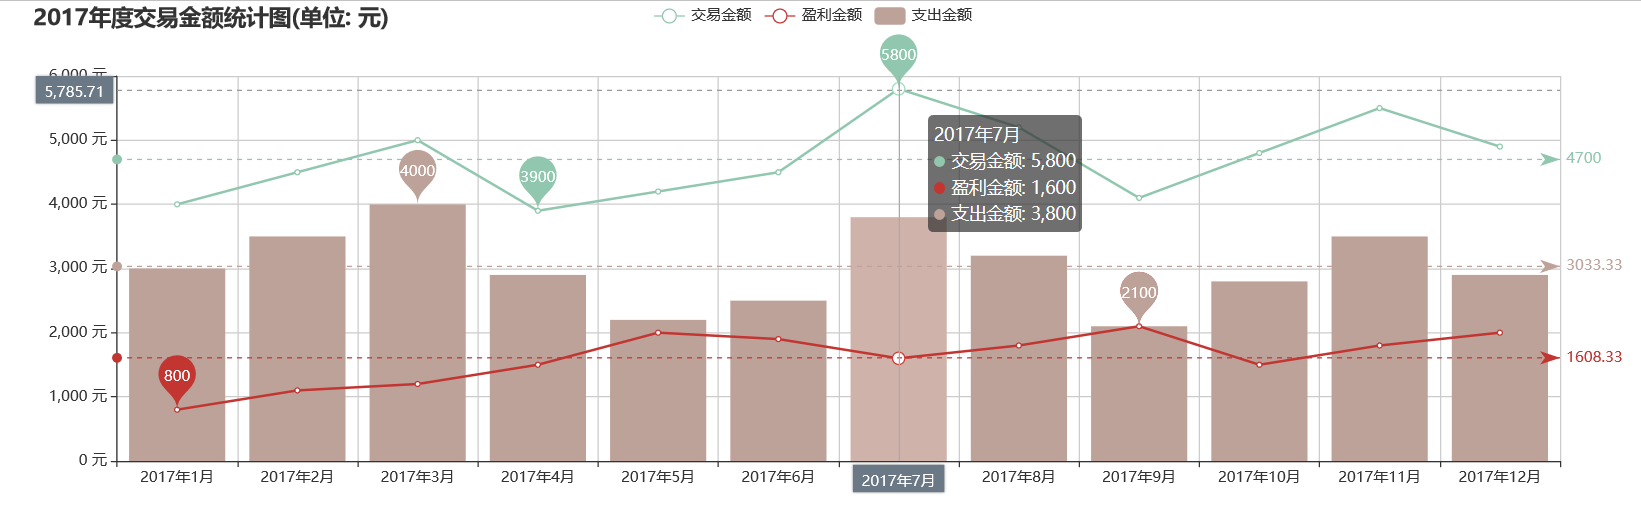
第三步: 编写js, 下面是我写的一个demo供大家参考
$(function() {
    // 初始化图表标签
    var myChart = echarts.init(document.getElementById('chart'));

    options = {
            title: { //标题
                text: '    2017年度交易金额统计图(单位: 元)', //图表标题
                link: 'user/reLogin.htm', //图表标题点击时的跳转路径
                target: 'self' //图表标题跳转时的打开方式  默认:blank
            },
            legend: { //图例组件
                left: 'center', //位置
                data: ['交易金额', '盈利金额', '支出金额'] //图例组件,要与下面的series中的name对应
            },
            tooltip : { //tip框
                trigger: 'axis', //触发方式
                axisPointer: { //指示器
                    type: 'cross', //指示器类型
                    label: {
                        backgroundColor: '#6a7985'
                    }
                }
            },
            animationDuration: 5000,    // 初始动画时长(单位: 毫秒)
            xAxis: { //x轴
                type: "category",
                boundaryGap: true, //坐标轴两边留白策略
                splitLine: {show: true}, //坐标轴在grid区域中的分隔线。
                data: ['2017年1月', '2017年2月', '2017年3月', '2017年4月', '2017年5月', '2017年6月', '2017年7月', '2017年8月', '2017年9月', '2017年10月', '2017年11月', '2017年12月']
            },
            grid: {
                left: '3%',
                right: '4%',
                bottom: '3%',
                containLabel: true
            },
            yAxis: { //y轴
                type : 'value',
                axisLabel: {
                    formatter: '{value} 元' //格式
                }
            },
            series: [ //数据列表
                {
                    name: '交易金额',
                    type: 'line',
                    color: ['#91c7ae'],
                    data: [4000, 4500, 5000, 3900, 4200, 4500, 5800, 5200, 4100, 4800, 5500, 4900],
                    markPoint: {
                        data: [
                            {type: 'max', name: '最大值'},
                            {type: 'min', name: '最小值'}
                        ]
                    },
                    markLine: {
                        data: [
                            {type: 'average', name: '平均值'}
                        ]
                    }
                },
                {
                    name: '盈利金额',
                    type: 'line',
                    color: ['#c23531'],
                    data: [800, 1100, 1200, 1500, 2000, 1900, 1600, 1800, 2100, 1500, 1800, 2000],
                    markPoint: {
                        data: [
                            {type: 'max', name: '最大值'},
                            {type: 'min', name: '最小值'}
                        ]
                    },
                    markLine: {
                        data: [
                            {type: 'average', name: '平均值'}
                        ]
                    }
                },
                {
                    name: '支出金额',
                    type: 'bar',
                    color: ['#bda29a'],
                    data: [3000, 3500, 4000, 2900, 2200, 2500, 3800, 3200, 2100, 2800, 3500, 2900],
                    markPoint: {
                        data: [
                            {type: 'max', name: '最大值'},
                            {type: 'min', name: '最小值'}
                        ]
                    },
                    markLine: {
                        data: [
                            {type: 'average', name: '平均值'}
                        ]
                    }
                }
            ]
        };

  //设置option
    myChart.setOption(options);
});
ok , 到此就算是写完了 , option中可以有多个参数 , 可以参考官网http://echarts.baidu.com/option.html#title , 我这里只是一个简单的demo供大家参考.
下面贴出效果图

 浙公网安备 33010602011771号