debug:am profile命令的实现
debug:am profile命令的实现
一、源码分析
代码基于android11。am命令的实现见debug:am、cmd命令。书接上文,
system_server进程
ActivityManagerShellCommand#onCommand
frameworks/base/services/core/java/com/android/server/am/ActivityManagerShellCommand.java
 176     @Override
 177     public int onCommand(String cmd) {
 183             switch (cmd) {
 184                 case "start":
 185                 case "start-activity":
 186                     return runStartActivity(pw);
......
 205                 case "profile":
 206                     return runProfile(pw);
......
走到206行
ActivityManagerShellCommand#runProfile
frameworks/base/services/core/java/com/android/server/am/ActivityManagerShellCommand.java
 815     private int runProfile(PrintWriter pw) throws RemoteException {
 816         final PrintWriter err = getErrPrintWriter();
 817         String profileFile = null;
 818         boolean start = false;
 819         boolean wall = false;
 820         int userId = UserHandle.USER_CURRENT;
 821         int profileType = 0;
 822         mSamplingInterval = 0;
 823         mStreaming = false;
 825         String process = null;
 827         String cmd = getNextArgRequired();
 828
 829         if ("start".equals(cmd)) {
 830             start = true;
 831             String opt;
 832             while ((opt=getNextOption()) != null) {
 833                 if (opt.equals("--user")) {
 834                     userId = UserHandle.parseUserArg(getNextArgRequired());
 835                 } else if (opt.equals("--wall")) {
 836                     wall = true;
 837                 } else if (opt.equals("--streaming")) {
 838                     mStreaming = true;
 839                 } else if (opt.equals("--sampling")) {
 840                     mSamplingInterval = Integer.parseInt(getNextArgRequired());
 841                 } else {
 842                     err.println("Error: Unknown option: " + opt);
 843                     return -1;
 844                 }
 845             }
 846             process = getNextArgRequired();
 847         } else if ("stop".equals(cmd)) {
 848             String opt;
 849             while ((opt=getNextOption()) != null) {
 850                 if (opt.equals("--user")) {
 851                     userId = UserHandle.parseUserArg(getNextArgRequired());
 852                 } else {
 853                     err.println("Error: Unknown option: " + opt);
 854                     return -1;
 855                 }
 856             }
 857             process = getNextArgRequired();
 858         } else {
 859             // Compatibility with old syntax: process is specified first.
 860             process = cmd;
 861             cmd = getNextArgRequired();
 862             if ("start".equals(cmd)) {
 863                 start = true;
 864             } else if (!"stop".equals(cmd)) {
 865                 throw new IllegalArgumentException("Profile command " + process + " not valid");
 866             }
 867         }
......
 877         if (start) {
 878             profileFile = getNextArgRequired();
 879             fd = openFileForSystem(profileFile, "w");
 880             if (fd == null) {
 881                 return -1;
 882             }
 883             profilerInfo = new ProfilerInfo(profileFile, fd, mSamplingInterval, false, mStreaming,
 884                     null, false);
 885         }
 886
 887         try {
 888             if (wall) {
 889                 // XXX doesn't work -- this needs to be set before booting.
 890                 String props = SystemProperties.get("dalvik.vm.extra-opts");
 891                 if (props == null || !props.contains("-Xprofile:wallclock")) {
 892                     props = props + " -Xprofile:wallclock";
 893                     //SystemProperties.set("dalvik.vm.extra-opts", props);
 894                 }
 895             } else if (start) {
 896                 //removeWallOption();
 897             }
 898             if (!mInterface.profileControl(process, userId, start, profilerInfo, profileType)) {
832-840行检查几个start参数
- --user:UserHandle里的id,默认为UserHandle.USER_CURRENT
- --wall:隐藏参数,虚拟机配置dalvik.vm.extra-opts : -Xprofile:wallclock
- --streaming:连续写文件
- --sampling:采样频率
847-857行检查stop参数,只有--user和process
858-867行是对旧命令参数的兼容。
878、879行拿到参数文件路径,获取fd,用于写profile到文件
883行,new一个辅助工具类ProfilerInfo,装载本次profile的一些信息参数,这里解释下构造函数参数
frameworks/base/core/java/android/app/ProfilerInfo.java
 33 public class ProfilerInfo implements Parcelable {
 38     public final String profileFile;//命令行传的文件路径
 41     public ParcelFileDescriptor profileFd;//上面文件的fd
 44     public final int samplingInterval;//数据采样间隔
 47     public final boolean autoStopProfiler;//app idle状态自动停止
 52     public final boolean streamingOutput;//是否连续输出到文件
 57     public final String agent;//代理
 66     public final boolean attachAgentDuringBind;//是否bind-application阶段或之前接入代理
 68     public ProfilerInfo(String filename, ParcelFileDescriptor fd, int interval, boolean autoStop,
 69             boolean streaming, String agent, boolean attachAgentDuringBind) {
回来继续,
888-896行是虚拟器参数wallclock的配置,此处注释掉了,没开放。wallclock与realtime是一起的,分别代表现实时间、机器运行时长。
898行是重点,在此方法中开始沟通java进程,开始profile抓取。mInterface还是AMS。
需要注意的是,profile抓取同上篇的am trace-ipc不太一致。profile的写文件是start后就开始写了,stop只是停止写。而am trace-ipc是先缓存在内存里,stop时再写到文件里。
ActivityManagerService.java#profileControl
frameworks/base/services/core/java/com/android/server/am/ActivityManagerService.java
18451     public boolean profileControl(String process, int userId, boolean start,
18452             ProfilerInfo profilerInfo, int profileType) throws RemoteException {
18453
18454         try {
18455             synchronized (this) {
18456                 // note: hijacking SET_ACTIVITY_WATCHER, but should be changed to
18457                 // its own permission.
18458                 if (checkCallingPermission(android.Manifest.permission.SET_ACTIVITY_WATCHER)
18459                         != PackageManager.PERMISSION_GRANTED) {
18460                     throw new SecurityException("Requires permission "
18461                             + android.Manifest.permission.SET_ACTIVITY_WATCHER);
18462                 }
18468                 ProcessRecord proc = null;
18469                 if (process != null) {
18470                     proc = findProcessLocked(process, userId, "profileControl");
18471                 }
18472
18477                 if (start) {
18478                     stopProfilerLocked(null, 0);
18479                     setProfileApp(proc.info, proc.processName, profilerInfo);
18480                     mProfileData.setProfileProc(proc);
18481                     mProfileType = profileType;
18482                     ParcelFileDescriptor fd = profilerInfo.profileFd;
18483                     try {
18484                         fd = fd.dup();
18485                     } catch (IOException e) {
18486                         fd = null;
18487                     }
18488                     profilerInfo.profileFd = fd;
18489                     proc.thread.profilerControl(start, profilerInfo, profileType);
18490                     fd = null;
18491                     try {
18492                         mProfileData.getProfilerInfo().profileFd.close();
18493                     } catch (IOException e) {
18494                     }
18495                     mProfileData.getProfilerInfo().profileFd = null;
18496
18497                     if (proc.pid == MY_PID) {
18502                         profilerInfo = null;
18503                     }
18504                 } else {
18505                     stopProfilerLocked(proc, profileType);
18506                     if (profilerInfo != null && profilerInfo.profileFd != null) {
18507                         try {
18508                             profilerInfo.profileFd.close();
18509                         } catch (IOException e) {
18458行鉴权。android.Manifest.permission.SET_ACTIVITY_WATCHER
18470行拿到ProcessRecord。这个方法入参是string,pid或者包名都是可以的。
18477的分支,需要注意18478行先停止上一次的profile,清空文件,然后才是本次的记录。
18479行,有个检查,需要设备是debug版本或者app是debug或者app设置了<profileable android:shell=["true" | "false"] android:enable=["true" | "false"] />才允许对该应用抓profile。参见官网链接:manifest/profileable-element
frameworks/base/services/core/java/com/android/server/am/ActivityManagerService.java
 8488     void setProfileApp(ApplicationInfo app, String processName, ProfilerInfo profilerInfo) {
 8490             boolean isDebuggable = "1".equals(SystemProperties.get(SYSTEM_DEBUGGABLE, "0"));
 8491             if (!isDebuggable) {
 8492                 if (!app.isProfileableByShell()) {
 8493                     throw new SecurityException("Process not debuggable, "
 8494                             + "and not profileable by shell: " + app.packageName);
 8495                 }
 8496             }
 8497             mProfileData.setProfileApp(processName);
对应到apk安装时的解析代码如下:
frameworks/base/core/java/android/content/pm/PackageParser.java
3335     private boolean parseBaseApplication(){
......
3463         if (sa.getBoolean(
3464                 com.android.internal.R.styleable.AndroidManifestApplication_debuggable,
3465                 false)) {
3466             ai.flags |= ApplicationInfo.FLAG_DEBUGGABLE;
3467             // Debuggable implies profileable
3468             ai.privateFlags |= ApplicationInfo.PRIVATE_FLAG_PROFILEABLE_BY_SHELL;
3469         }
......
3875             } else if (tagName.equals("profileable")) {
3876                 sa = res.obtainAttributes(parser,
3877                         com.android.internal.R.styleable.AndroidManifestProfileable);
3878                 if (sa.getBoolean(
3879                         com.android.internal.R.styleable.AndroidManifestProfileable_shell, false)) {
3880                     ai.privateFlags |= ApplicationInfo.PRIVATE_FLAG_PROFILEABLE_BY_SHELL;
3881                 }
回来继续,18479-18488行设置好进程,fd等信息
18489行binder ipc沟通java进程开始抓profile。下面转到对端跟踪
java进程
ActivityThread.java$ApplicationThread#profilerControl
frameworks/base/core/java/android/app/ActivityThread.java
 947     private class ApplicationThread extends IApplicationThread.Stub {
1169         @Override
1170         public void profilerControl(boolean start, ProfilerInfo profilerInfo, int profileType) {
1171             sendMessage(H.PROFILER_CONTROL, profilerInfo, start ? 1 : 0, profileType);
1172         }
-------------------------------------------------------------------------
1978                 case PROFILER_CONTROL:
1979                     handleProfilerControl(msg.arg1 != 0, (ProfilerInfo)msg.obj, msg.arg2);
1980                     break;
-------------------------------------------------------------------------
6375     private void handleBindApplication(AppBindData data) {
6394         mProfiler = new Profiler();
6395         String agent = null;
6396         if (data.initProfilerInfo != null) {
6397             mProfiler.profileFile = data.initProfilerInfo.profileFile;
6398             mProfiler.profileFd = data.initProfilerInfo.profileFd;
6399             mProfiler.samplingInterval = data.initProfilerInfo.samplingInterval;
6400             mProfiler.autoStopProfiler = data.initProfilerInfo.autoStopProfiler;
6401             mProfiler.streamingOutput = data.initProfilerInfo.streamingOutput;
6402             if (data.initProfilerInfo.attachAgentDuringBind) {
6403                 agent = data.initProfilerInfo.agent;
6404             }
6405         }
-------------------------------------------------------------------------
6047     final void handleProfilerControl(boolean start, ProfilerInfo profilerInfo, int profileType) {
6048         if (start) {
6049             try {
6050                 switch (profileType) {
6051                     default:
6052                         mProfiler.setProfiler(profilerInfo);
6053                         mProfiler.startProfiling();
6054                         break;
6055                 }
6056             } catch (RuntimeException e) {
6057                 Slog.w(TAG, "Profiling failed on path " + profilerInfo.profileFile
6058                         + " -- can the process access this path?");
6059             } finally {
6060                 profilerInfo.closeFd();
6061             }
6062         } else {
6063             switch (profileType) {
6064                 default:
6065                     mProfiler.stopProfiling();
6066                     break;
现在走到6047的handleProfilerControl方法,还是分start、stop。都是借助了6394行初始化的Profiler类。
需要关注的另外一点是6395、6403行这个代理,bindApplication阶段初始化的。
6047行的入参profileType上面传下来默认是0,但是这里空实现。
6053、6065行跟进
ActivityThread.java$Profiler#startProfiling
 875         public void startProfiling() {
 876             if (profileFd == null || profiling) {
 877                 return;
 878             }
 879             try {
 880                 int bufferSize = SystemProperties.getInt("debug.traceview-buffer-size-mb", 8);
 881                 VMDebug.startMethodTracing(profileFile, profileFd.getFileDescriptor(),
 882                         bufferSize * 1024 * 1024, 0, samplingInterval != 0, samplingInterval,
 883                         streamingOutput);
 884                 profiling = true;
 885             } catch (RuntimeException e) {
-------------------------------------------------------------------------
 895         public void stopProfiling() {
 896             if (profiling) {
 897                 profiling = false;
 898                 Debug.stopMethodTracing();
 899                 if (profileFd != null) {
 900                     try {
 901                         profileFd.close();
876行,没打开文件或者已经在抓了就退出
880行,profile默认抓8M,在AndroidStudio上我们可以改大,然后8.0以上的android没有限制文件大小。
所以这里命令行抓的限制可以设置属性规避,比如setprop debug.traceview-buffer-size-mb 32
大小限制的官网链接:Create, edit, or view a recording configuration
881行,最终是操作了虚拟机VMDebug.startMethodTracing。到此结束,虚拟机的内容就不跟了。
stopProfiling方法在898行同样是操作的虚拟机
frameworks/base/core/java/android/os/Debug.java
1370     /**
1371      * Stop method tracing.
1372      */
1373     public static void stopMethodTracing() {
1374         VMDebug.stopMethodTracing();
1375     }
二、使用
profile是啥、作用?
简单的说,一个进程的所有方法调用记录,也就是火焰图。在Android世界里,分为java的profile与native的perf。
1、确认进程的动作,走了哪些方法流程
2、确认方法耗时与压力,哪些方法操作重、调用频繁
本问题,在官方文档上有更详细的介绍解释和AndroidStudio profiler操作指导:AndroidStudio Profile
本文的am profile是抓java profile的命令行操作入口。
命令提示
generic_x86_64:/ # am
Activity manager (activity) commands:
......
  profile start [--user <USER_ID> current]
          [--sampling INTERVAL | --streaming] <PROCESS> <FILE>
      Start profiler on a process.  The given <PROCESS> argument
        may be either a process name or pid.  Options are:
      --user <USER_ID> | current: When supplying a process name,
          specify user of process to profile; uses current user if not
          specified.
      --sampling INTERVAL: use sample profiling with INTERVAL microseconds
          between samples.
      --streaming: stream the profiling output to the specified file.
  profile stop [--user <USER_ID> current] <PROCESS>
      Stop profiler on a process.  The given <PROCESS> argument
        may be either a process name or pid.  Options are:
      --user <USER_ID> | current: When supplying a process name,
          specify user of process to profile; uses current user if not
          specified.
使用示例
generic_x86_64:/ # am profile start com.example.myapplication /data/local/tmp/example_profile.trace
##############做操作##############
generic_x86_64:/ # am profile stop com.example.myapplication
:~/$ adb pull /data/local/tmp/example_profile.trace
抓完pull下来之后,用AndroidStudio里的profiler打开,或者单独的SDK里的profiler工具打开,操作路径:profiler-->SESSIONS-->"+"-->Load form file。旧的SDK里DDMS也是可以打开解析的。
打开的效果贴张图:
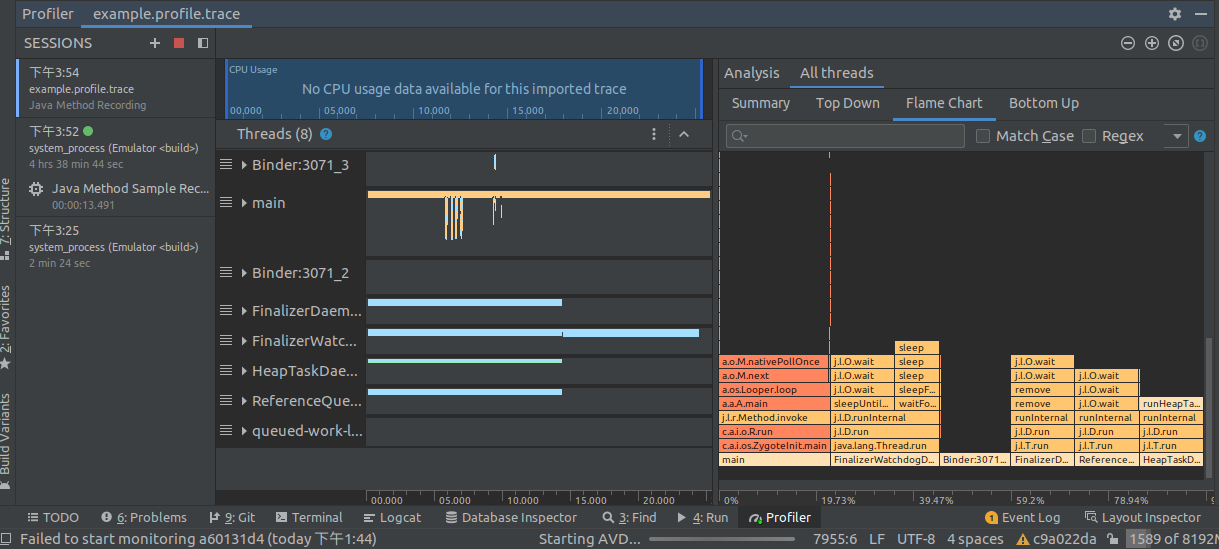
每个线程一份trace记录,如果用于流程调试,主要关注右上角的Flame Chart页,也就是火焰图。
三、总结
同之前的am trace-ipc命令类似,也是AMS将命令分发到应用进程。实现上是借助了以下两个方法操作虚拟机,开启、关闭profile trace记录:
VMDebug.startMethodTracing()
VMDebug.stopMethodTracing()
需要关注的有
这是一种命令行抓profile的入口,还有其他命令也可以抓:am start [options] intent --start-profiler和pm dump-profiles,实现上一样。UI界面的直接看AndroidStudio官方文档Inspect CPU activity with CPU Profiler
记录的是java进程中所有线程的trace,native的可以参考【译】Simpleperf分析之Android系统篇。
文件大小默认8M,可通过属性调节debug.traceview-buffer-size-mb
本文来自博客园,作者:秋城,转载请注明原文链接:https://www.cnblogs.com/wanghongzhu/p/15077161.html

 浙公网安备 33010602011771号