import numpy as np
import matplotlib.pyplot as plt
import matplotlib
matplotlib.rcParams['font.family'] = 'SimHei'
matplotlib.rcParams['font.sans-serif'] = ['SimHei']
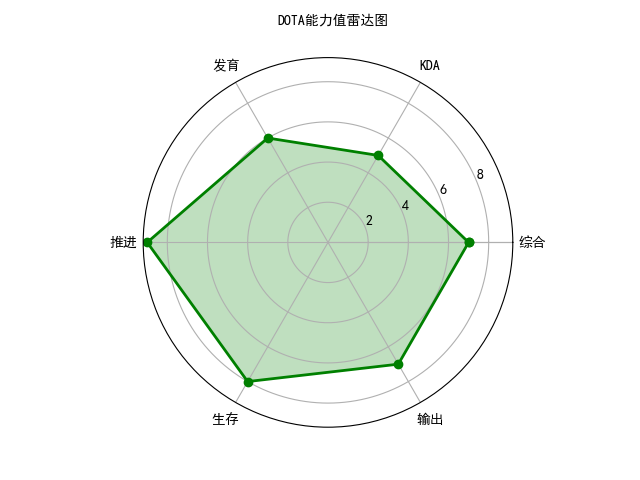
lables = np.array(['综合','KDA','发育','推进','生存','输出'])
nAttr = 6
date = np.array([7, 5, 6, 9, 8, 7])
angles = np.linspace(0, 2*np.pi, nAttr, endpoint=False)
date = np.concatenate((date, [date[0]]))
angles = np.concatenate((angles, [angles[0]]))
fig = plt.figure(facecolor="white")
plt.subplot(111, polar=True)
plt.plot(angles, date, 'bo-', color = 'g', linewidth = 2)
plt.fill(angles, date, facecolor = 'g', alpha = 0.25)
plt.thetagrids(angles*180/np.pi, lables)
plt.figtext(0.52, 0.95, 'DOTA能力值雷达图', ha='center')
plt.grid(True)
plt.savefig('dota_radar.JPG')
plt.show()
效果图:
![]()

 浙公网安备 33010602011771号