聚类
目录
1. 10种比较流行的聚类算法
有许多不同的聚类算法,对于所有数据集没有单一的最佳方法。
10种比较流行的聚类算法:
| 亲和力传播 | 聚合聚类 | BIRCH | DBSCAN | K-均值 |
| Mini-Batch K-均值 | Mean Shift | OPTICS | 光谱聚类 | 高斯混合 |
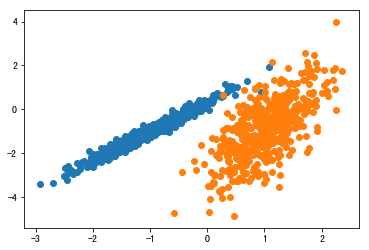
用 make _ classification ()函数创建一个测试二分类数据集
# 综合分类数据集
from numpy import where
from sklearn.datasets import make_classification
from matplotlib import pyplot
# 定义数据集
X, y = make_classification(n_samples=1000, n_features=2, n_informative=2,
                           n_redundant=0, n_clusters_per_class=1, random_state=4)
# 为每个类的样本创建散点图
for class_value in range(2):
    # 获取此类的示例的行索引
    row_ix = where(y == class_value)
    # 创建这些样本的散布
    pyplot.scatter(X[row_ix, 0], X[row_ix, 1])
# 绘制散点图
pyplot.show()
!!!!注意代码的缩进
1.1 亲和力传播聚类
亲和力传播包括找到一组最能概括数据的范例。
我们设计了一种名为“亲和传播”的方法,它作为两对数据点之间相似度的输入度量。在数据点之间交换实值消息,直到一组高质量的范例和相应的群集逐渐出现
——源自:《通过在数据点之间传递消息》2007。
它是通过 AffinityPropagation 类实现的,要调整的主要配置是将“ 阻尼 ”设置为0.5到1,甚至可能是“首选项”。
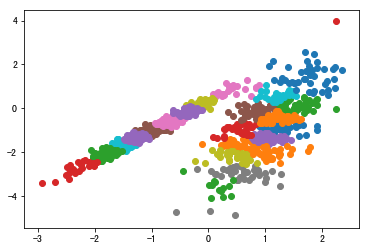
# 亲和力传播聚类
from numpy import unique
from numpy import where
from sklearn.datasets import make_classification
from sklearn.cluster import AffinityPropagation
from matplotlib import pyplot
# 定义数据集
X, _ = make_classification(n_samples=1000, n_features=2, n_informative=2,
                           n_redundant=0, n_clusters_per_class=1, random_state=4)
# 定义模型
model = AffinityPropagation(damping=0.9)
# 匹配模型
model.fit(X)
# 为每个示例分配一个集群
yhat = model.predict(X)
# 检索唯一群集
clusters = unique(yhat)
# 为每个群集的样本创建散点图
for cluster in clusters:
    # 获取此群集的示例的行索引
    row_ix = where(yhat == cluster)
    # 创建这些样本的散布
    pyplot.scatter(X[row_ix, 0], X[row_ix, 1])
# 绘制散点图
pyplot.show()
运行该示例符合训练数据集上的模型,并预测数据集中每个示例的群集。然后创建一个散点图,并由其指定的群集着色。在这种情况下,我无法取得良好的结果。
1.2 聚合聚类
1.3 BIRCH聚类
1.4 DBSCAN聚类
1.5 K-均值聚类
1.6 Mini-Batch K-均值
1.7 Mean Shift
1.8 OPTICS聚类
1.9 光谱聚类
1.10 高斯混合
2. 基于聚类的图像分割
cluster-based-segmentation
图像分割大致分为2大类:语义分割和实例分割。
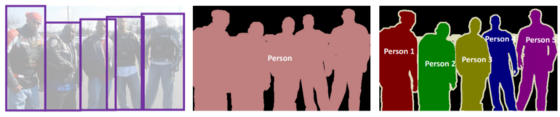
检测到的对象 — 语义段 — 实例段
● 基于区域的分割
● 基于边缘检测的分割
● 基于聚类的分割【聚类算法用于将彼此更相似的数据点从其他组数据点更紧密地分组。】
● 基于CNN的分割
● etc
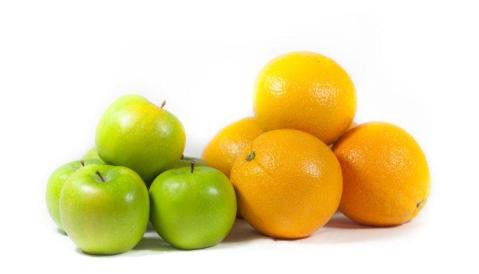
apple-orange.jpg
from skimage.io import imread
from skimage.color import rgb2gray
import numpy as np
import matplotlib.pyplot as plt
%matplotlib inline
from scipy import ndimage
# Scaling the image pixels values within 0-1
img = imread('./apple-orange.jpg') / 255
plt.imshow(img)
plt.title('Original')
plt.show()
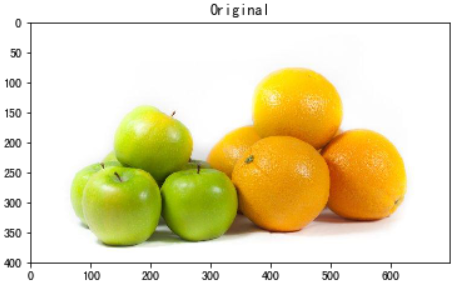
用来自 scikit-learn 的 K 均值算法对它们进行聚类
# For clustering the image using k-means,
# we first need to convert it into a 2-dimensional array
image_2D = img.reshape(img.shape[0]*img.shape[1], img.shape[2])
# Use KMeans clustering algorithm from sklearn.cluster
# to cluster pixels in image
from sklearn.cluster import KMeans
# tweak the cluster size and see what happens to the Output
kmeans = KMeans(n_clusters=5, random_state=0).fit(image_2D)
clustered = kmeans.cluster_centers_[kmeans.labels_]
# Reshape back the image from 2D to 3D image
clustered_3D = clustered.reshape(img.shape[0], img.shape[1], img.shape[2])
plt.imshow(clustered_3D)
plt.title('Clustered Image')
plt.show()
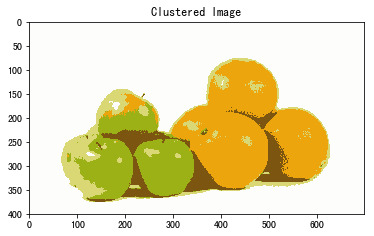
效果非常好,我们能够将五个部分组合在一起,这就是聚类分割的工作原理。目前有许多先进的技术,例如 Mask R-CNN,可以进行更细粒度的分割。


 浙公网安备 33010602011771号