from keras.datasets import boston_housing
import numpy as np
from keras import models
from keras import layers
import matplotlib.pyplot as plt
#x,13个特征,一共404条数据
#y,连续值标签,单位是千美元
(x_train, y_train), (x_test, y_test) = boston_housing.load_data()
#对数据做原处理,特征标准化
#每个特征减去平均值,除以标准差,得到的特征平均值为0,标准差为1
avg = x_train.mean(axis=0)
x_train -= avg
std = np.std(x_train,axis=0)
x_train /=std
network = models.Sequential()
network.add(layers.Dense(64,activation='relu'))
network.add(layers.Dense(64,activation='relu'))
network.add(layers.Dense(1))
#mse均方误差,预测值与目标值差的平方
#mae平均绝对误差,预测值与目标值差的绝对值
network.compile(optimizer='rmsprop',loss='mse',metrics=['mae'])
history = network.fit(x_train,y_train,batch_size=16,epochs=80,validation_split=0.1)
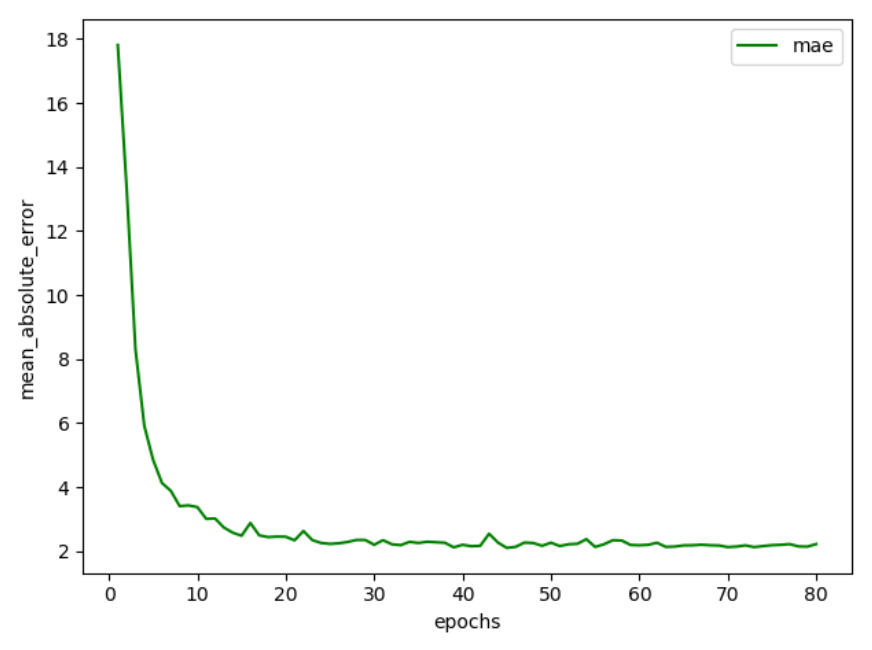
mae = history.history['val_mean_absolute_error']
epochs = range(1,81)
#loss的图
plt.plot(epochs,mae,'g',label = 'mae')
plt.xlabel('epochs')
plt.ylabel('mean_absolute_error')
#显示图例
plt.legend()
plt.show()
![]()

 浙公网安备 33010602011771号