新一代监控神器Prometheus+Grafana介绍及使用
一、介绍
1.什么是Prometheus?
普罗米修斯是一个开源的系统监控及报警工具,在2016年加入了 Cloud Native Computing Foundation,是继Kubernetes之后的第二个托管项目。
2.Prometheus的特征有什么?
- 具有由metric名称和键值对标示的时间序列数据的多位数据模型
- 有一个灵活的查询语言promQL
- 不依赖分布式存储,只和本地磁盘有关
- 通过HTTP来拉取(pull)时间序列数据
- 也支持推送(push)方式添加时间序列数据
- 多种图形和仪表盘支持
3.Prometheus的组件都有哪些?来张官方图:

- Prometheus Server 用于定时抓取数据指标(metrics)、存储时间序列数据(TSDB)
- Jobs/exporte 收集被监控端数据并暴露指标给Prometheus
- Pushgateway 监控端的数据会用push的方式主动传给此组件,随后被Prometheus 服务定时pull此组件数据即可
- Alertmanager 报警组件,可以通过邮箱、微信等方式
- Web UI 用于多样的UI展示,一般为Grafana
- 还有一些例如配置自动发现目标的小组件和后端存储组件
4.什么时候使用Prometheus
- 监控的对象动态可变,无法预先配置的时候
- Prometheus 是专为云环境(k8s/docker)提供的监控工具
- 想要更直观更简单的直接观察某项指标的数据变化时
5.看到一个写的非常不错的关Prometheus存储的文章
https://www.cnblogs.com/zqj-blog/p/12205063.html
二、搭建
1.安装Prometheus
官网下载地址:https://prometheus.io/download/ 选择自己所需版本即可
## 解压安装
tar zxf prometheus-2.22.0.linux-amd64.tar.gz -C /opt/vfan/
mv prometheus-2.22.0.linux-amd64 prometheus-2.22.0
cd prometheus-2.22.0/

## 可以通过--help或--version查看服务启动参数和版本等
./prometheus --help
./prometheus --version

## 启动服务,并指定配置文件
nohup ./prometheus --config.file="prometheus.yml" &> /dev/null &

## 查看端口占用情况(默认9090)
[root@VM-0-10-centos prometheus-2.22.0]# ss -tnlp
State       Recv-Q Send-Q                                  Local Address:Port                                                 Peer Address:Port
LISTEN      0      50                                                  *:3306                                                            *:*                   users:(("mysqld",pid=28673,fd=14))
LISTEN      0      128                                                 *:22                                                              *:*                   users:(("sshd",pid=1306,fd=3))
LISTEN      0      128                                                :::80                                                             :::*                   users:(("httpd",pid=31980,fd=4),("httpd",pid=31851,fd=4),("httpd",pid=30055,fd=4),("httpd",pid=21050,fd=4),("httpd",pid=14509,fd=4),("httpd",pid=12678,fd=4),("httpd",pid=12676,fd=4),("httpd",pid=9731,fd=4),("httpd",pid=9678,fd=4),("httpd",pid=2718,fd=4),("httpd",pid=1430,fd=4))
LISTEN      0      128                                                :::9090                                                           :::*                   users:(("prometheus",pid=11771,fd=10))
docker run \
    -p 9090:9090 \
    -v /path/to/prometheus.yml:/etc/prometheus/prometheus.yml \
    prom/prometheus
查看默认prometheus.yml文件:vim prometheus.yml
# my global config
global:
  scrape_interval:     15s # Set the scrape interval to every 15 seconds. Default is every 1 minute.
  evaluation_interval: 15s # Evaluate rules every 15 seconds. The default is every 1 minute.
  # scrape_timeout is set to the global default (10s).

# Alertmanager configuration
alerting:
  alertmanagers:
  - static_configs:
    - targets:
      # - alertmanager:9093

# Load rules once and periodically evaluate them according to the global 'evaluation_interval'.
rule_files:
  # - "first_rules.yml"
  # - "second_rules.yml"

# A scrape configuration containing exactly one endpoint to scrape:
# Here it's Prometheus itself.
scrape_configs:
  # The job name is added as a label `job=<job_name>` to any timeseries scraped from this config.
  - job_name: 'prometheus'

    # metrics_path defaults to '/metrics'
    # scheme defaults to 'http'.

    static_configs:
    - targets: ['localhost:9090']
目前只在监控Prometheus本机
可以登录普罗米修斯(服务器ip:9090)web界面,Status—>Rules下查看目前正在监控的目标
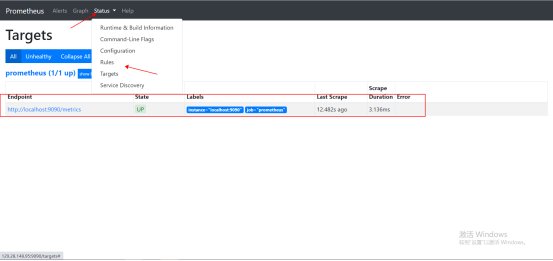
可以看到获取监控信息的终点是 本机ip+端口+/metrics:

也可以查看监控图形:Graph—>选择监控项—>Execute
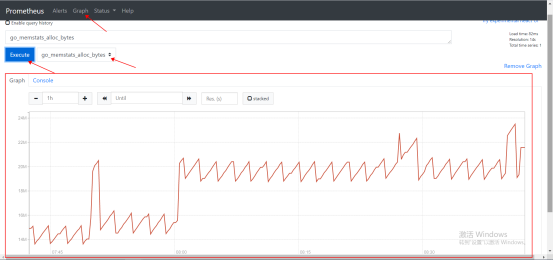
这种图形界面显然不太直观,所以引入Grafana。
2.安装node-exporter插件,添加监控机器
下载链接:https://prometheus.io/download/ 选择自己所需版本即可
## 解压安装
tar zxf node_exporter-1.0.1.linux-amd64.tar.gz -C /opt/vfan/
mv node_exporter-1.0.1.linux-amd64 node_exporter
cd node_exporter/

## 可以查看服务启动参数
./node_exporter --help
    --web.listen-address=":9100"    #可以指定监听端口
    --collector.ntp.server="127.0.0.1"  #可以指定ntp server

## 直接执行即可,--web.listen-address参数可以指定监听端口,默认9100。
nohup ./node_exporter --web.listen-address=":9100" &> /dev/null &

[root@VM-0-10-centos node_exporter]# ss -tnlp
State       Recv-Q Send-Q                                  Local Address:Port                                                 Peer Address:Port
LISTEN      0      50                                                  *:3306                                                            *:*                   users:(("mysqld",pid=28673,fd=14))
LISTEN      0      128                                                 *:22                                                              *:*                   users:(("sshd",pid=1306,fd=3))
LISTEN      0      128                                                :::9100                                                           :::*                   users:(("node_exporter",pid=26134,fd=3))
LISTEN      0      128                                                :::80                                                             :::*                   users:(("httpd",pid=31980,fd=4),("httpd",pid=31851,fd=4),("httpd",pid=30055,fd=4),("httpd",pid=21050,fd=4),("httpd",pid=14509,fd=4),("httpd",pid=12678,fd=4),("httpd",pid=12676,fd=4),("httpd",pid=9731,fd=4),("httpd",pid=9678,fd=4),("httpd",pid=2718,fd=4),("httpd",pid=1430,fd=4))
LISTEN      0      128
prometheus.yaml中添加node_exporter配置
scrape_configs:
  # The job name is added as a label `job=<job_name>` to any timeseries scraped from this config.
  - job_name: 'prometheus'

    # metrics_path defaults to '/metrics'
    # scheme defaults to 'http'.

    static_configs:
    - targets: ['localhost:9090']

  - job_name: 'node_demo1'
    static_configs:
    - targets: ['localhost:9100']
然后重启普罗米修斯服务,重启后再次查看监控目标:
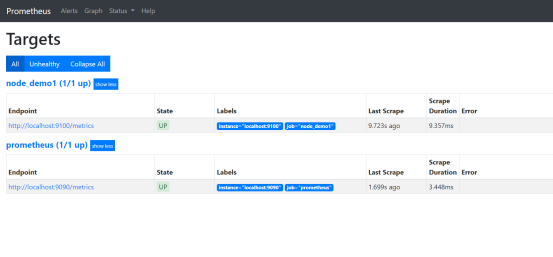
已经开始监控新的node
3.安装Grafana
下载链接:https://grafana.com/grafana/download
wget https://dl.grafana.com/oss/release/grafana-7.2.2.linux-amd64.tar.gz

## 解压安装
tar zxf grafana-7.2.2.linux-amd64.tar.gz -C /opt/vfan/
cd grafana-7.2.2

## 查看启动参数
./grafana-server --help

## 启动服务,默认端口3000
nohup ./grafana-server &> /dev/null &

[root@VM-0-10-centos conf]# ss -tnlp
State       Recv-Q Send-Q                                  Local Address:Port                                                 Peer Address:Port
LISTEN      0      50                                                  *:3306                                                            *:*                   users:(("mysqld",pid=28673,fd=14))
LISTEN      0      128                                                 *:22                                                              *:*                   users:(("sshd",pid=1306,fd=3))
LISTEN      0      128                                                :::9100                                                           :::*                   users:(("node_exporter",pid=26134,fd=3))
LISTEN      0      128                                                :::80                                                             :::*                   users:(("httpd",pid=31980,fd=4),("httpd",pid=31851,fd=4),("httpd",pid=30055,fd=4),("httpd",pid=21050,fd=4),("httpd",pid=14509,fd=4),("httpd",pid=12678,fd=4),("httpd",pid=12676,fd=4),("httpd",pid=9731,fd=4),("httpd",pid=9678,fd=4),("httpd",pid=2718,fd=4),("httpd",pid=1430,fd=4))
LISTEN      0      128                                                :::3000                                                           :::*                   users:(("grafana-server",pid=31050,fd=10))
LISTEN      0      128
Grafana默认的配置文件为:vim grafana-7.2.2/conf/defaults.ini;主要有监听端口、日志路径、默认登录帐号密码等
[server]
# Protocol (http, https, h2, socket)
protocol = http

# The ip address to bind to, empty will bind to all interfaces
http_addr =

# The http port to use
http_port = 3000

# The public facing domain name used to access grafana from a browser
domain = localhost

[security]
# disable creation of admin user on first start of grafana
disable_initial_admin_creation = false

# default admin user, created on startup
admin_user = admin

# default admin password, can be changed before first start of grafana, or in profile settings
admin_password = admin
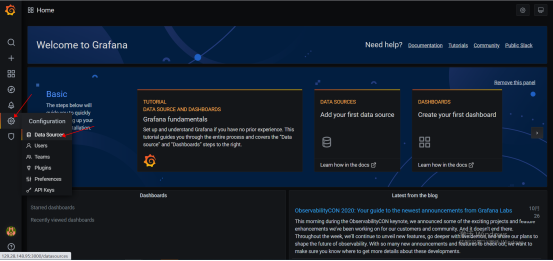
现在可以通过ip+端口方式来访问Grafana:
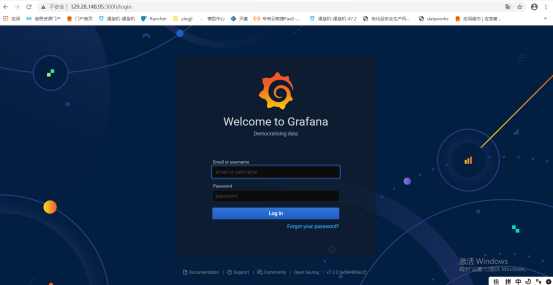
第一次登陆会强制性修改密码,修改后即可进入
4.配置Grafana,增加可视化模板
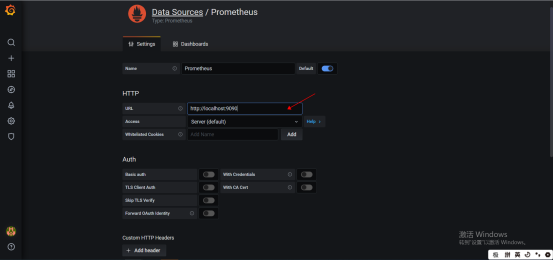
第一步:添加数据源
选择Prometheus,只需将URL修改为Prometheus服务地址,其余默认即可(也可自行修改):
可以将Prometheus服务及Grafana服务的监控模板导入进去:
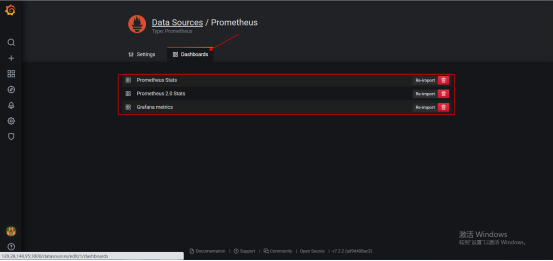
但要注意,导入Grafana的模板后,要在Prometheus.yml增加Grafana的监控:vim prometheus.yml
scrape_configs:
  - job_name: 'grafana'
    static_configs:
    - targets: ['localhost:3000']
点击保存,保存后查看数据源:

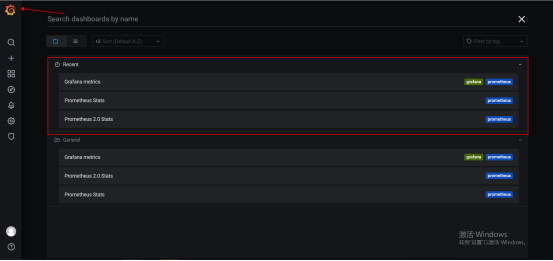
查看刚刚导入的模板,已经形成监控图形:
至此,Prometheus+Grafana基本组件搭建完成。
三、配置Grafana模板,配合Prometheus使用
1、监控系统指标
前提条件:
- 被监控的主机系统上已经安装node_exporter
- Prometheus.yml中已经添加此主机的Job
也就是以上第二步的第2点
前提条件准备完毕后,我们可以找一些实用且直观的模板来直接套用,不仅可以节省时间成本,实际效果也相当不错,如果有什么地方不能满足自己的需求,还可以在此基础上修改:
前往Grafana的官网下载Dashboard模板:https://grafana.com/grafana/dashboards
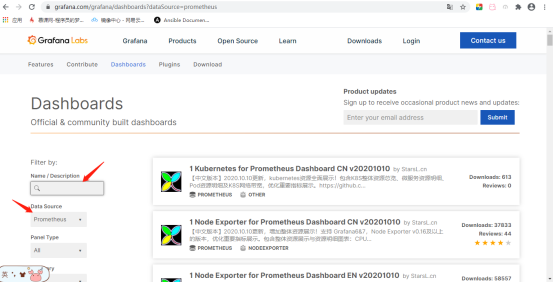
选择Prometheus,再根据关键字搜索
(1).点进去一个node_exporter的模板,可以查看样图,然后直接下载JSON文件

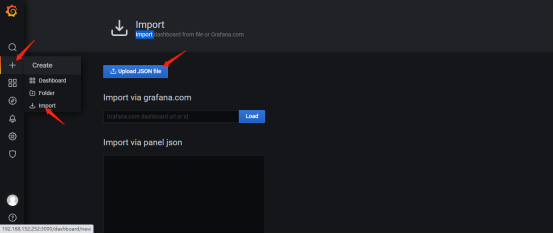
(2).点击加号—>import—>Upload JSON file
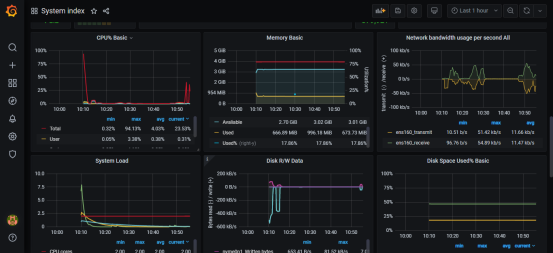
(3).模板导入后,即可进行监控
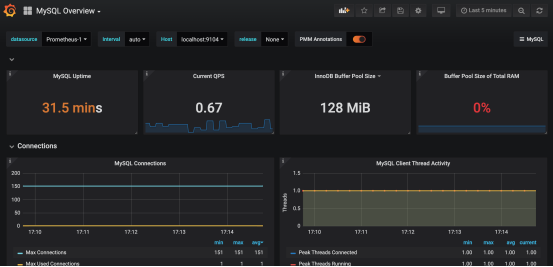
2、监控mysql服务各项指标
(1).Prometheus官网提供了mysqld的metric指标采集插件,可以直接下载:https://github.com/prometheus/mysqld_exporter/releases/download/v0.12.1/mysqld_exporter-0.12.1.linux-amd64.tar.gz
## 解压即可
tar zxf mysqld_exporter-0.12.1.linux-amd64.tar.gz
(2).下载安装完毕后,启动前,需要在mysql中创建一个Prometheus收集数据的账号:
mysql> create user 'promethues'@'localhost' IDENTIFIED BY 'promethues1';
Query OK, 0 rows affected (0.00 sec)

mysql> grant select,replication client,process on *.* to 'promethues'@'localhost';
Query OK, 0 rows affected (0.00 sec)

mysql> flush privileges;
Query OK, 0 rows affected (0.00 sec)
注意:这里的的localhost不是指mysqld服务的ip,是指mysqld_exporter的ip,因为promethues服务来找mysqld获取数据时,是先找到mysqld_exporter,然后mysqld_exporter再去mysqld获取数据。所以要保证mysqld_exporter的ip可以连接mysqld服务。
(3).在mysqld_exporter组件中配置mysql信息
创建一个保存mysql用户名密码的文件:vim mysqld_exporter/.my.cnf
[client]
user=promethues
password=promethues1
(4).启动mysqld_exporter组件,配置promethues.yml,并指定mysql账号信息文件
## 可以查看一些启动信息
./mysqld_exporter --help

## 启动,指定端口号,默认9104,指定连接mysql的用户文件
nohup ./mysqld_exporter --web.listen-address=":9104" --config.my-cnf=".my.cnf" &> /dev/null  &
## 添加以下配置:vim prometheus.yml
- job_name: 'mysqld'
    static_configs:
    - targets: ['localhost:9104']
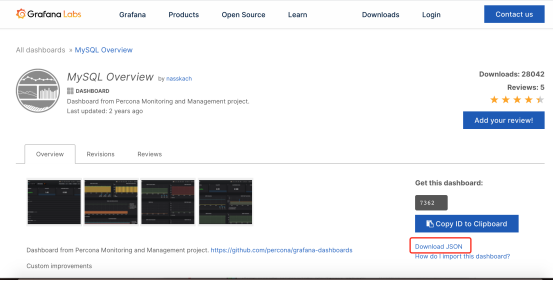
(5).并在Grafana添加mysqld模板
然后还是前往Grafana查找自己喜欢的模板:
以上只是简单演示了两个比较常用的插件,普罗米修斯官方还有许多插件可供使用。大家可慢慢研究。下文也将介绍Prometheus监控K8S集群的手段。

 浙公网安备 33010602011771号