
Prometheus监控docker容器
Prometheus监控docker容器
监控服务器 需要安装4个服务
- Prometheus Server(普罗米修斯监控主服务器 )
- Node Exporter (收集Host硬件和操作系统信息)
- cAdvisor (负责收集Host上运行的容器信息)
- Grafana (展示普罗米修斯监控界面)
被监控的只有安装2个
- Node Exporter (收集Host硬件和操作系统信息)
- cAdvisor (负责收集Host上运行的容器信息)
1.安装Node Exporter 来收集硬件信息
所有节点运行以下命令安装Node Exporter 容器
docker run -d -p 59100:9100 \
-v "/proc:/host/proc" \
-v "/sys:/host/sys" \
-v "/:/rootfs" \
-v "/etc/localtime:/etc/localtime" \
--name=node-exporter \
prom/node-exporter
2.安装cAdvisor 来收集容器信息
所有节点运行以下命令来安装cAdvisor
docker run -d \
--volume=/:/rootfs:ro \
--volume=/var/run:/var/run:rw \
--volume=/sys:/sys:ro \
--volume=/var/lib/docker/:/var/lib/docker:ro \
--publish=58080:8080 \
--detach=true \
--name=cadvisor \
-v "/etc/localtime:/etc/localtime" \
google/cadvisor:latest
3.安装普罗米修斯服务
首先在本地创建prometheus.yml这是普罗米修斯的配置文件
将下方内容写入到文件中,将监听的地址改为自己本机地址
mkdir -p /data/prometheus
vim /data/prometheus/prometheus.yml
# my global config
global:
  scrape_interval:     15s # Set the scrape interval to every 15 seconds. Default is every 1 minute.
  evaluation_interval: 15s # Evaluate rules every 15 seconds. The default is every 1 minute.
  # scrape_timeout is set to the global default (10s).


# Alertmanager configuration
alerting:
  alertmanagers:
  - static_configs:
    - targets:
      # - alertmanager:9093


# Load rules once and periodically evaluate them according to the global 'evaluation_interval'.
rule_files:
  # - "first_rules.yml"
  # - "second_rules.yml"


# A scrape configuration containing exactly one endpoint to scrape:
# Here it's Prometheus itself.
scrape_configs:
  # The job name is added as a label `job=<job_name>` to any timeseries scraped from this config.
  - job_name: 'prometheus'


    # metrics_path defaults to '/metrics'
    # scheme defaults to 'http'.


    static_configs:
    #监听的地址
    - targets: ['localhost:59090','localhost:59100']


  - job_name: 'dev-base1'
    static_configs:
    - targets: ['xxx.xxx.xxx.xxx:58080','xxx.xxx.xxx.xxx:59100']


  - job_name: 'dev-base2'
    static_configs:
    - targets: ['xxx.xxx.xxx.xxx:58080','xxx.xxx.xxx.xxx:59100']
当Prometheus容器启动成功后访问http://localhost:59090

4.在DockerMachine上运行Grafana
docker run -d -i -p 53000:3000 \
-v "/etc/localtime:/etc/localtime" \
-e "GF_SERVER_ROOT_URL=http://grafana.dev.abc.com" \
-e "GF_SECURITY_ADMIN_PASSWORD=123456" \
grafana/grafana
Grafana启动后,在浏览器中打开http://localhost:53000/登录界面,登录用admin 密码为刚创建Grafana时的123456
Grafana使用
一、添加普罗米修斯服务器,重点看框部分,其它默认即可

如果一切顺利该DataSource可以正常工作了,也就是说Grafana可以正常跟Prometheus正常通信了,接下来通过dashboard展示数据。
自己手工创建dashboard有点困难,可以借助开元的力量访问 监控模板地址 将会看到很多用于监控 Docker 的 Dashboard。监控模板地址(多种监控模板根据自己需求下载不同的模板)
二、使用第三方仪表盘监控实现
注:需提前添加好数据源。
1.点击左上角的加号,点击import

在线模式

三、效果展示

四、配置报警
我们已经能够对收集的数据,通过grafana展示出来了,能查看数据。想一想,系统还缺失什么功能?
监控最重要的目的是什么?
-
第一:监控系统是否正常
-
第二:系统不正常时,可以告知相关人员及时的排查和解除问题,这就是告警通知。
所以,还缺一个告警通知的模块。
prometheus的告警机制由2部分组成:
-
告警规则prometheus会根据告警规则rule_files,将告警发送给Alertmanager
-
管理告警和通知模块是Alertmanager。它负责管理告警,去除重复的数据,告警通知。通知方式有很多如Email、HipChat、Slack、WebHook等等。
配置#
1.告警规则配置#
告警文档地址:告警规则官方文档。
我们新创建一个规则文件:alert_rules.yml,把它和prometheus.yml放在一起,官方有一个模板 Templating,直接copy过来:
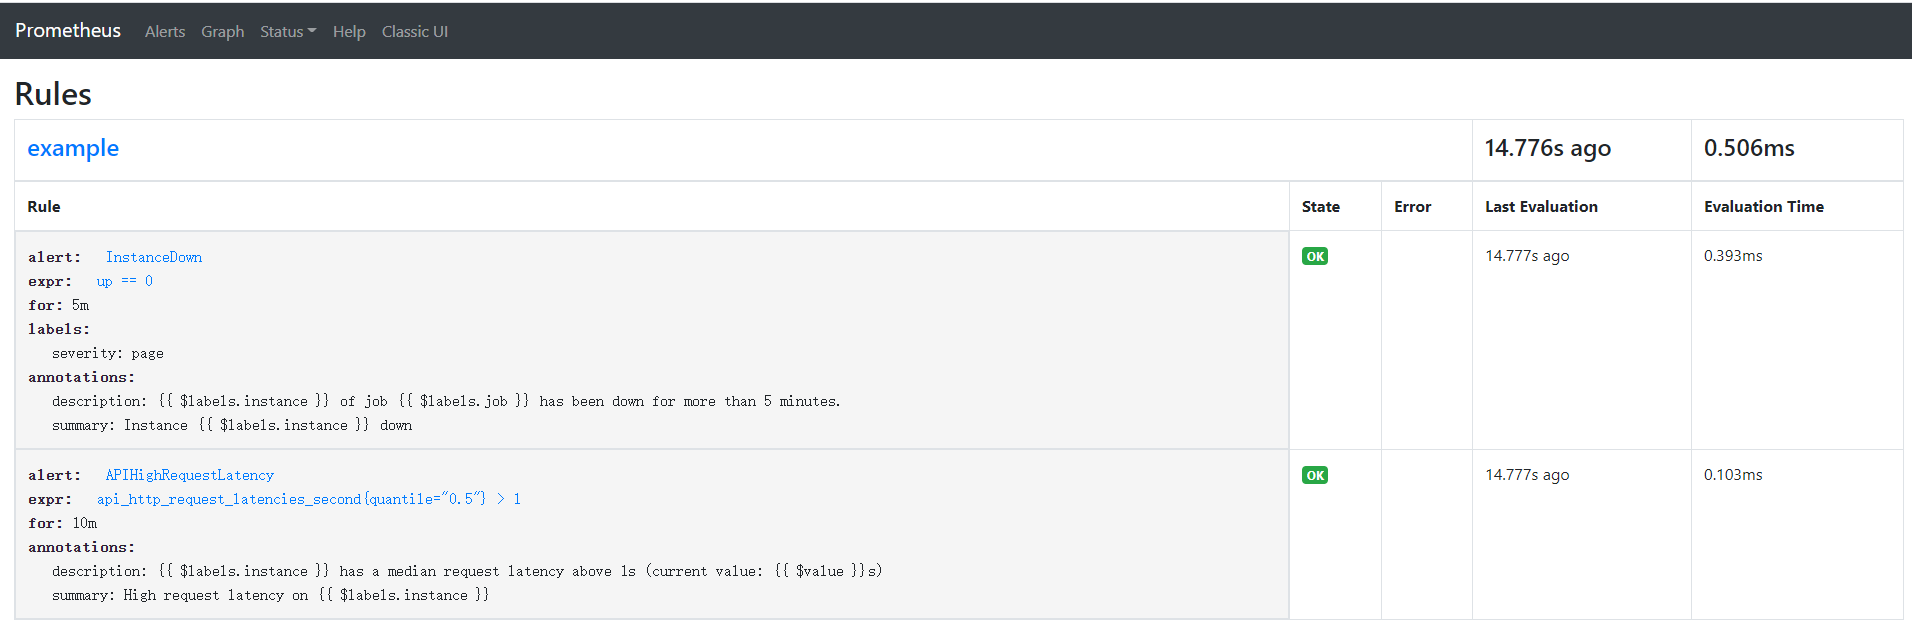
groups:
- name: example
  rules:


  # Alert for any instance that is unreachable for >5 minutes.
  - alert: InstanceDown
    expr: up == 0
    for: 5m
    labels:
      severity: page
    annotations:
      summary: "Instance {{ $labels.instance }} down"
      description: "{{ $labels.instance }} of job {{ $labels.job }} has been down for more than 5 minutes."


  # Alert for any instance that has a median request latency >1s.
  - alert: APIHighRequestLatency
    expr: api_http_request_latencies_second{quantile="0.5"} > 1
    for: 10m
    annotations:
      summary: "High request latency on {{ $labels.instance }}"
      description: "{{ $labels.instance }} has a median request latency above 1s (current value: {{ $value }}s)"
上面规则文件大意:就是创建了2条alert规则 alert: InstanceDown 和 alert: APIHighRequestLatency :
-
InstanceDown 就是实例宕机(up==0)触发告警,5分钟后告警(for: 5m);
-
APIHighRequestLatency 表示有一半的 API 请求延迟大于 1s 时(api_http_request_latencies_second{quantile="0.5"} > 1)触发告警
更多rules规则说明,请看这里 recording_rules。
然后把alrt_rules.yml添加到prometheus.yml 里:

我们要把alert_rules.yml规则映射到docker里:
先用docker ps查看prometheus容器ID, CONTAINER ID: ac99a89d2db6, 停掉容器 docker stop ac99,然后删掉这个容器 docker rm ac99。
重新启动容器:
docker run -d -p 59090:9090 \
-v /data/prometheus/prometheus.yml:/etc/prometheus/prometheus.yml \
-v "/etc/localtime:/etc/localtime" \
-v /data/prometheus/alert_rules.yml:/etc/prometheus/alert_rules.yml \
--name prometheus \
prom/prometheus
启动时主要添加这个参数:-v /data/prometheus/alert_rules.yml:/etc/prometheus/alert_rules.yml
然后在浏览器上查看,rules是否添加成功,在浏览器上输入地址 http://localhost:59090/rules
也可以查看alers情况,点击菜单 Alerts:

docker run -d -p 59093:9093 --name Alertmanager -v /data/prometheus/alertmanager.yml:/etc/alertmanager/alertmanager.yml docker.io/prom/alertmanager:latest
[root@devmaster2 prometheus]# cat alertmanager.yml

global:
  resolve_timeout: 5m
  smtp_smarthost: 'smtp.sina.com:465'
  smtp_from: '1916989848@qq.com'
  smtp_auth_username: 'user_sunli@sina.com'
  smtp_auth_password: 'xxxxxxxxxxxx'
  smtp_require_tls: false

route:
  receiver: team-test-mails
  group_by: ['alertname']
  group_wait: 30s
  group_interval: 1m
  repeat_interval: 2m


receivers:
  - name: 'team-test-mails'
    email_configs:
    - to: 'sunli@bdszh.vip'
      send_resolved: true


 浙公网安备 33010602011771号