echarts 柱状图 鼠标悬浮自定义 tooltips 自定义
效果:
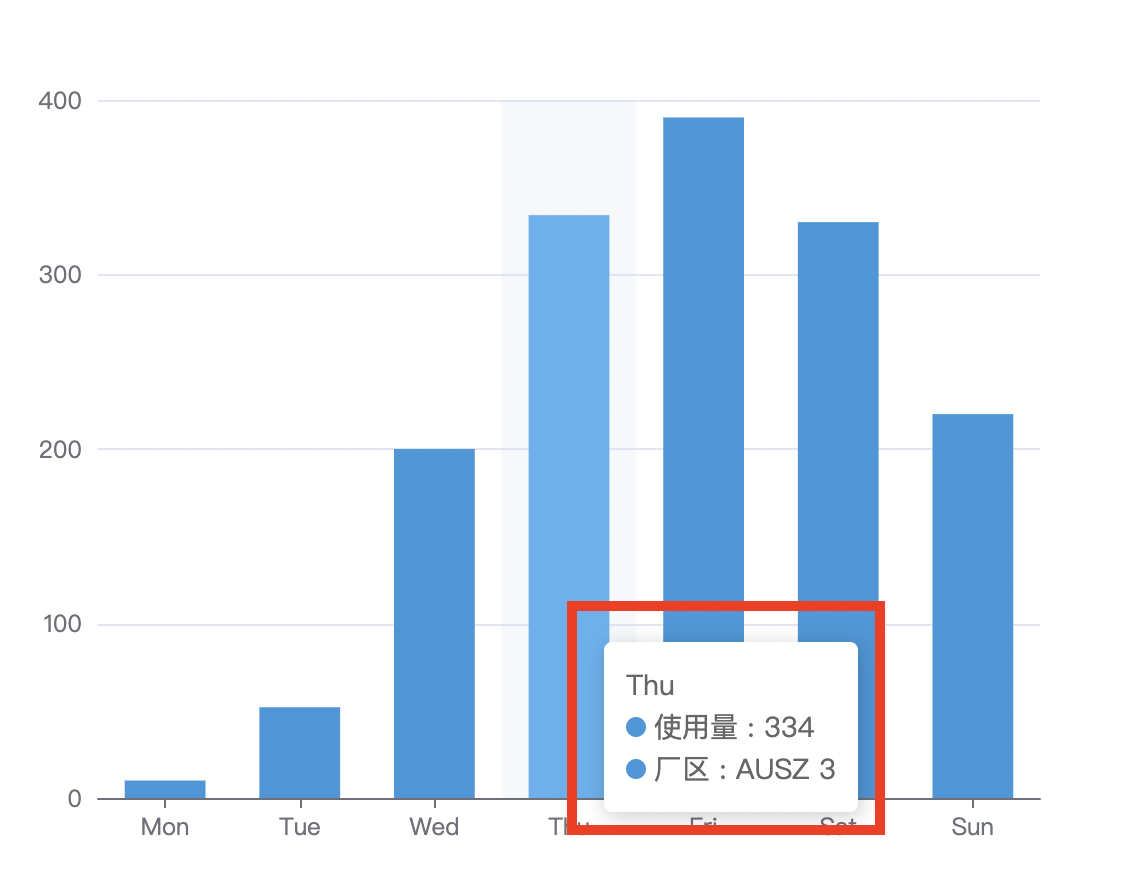
1.
option = {
  color: ['#3398DB'],
  tooltip: {
    trigger: 'axis',
    formatter: function (params) {
      // console.log(JSON.stringify(params));
      return (
        params[0].name +
        `</br> <span style="display:inline-block;margin-right:4px;border-radius:10px;width:10px;height:10px;background-color:#3398DB;"></span>` +
        `响应速度 : ` +
        params[0].value +
        `</br> <span style="display:inline-block;margin-right:4px;border-radius:10px;width:10px;height:10px;background-color:#3398DB;"></span>` +
        `类型: User ` +
        params[0].dataIndex
      );
    },
    axisPointer: {
      type: 'shadow',
      label: {
        backgroundColor: '#6a7985'
      }
    }
  },
  grid: {},
  xAxis: [
    {
      type: 'category',
      data: ['Mon', 'Tue', 'Wed', 'Thu', 'Fri', 'Sat', 'Sun'],
      axisTick: {
        alignWithLabel: true
      }
    }
  ],
  yAxis: [
    {
      type: 'value'
    }
  ],
  series: [
    {
      name: '直接访问',
      type: 'bar',
      barWidth: '60%',
      data: [10, 52, 200, 334, 390, 330, 220]
    }
  ]
};
作者:人间春风意
扫描左侧的二维码可以赞赏

本作品采用署名-非商业性使用-禁止演绎 4.0 国际 进行许可。

 浙公网安备 33010602011771号