


一、PCL工程框架
1. 工程文件框架
.
├── build
│   └── Debug
│       └── bin
│           ├── data
│           │   └── pcl_logo.pcd
│           └── PCLDemo
├── cmake-build-debug
├── CMakeLists.txt
└── main.cpp
2. 编写CMakeLists.txt文件
cmake_minimum_required(VERSION 3.14)
project(PCLDemo)
set(CMAKE_CXX_STANDARD 14)

# 设置输出根目录为build/Debug
set(OUTPUT_DIRECTORY_ROOT ${CMAKE_CURRENT_SOURCE_DIR}/build/${CMAKE_BUILD_TYPE})
# 设置可执行程序输出到build/Debug/bin目录
set(CMAKE_RUNTIME_OUTPUT_DIRECTORY "${OUTPUT_DIRECTORY_ROOT}/bin" CACHE PATH "Runtime directory" FORCE)
# 设置库文件输出到build/Debug/lib目录
set(CMAKE_LIBRARY_OUTPUT_DIRECTORY "${OUTPUT_DIRECTORY_ROOT}/lib" CACHE PATH "Library directory" FORCE)
set(CMAKE_ARCHIVE_OUTPUT_DIRECTORY "${OUTPUT_DIRECTORY_ROOT}/lib" CACHE PATH "Archive directory" FORCE)

find_package(PCL REQUIRED)
# 包含头文件目录
include_directories(${PCL_INCLUDE_DIRS})
# 设置依赖库链接目录
link_directories(${PCL_LIBRARY_DIRS})
# 添加预处理器和编译器标记
add_definitions(${PCL_DEFINITIONS})

add_executable(PCLDemo main.cpp)
target_link_libraries(PCLDemo ${PCL_LIBRARIES})
3. 编写测试文件 main.cpp
#include <iostream>
#include <pcl/io/io.h>
#include <pcl/io/pcd_io.h>
#include <pcl/visualization/cloud_viewer.h>

int main(int argc, char **argv) {

    // 创建PointCloud的智能指针
    pcl::PointCloud<pcl::PointXYZRGBA>::Ptr cloud(new pcl::PointCloud<pcl::PointXYZRGBA>);
    // 加载pcd文件到cloud
    pcl::io::loadPCDFile("./data/pcl_logo.pcd", *cloud);
    pcl::visualization::CloudViewer viewer("Cloud Viewer");
    //这里会一直阻塞直到点云被渲染
    viewer.showCloud(cloud);

    // 循环判断是否退出
    while (!viewer.wasStopped()) {
        // 你可以在这里对点云做很多处理
    }
    return 0;
}
4. 编译结果
二、数据结构
根据激光测量原理得到的点云,包含三维坐标信息(xyz)和激光反射强度信息(intensity),激光反射强度与仪器的激光发射能量、波长,目标的表面材质、粗糙程度、入射角相关。根据摄影测量原理得到的点云,包括三维坐标(xyz)和颜色信息(rgb)。结合两个原理的多传感器融合技术(多见于手持式三维扫描仪),能够同时得到这三种信息。
- 基本类型PointCloud:PCL的基本数据类型是PointCloud,一个PointCloud是一个C++的模板类,它包含了以下字段:
width(int):指定点云数据集的宽度- 对于无组织格式的数据集,width代表了所有点的总数
- 对于有组织格式的数据集,width代表了一行中的总点数
height(int):制定点云数据集的高度- 对于无组织格式的数据集,值为1
- 对于有组织格式的数据集,表示总行数
points(std::vector<PointT>):包含所有PointT类型的点的数据列表
- 衍生类型
- PointXYZ - float x, y, z
- PointXYZI - float x, y, z, intensity
- PointXYZRGB - float x, y, z, rgb
- PointXYZRGBA - float x, y, z, uint32_t rgb
- Normal - float normal[3], curvature 法线方向,对应的曲率的测量值
- PointNormal - float x, y, z, normal[3], curvature 采样点,法线和曲率
- Histogram - float histogram[N] 用于存储一般用途的n维直方图
🌻 Tips: 具体类型及描述可参考 PointT官方文档
三、点云常见处理
四、可视化Visualization
科学计算可视化(Visualization in Scientific Computing)能够把科学数据(包括测量获得的数值、图像或者计算中设计、产生的数字信息)变为直观的、可以用以图形图像信息表示的、随时间和空间变化的物理现象或物理量。进而呈现在研究者面前,使他们可以方便的观察、模拟和计算。
1. pcl_viewer工具
pcl_viewer xxxxx.pcd
2. 代码端 CloudViewer 调用显示点云
#include <pcl/io/io.h>
#include <pcl/io/pcd_io.h>
#include <pcl/visualization/pcl_visualizer.h>

int main(int argc, char **argv) {
    pcl::PointCloud<pcl::PointXYZ>::Ptr cloud(new pcl::PointCloud<pcl::PointXYZ>);
    pcl::io::loadPCDFile("./data/bunny.pcd", *cloud);

    pcl::PointCloud<pcl::PointXYZRGB>::Ptr cloud_milk(new pcl::PointCloud<pcl::PointXYZRGB>);
    pcl::io::loadPCDFile("./data/milk_color.pcd", *cloud_milk);

    // 创建PCLVisualizer
    boost::shared_ptr<pcl::visualization::PCLVisualizer> viewer (new pcl::visualization::PCLVisualizer ("3D Viewer"));

    // 设置背景色为灰色(非必须)
    viewer->setBackgroundColor (0.05, 0.05, 0.05, 0);

    // 添加一个普通点云 (可以设置指定颜色,也可以去掉single_color参数不设置)
    pcl::visualization::PointCloudColorHandlerCustom<pcl::PointXYZ> single_color(cloud, 0, 255, 0);
    viewer->addPointCloud<pcl::PointXYZ> (cloud, single_color, "sample cloud");
    viewer->setPointCloudRenderingProperties (pcl::visualization::PCL_VISUALIZER_POINT_SIZE, 2, "sample cloud");

    // 再添加一个彩色点云及配置
    pcl::visualization::PointCloudColorHandlerRGBField<pcl::PointXYZRGB> rgb(cloud_milk);
    viewer->addPointCloud<pcl::PointXYZRGB> (cloud_milk, rgb, "sample cloud milk");
    viewer->setPointCloudRenderingProperties (pcl::visualization::PCL_VISUALIZER_POINT_SIZE, 3, "sample cloud milk");

    // 添加一个0.5倍缩放的坐标系(非必须)
    viewer->addCoordinateSystem (0.5);

    // 直到窗口关闭才结束循环
    while (!viewer->wasStopped()) {
        // 每次循环调用内部的重绘函数
        viewer->spinOnce();
    }
    return 0;
}
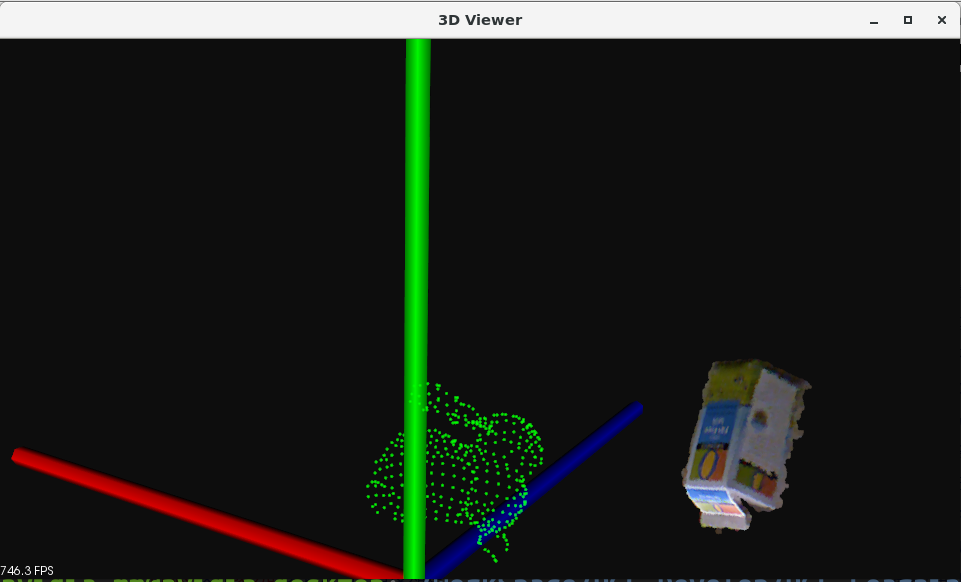
Result:
3. 代码端 PCLVisualizer 调用显示点云
#include <pcl/visualization/cloud_viewer.h>
#include <iostream>
#include <pcl/io/io.h>
#include <pcl/io/pcd_io.h>

int user_data;

void viewerOneOff(pcl::visualization::PCLVisualizer &viewer) {
    // 设置背景色为粉红色
    viewer.setBackgroundColor(1.0, 0.5, 1.0);
    pcl::PointXYZ o;
    o.x = 1.0;
    o.y = 0;
    o.z = 0;
    //    添加一个圆心为o,半径为0.25m的球体
    viewer.addSphere(o, 0.25, "sphere", 0);
    std::cout << "i only run once" << std::endl;
}

void viewerPsycho(pcl::visualization::PCLVisualizer &viewer) {
    static unsigned count = 0;
    std::stringstream ss;
    ss << "Once per viewer loop: " << count++;
    // 每次刷新时,移除text,添加新的text
    viewer.removeShape("text", 0);
    viewer.addText(ss.str(), 200, 300, "text", 0);

    //FIXME: possible race condition here:
    user_data++;
}

int main() {
    pcl::PointCloud<pcl::PointXYZRGBA>::Ptr cloud(new pcl::PointCloud<pcl::PointXYZRGBA>);
    pcl::io::loadPCDFile("./data/pcl_logo.pcd", *cloud);
    pcl::visualization::CloudViewer viewer("Cloud Viewer");

    //这里会一直阻塞直到点云被渲染
    viewer.showCloud(cloud);

    // 只会调用一次 (非必须)
    viewer.runOnVisualizationThreadOnce (viewerOneOff);
    // 每次可视化迭代都会调用一次(频繁调用) (非必须)
    viewer.runOnVisualizationThread (viewerPsycho);
    while (!viewer.wasStopped()) {
        user_data++;
    }
    return 0;
}
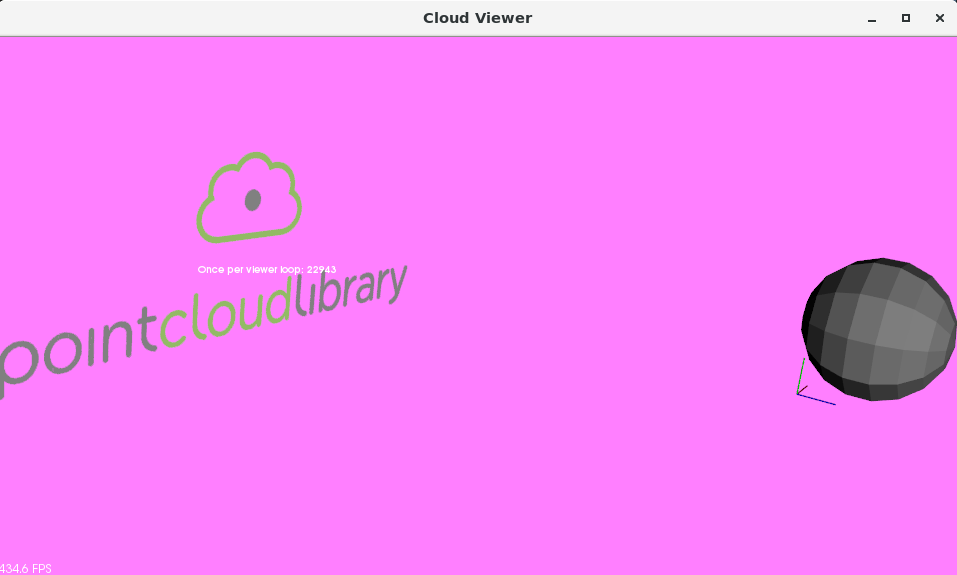
Result:
五、点云旋转
使用四元数的方式对空间数据进行了 旋转+平移 处理操作。
1. 源代码Code
#include <iostream>
#include <pcl/io/pcd_io.h>
#include <pcl/io/ply_io.h>
#include <pcl/point_cloud.h>
#include <pcl/console/parse.h>
#include <pcl/common/transforms.h>
#include <pcl/visualization/pcl_visualizer.h>
/**
* 旋转并平移
* @param argc
* @param argv
* @return
*/
int main(int argc, char **argv) {
// Load file | Works with PCD and PLY files
pcl::PointCloud<pcl::PointXYZ>::Ptr source_cloud(new pcl::PointCloud<pcl::PointXYZ>());
if (pcl::io::loadPCDFile(argv[1], *source_cloud) < 0) {
std::cout << "Error loading point cloud " << argv[1] << std::endl << std::endl;
return -1;
}
/* Reminder: how transformation matrices work :
|-------> This column is the translation
| 1 0 0 x | \
| 0 1 0 y | }-> The identity 3x3 matrix (no rotation) on the left
| 0 0 1 z | /
| 0 0 0 1 | -> We do not use this line (and it has to stay 0,0,0,1)
METHOD #1: Using a Matrix4f
This is the "manual" method, perfect to understand but error prone !
*/
Eigen::Matrix4f transform_1 = Eigen::Matrix4f::Identity();
// Define a rotation matrix (see https://en.wikipedia.org/wiki/Rotation_matrix)
float theta = M_PI / 4; // The angle of rotation in radians
transform_1(0, 0) = cos(theta);
transform_1(0, 1) = -sin(theta);
transform_1(1, 0) = sin(theta);
transform_1(1, 1) = cos(theta);
// (row, column)
// Define a translation of 2.5 meters on the x axis.
transform_1(0, 3) = 2.5;
// Print the transformation
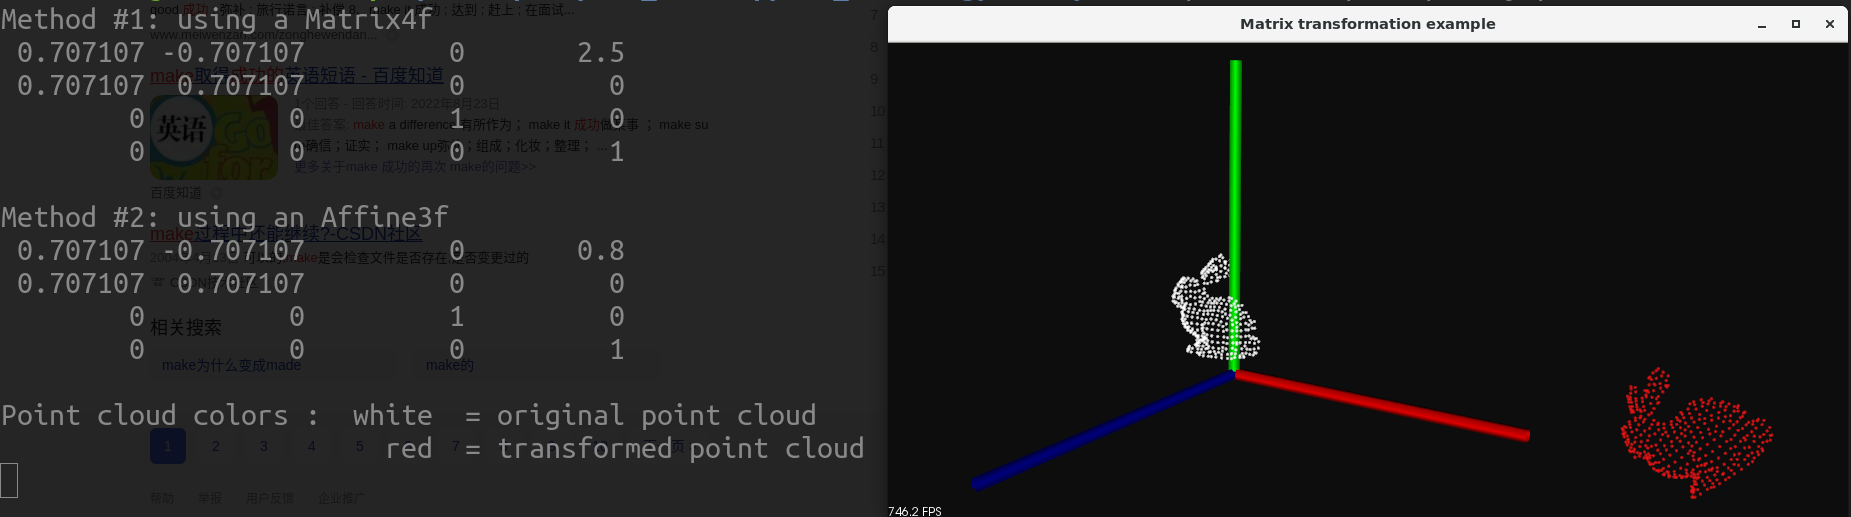
printf("Method #1: using a Matrix4f\n");
std::cout << transform_1 << std::endl;
/* METHOD #2: Using a Affine3f
This method is easier and less error prone
*/
Eigen::Affine3f transform_2 = Eigen::Affine3f::Identity();
// Define a translation of 0.8 meters on the x axis.
transform_2.translation() << 0.8, 0.0, 0.0;
// The same rotation matrix as before; theta radians arround Z axis
transform_2.rotate(Eigen::AngleAxisf(theta, Eigen::Vector3f::UnitZ()));
// Print the transformation
printf("\nMethod #2: using an Affine3f\n");
std::cout << transform_2.matrix() << std::endl;
// Executing the transformation
pcl::PointCloud<pcl::PointXYZ>::Ptr transformed_cloud(new pcl::PointCloud<pcl::PointXYZ>());
// You can either apply transform_1 or transform_2; they are the same
pcl::transformPointCloud(*source_cloud, *transformed_cloud, transform_2);
// Visualization
printf("\nPoint cloud colors : white = original point cloud\n"
" red = transformed point cloud\n");
pcl::visualization::PCLVisualizer viewer("Matrix transformation example");
// Define R,G,B colors for the point cloud
pcl::visualization::PointCloudColorHandlerCustom<pcl::PointXYZ> source_cloud_color_handler(source_cloud, 255, 255,
255);
// We add the point cloud to the viewer and pass the color handler
viewer.addPointCloud(source_cloud, source_cloud_color_handler, "original_cloud");
pcl::visualization::PointCloudColorHandlerCustom<pcl::PointXYZ> transformed_cloud_color_handler(transformed_cloud,
230, 20, 20); // Red
viewer.addPointCloud(transformed_cloud, transformed_cloud_color_handler, "transformed_cloud");
// 设置坐标系系统
viewer.addCoordinateSystem(0.5, "cloud", 0);
// 设置背景色
viewer.setBackgroundColor(0.05, 0.05, 0.05, 0); // Setting background to a dark grey
// 设置渲染属性(点大小)
viewer.setPointCloudRenderingProperties(pcl::visualization::PCL_VISUALIZER_POINT_SIZE, 2, "original_cloud");
// 设置渲染属性(点大小)
viewer.setPointCloudRenderingProperties(pcl::visualization::PCL_VISUALIZER_POINT_SIZE, 2, "transformed_cloud");
//viewer.setPosition(800, 400); // Setting visualiser window position
while (!viewer.wasStopped()) { // Display the visualiser until 'q' key is pressed
viewer.spinOnce();
}
return 0;
}
2. 运行结果
转载请注明出处!感谢GISPALAB实验室的老师和同学们的帮助和支持~

 浙公网安备 33010602011771号