

prometheus的搭建
1、下载 prometheus
Prometheus 的下载链接为:https://prometheus.io/download/
①Prometheusl以prometheus Server为核心,用于收集和存储时间序列数据。Prometheus Server从监控目标中通过pull方式拉取指标数据,或通过pushgateway把采集的数据拉取到Prometheus server中。
②Prometheus server把采集到的监控指标数据通过TSDB存储到本地HDD/SSD中。
③Prometheus采集的监控指标数据按时间序列存储,通过配置报警规则,把触发的报警发送到Alertmanager。
④Alertmanager通过配置报警接收方,发送报警到邮件、钉钉或者企业微信等。
⑤Prometheus自带的Web UI界面提供PromQL查询语言,可查询监控数据。
⑥Grafana可接入Prometheus数据源,把监控数据以图形化形式展示出
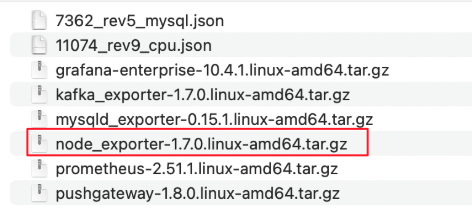
这里所需Prometheus的组件为下面5个文件即可:
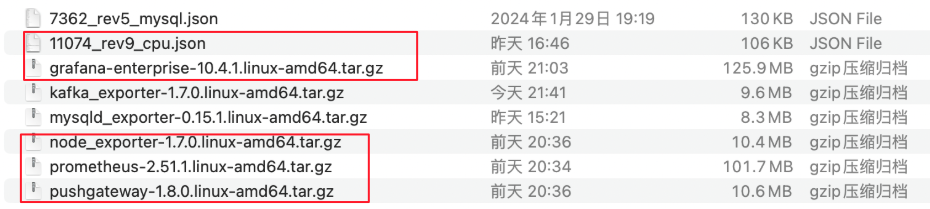
注意:
kafka_exporter-1.7.0.linux-amd64.tar.gz 监控服务器中的kafka资源占用情况
7362_rev5_mysql.json 监控服务器中的mysql资源占用情况
mysqld_exporter-0.15.1.linux-amd64.tar.gz
2、配置 prometheus
①创建一个干净的文件夹
1 mkdir prometheus
②上传后,把下载所有的安装包都放在这个文件夹里面,分别进行解压:
rz     # 上传
unzip x86_prometheus.zip      # 解压zip文件
tar -xzf 文件名       # 解压tar.gz文件
③查看端口号是否被占用
netstat -anp |grep 9090
④进入prometheus-2.51.1.linux-amd64编辑配置文件 vim prometheus.yml ,更换配置文件中的IP和端口号。
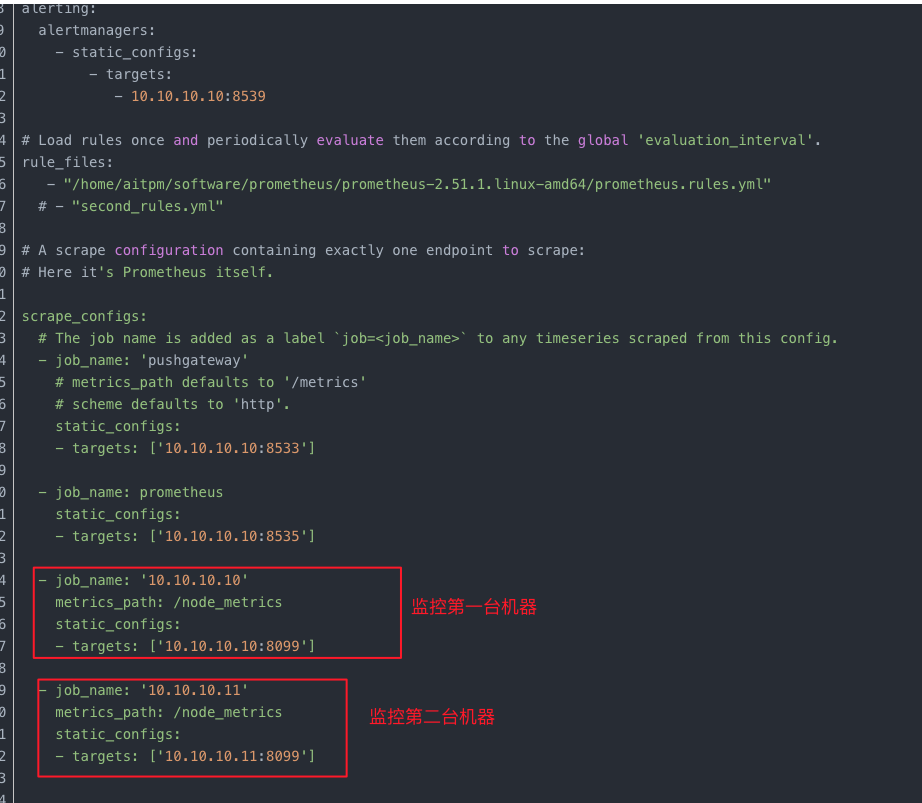
# my global config
global:
  scrape_interval: 15s # Set the scrape interval to every 15 seconds. Default is every 1 minute.
  evaluation_interval: 15s # Evaluate rules every 15 seconds. The default is every 1 minute.
  # scrape_timeout is set to the global default (10s).

# Alertmanager configuration
alerting:
  alertmanagers:
    - static_configs:
        - targets:
           - 10.10.10.10:8539

# Load rules once and periodically evaluate them according to the global 'evaluation_interval'.
rule_files:
   - "/home/aitpm/software/prometheus/prometheus-2.51.1.linux-amd64/prometheus.rules.yml"
  # - "second_rules.yml"

# A scrape configuration containing exactly one endpoint to scrape:
# Here it's Prometheus itself.
scrape_configs:
  # The job name is added as a label `job=<job_name>` to any timeseries scraped from this config.
  - job_name: 'pushgateway'
    # metrics_path defaults to '/metrics'
    # scheme defaults to 'http'.
    static_configs:
    - targets: ['10.10.10.10:8533']

  - job_name: prometheus
    static_configs:
    - targets: ['10.10.10.10:8535']

  - job_name: '10.10.10.10'
    metrics_path: /node_metrics
    static_configs:
    - targets: ['10.10.10.10:8099']

  - job_name: '10.10.10.11'
    metrics_path: /node_metrics
    static_configs:
    - targets: ['10.10.10.11:8099']
三、启动prometheus, node_exporter和pushgateway
在 prometheus-2.51.1.linux-amd64 目录下执行如下启动命令:(命令中的端口号与配置文件中的prometheus.yml的端口号保持一致)
nohup ./prometheus --config.file=prometheus.yml --web.listen-address=:8080 > ./prometheus.log 2>&1 &
在 pushgateway-1.8.0.linux-amd64目录下执行如下启动命令:
nohup ./pushgateway --web.listen-address=:8090 > ./pushgateway.log 2>&1 &
在 node_exporter-1.7.0.linux-amd64目录下执行如下启动命令:
nohup ./node_exporter --web.listen-address=":8050" --web.telemetry-path="/node_metrics" > ./node_exporter.log 2>&1 &
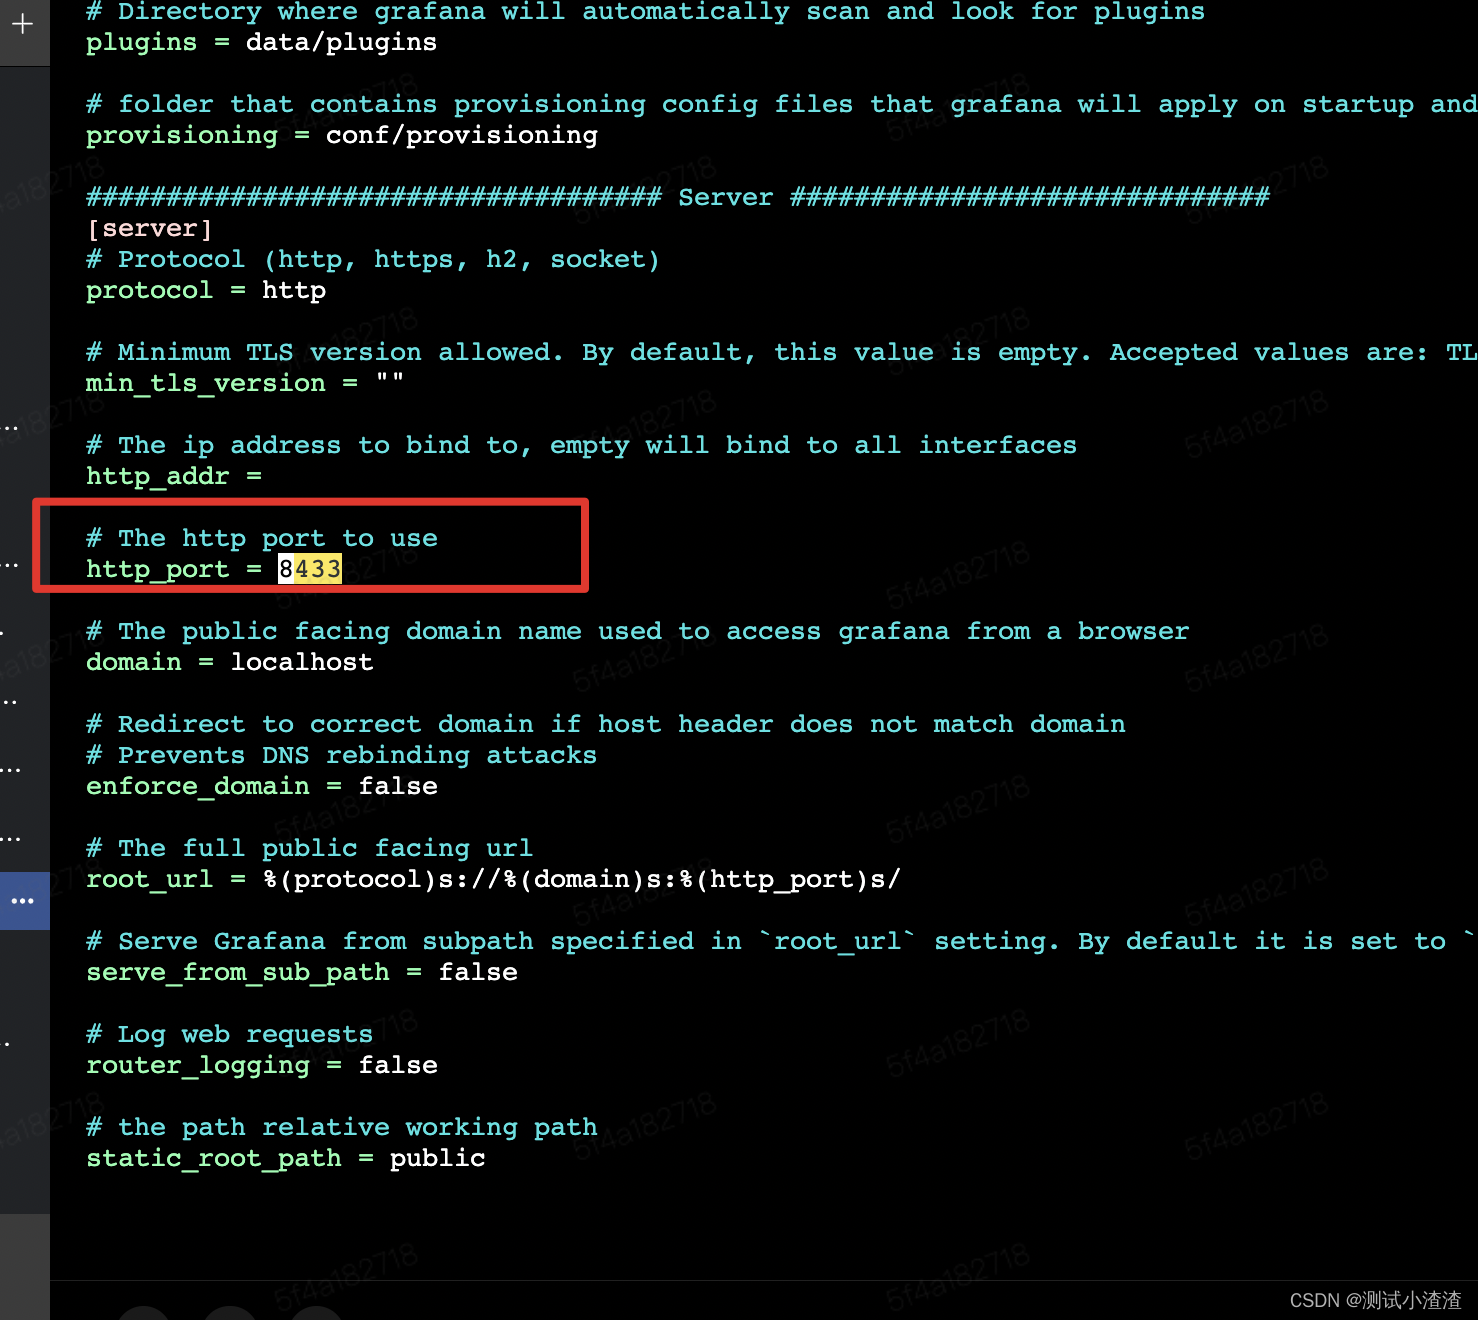
四、配置安装Grafana (8433)
Grafana的下载地址为: https://grafana.com/grafana/download
修改配置文件中的端口号
进入bin目录中,启动grafana服务
./grafana-server web > ./grafana.log 2>&1 &
五、 配置Grafana
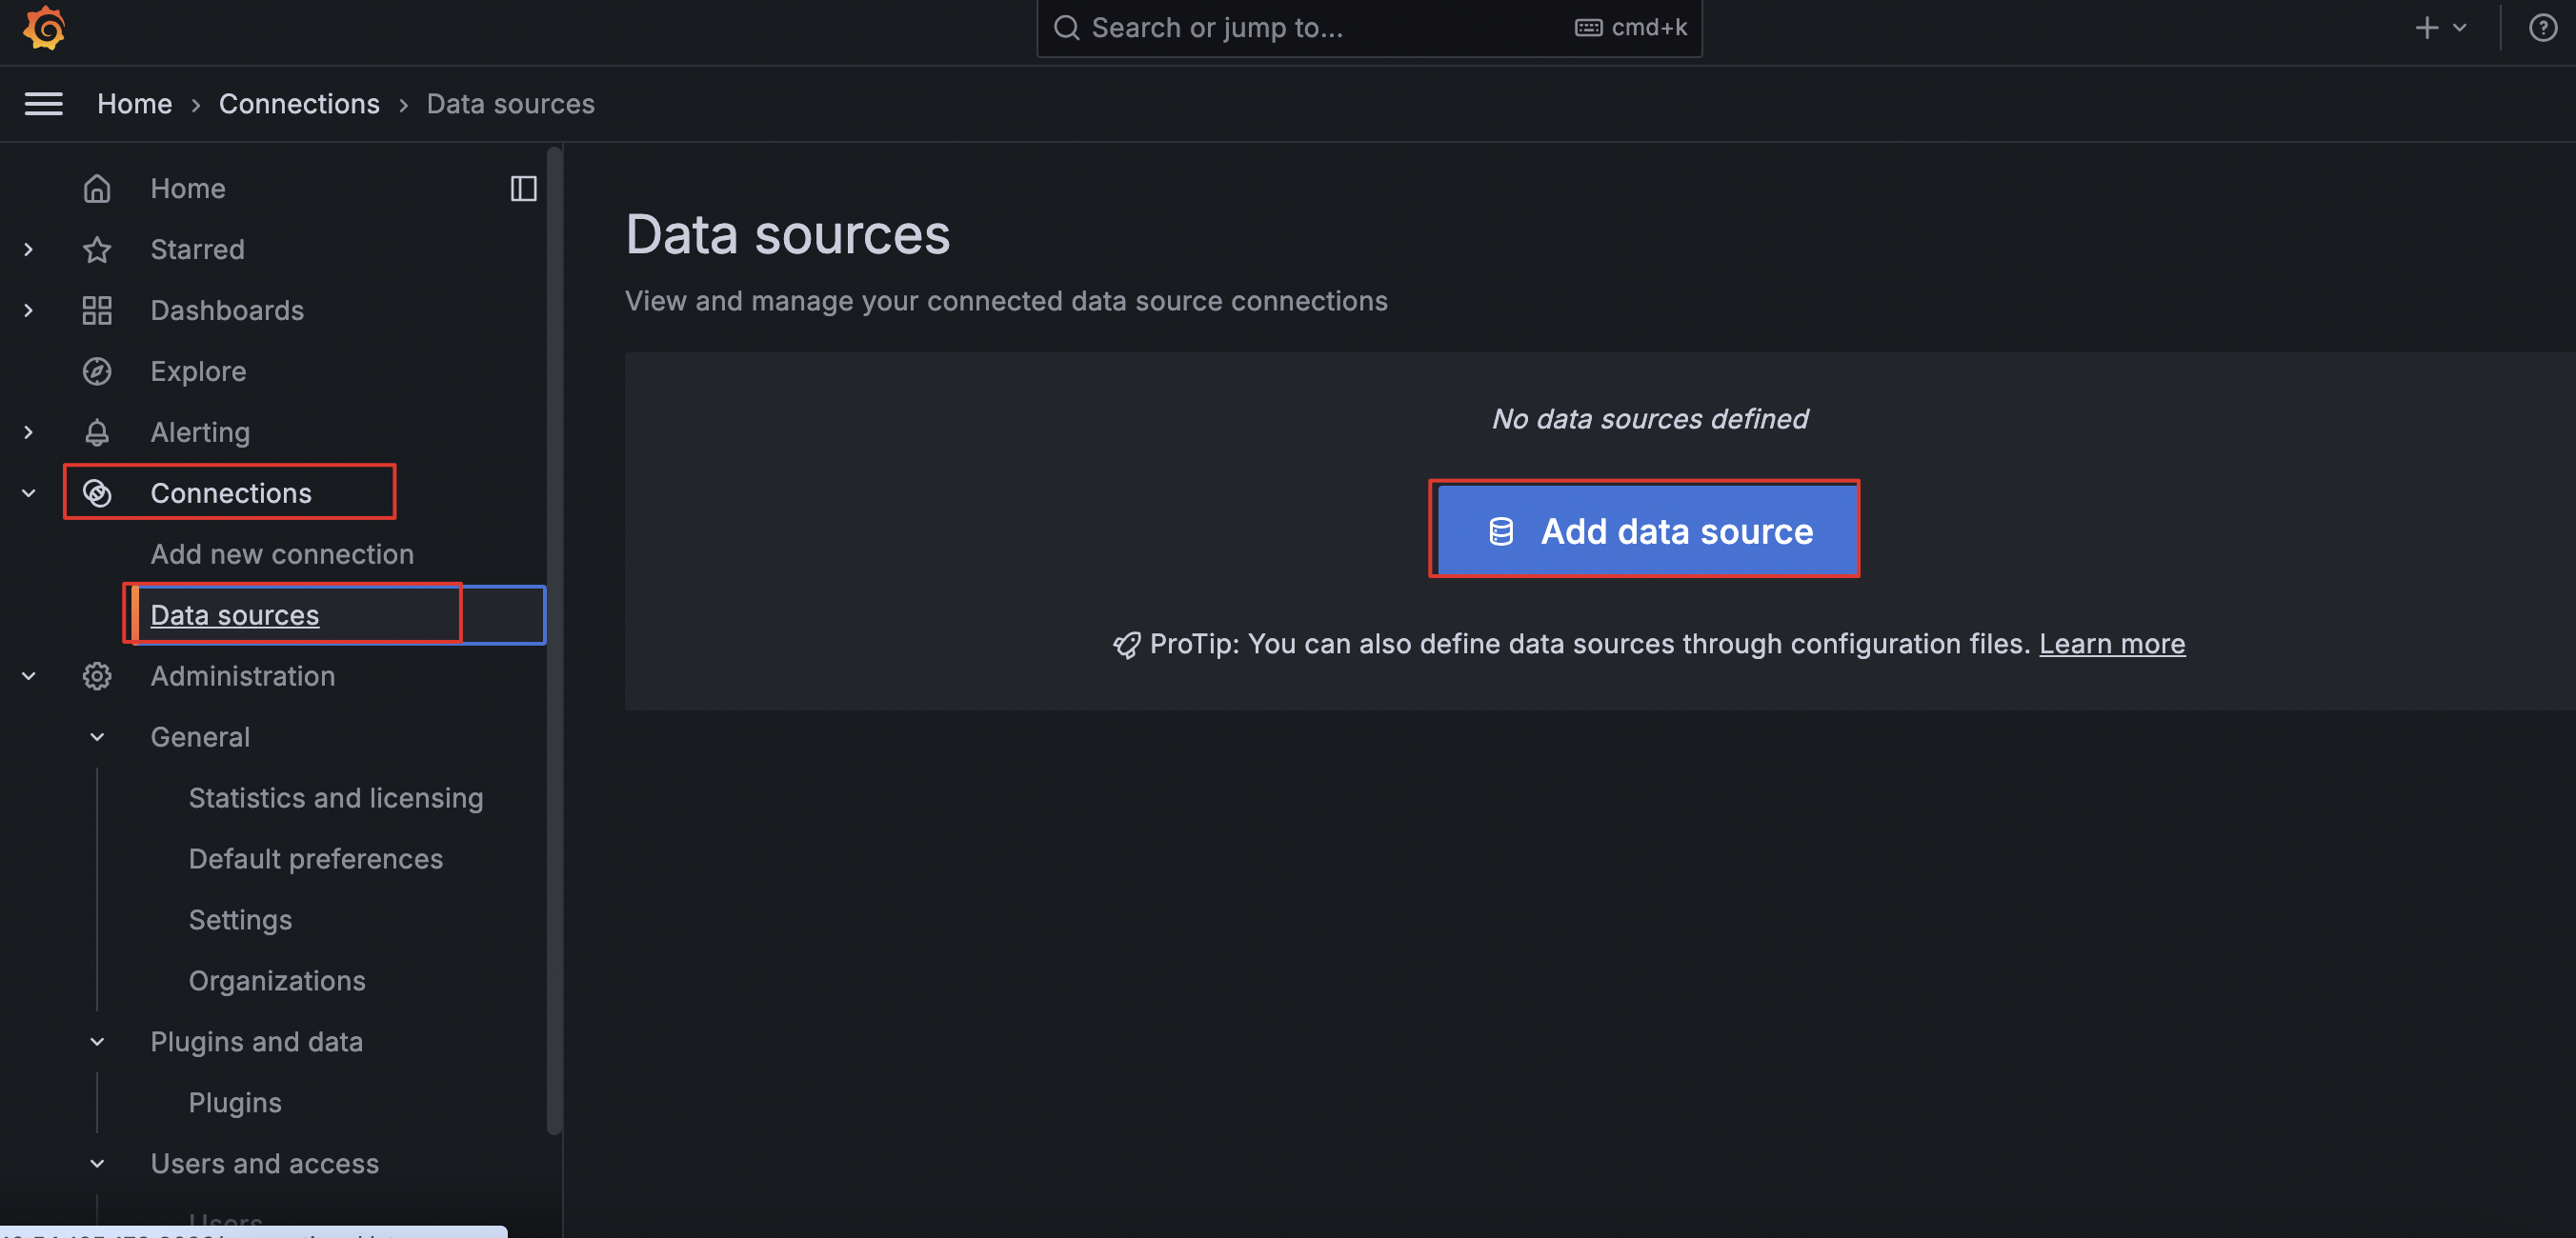
1、配置数据源
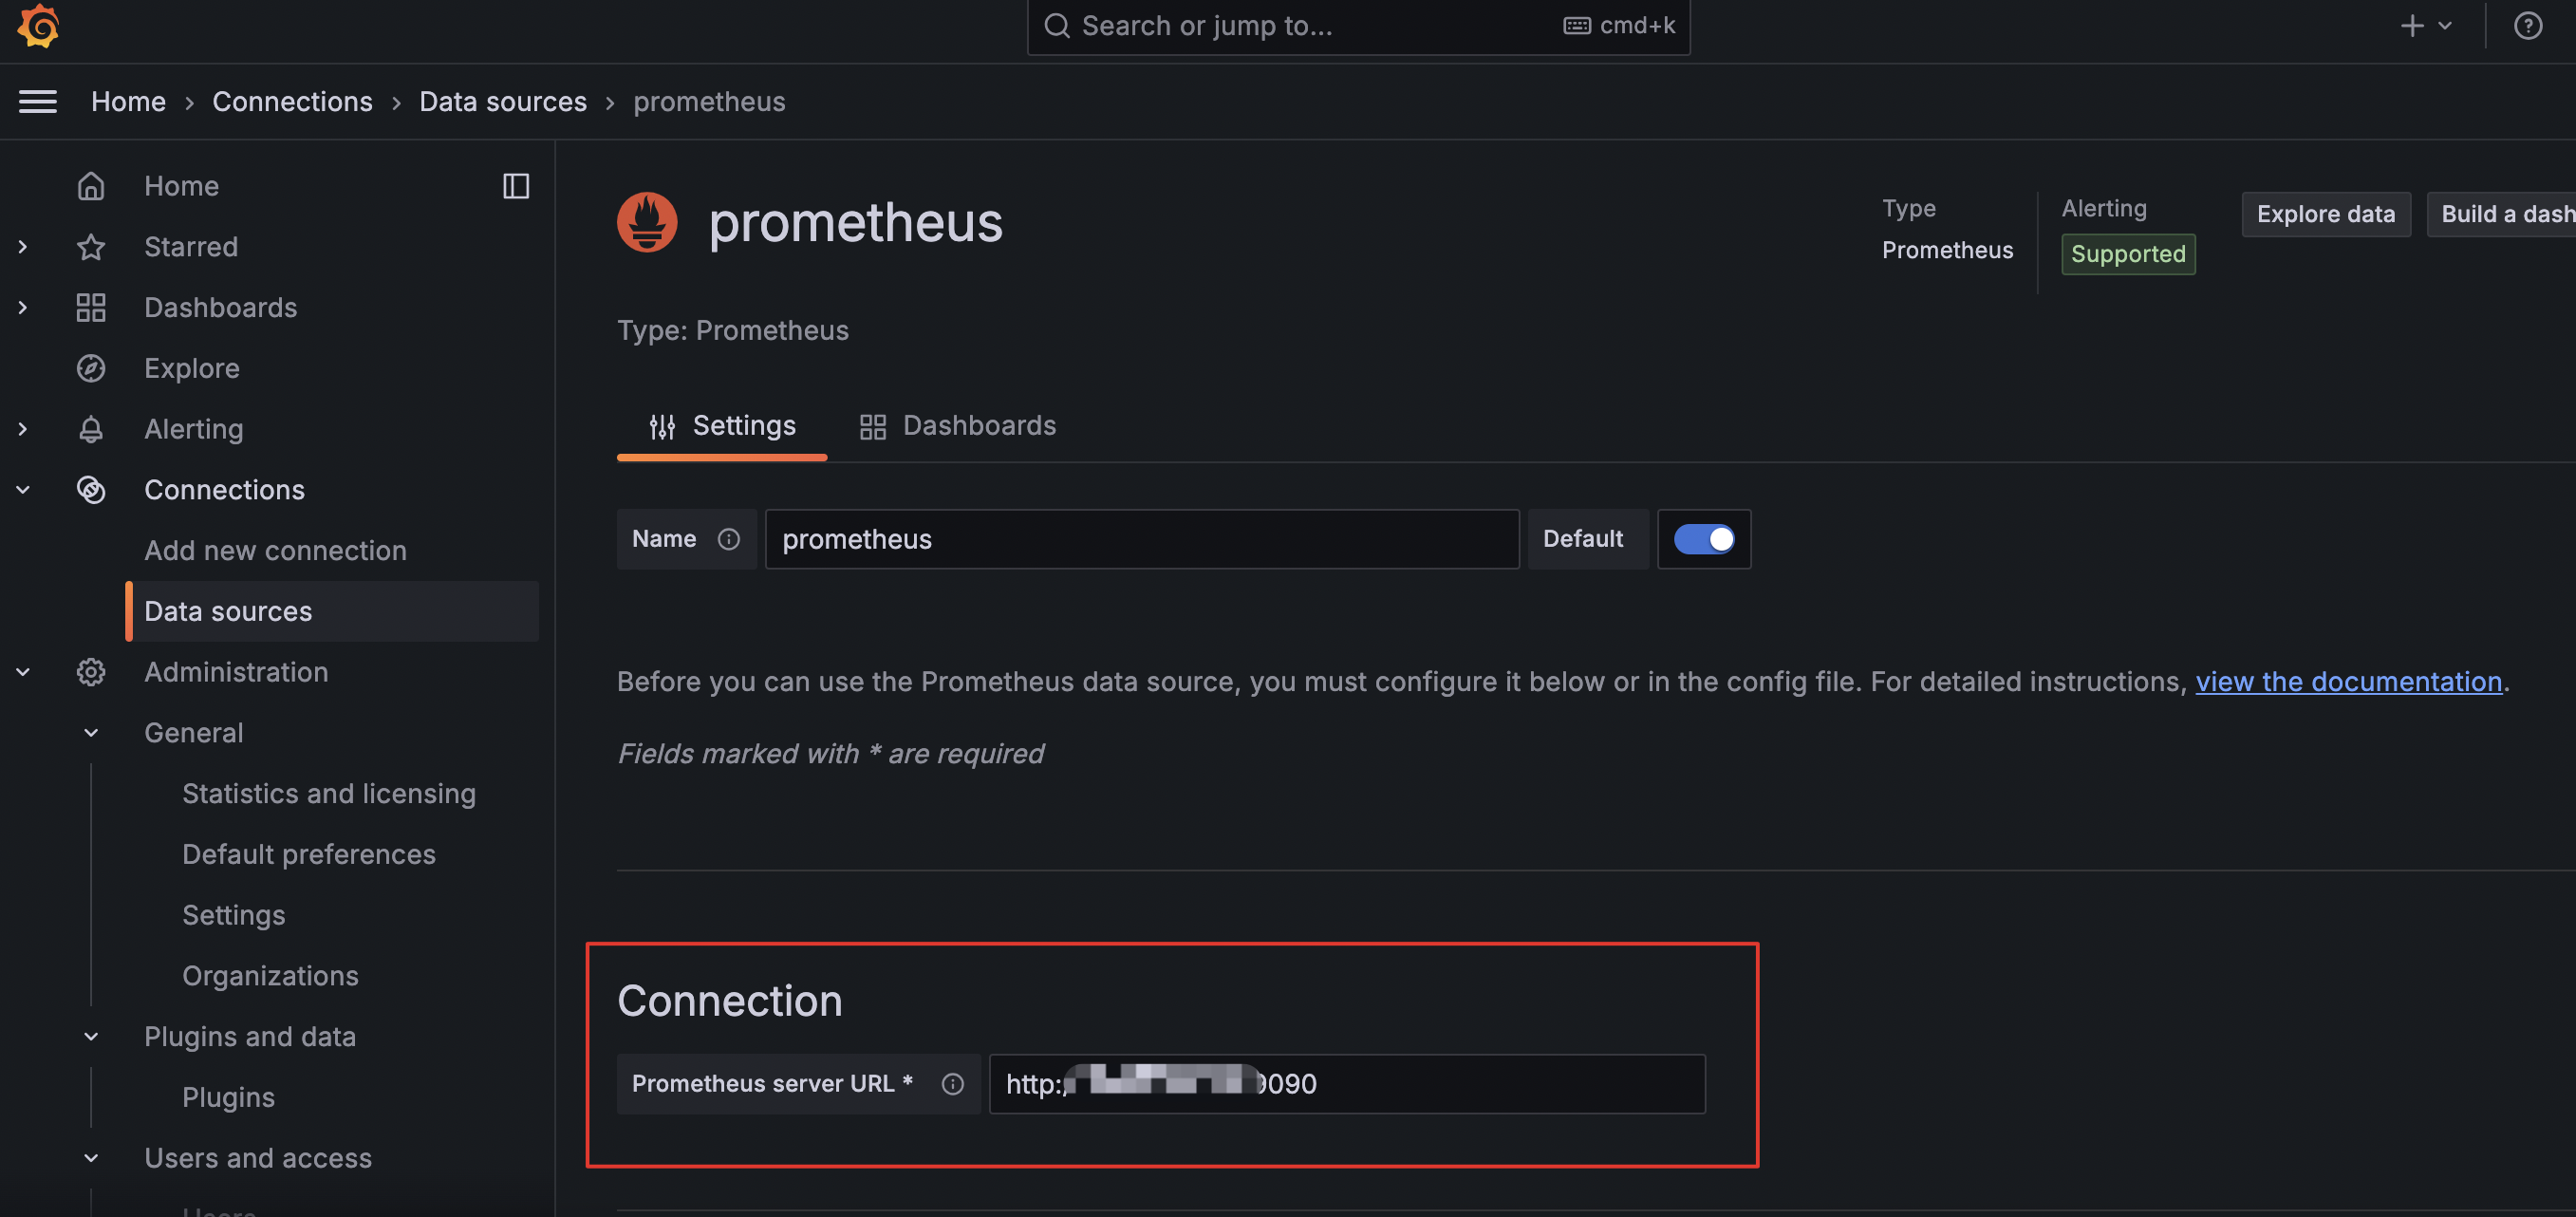
启动完后即可再浏览器中访问页面:ip:端口号(刚才配置文件中设置的端口号),使用默认用户名密码(admin/admin)登录Grafana后,选择左侧菜单的Configuration -> Data Sources。(ip地址换成自己的)
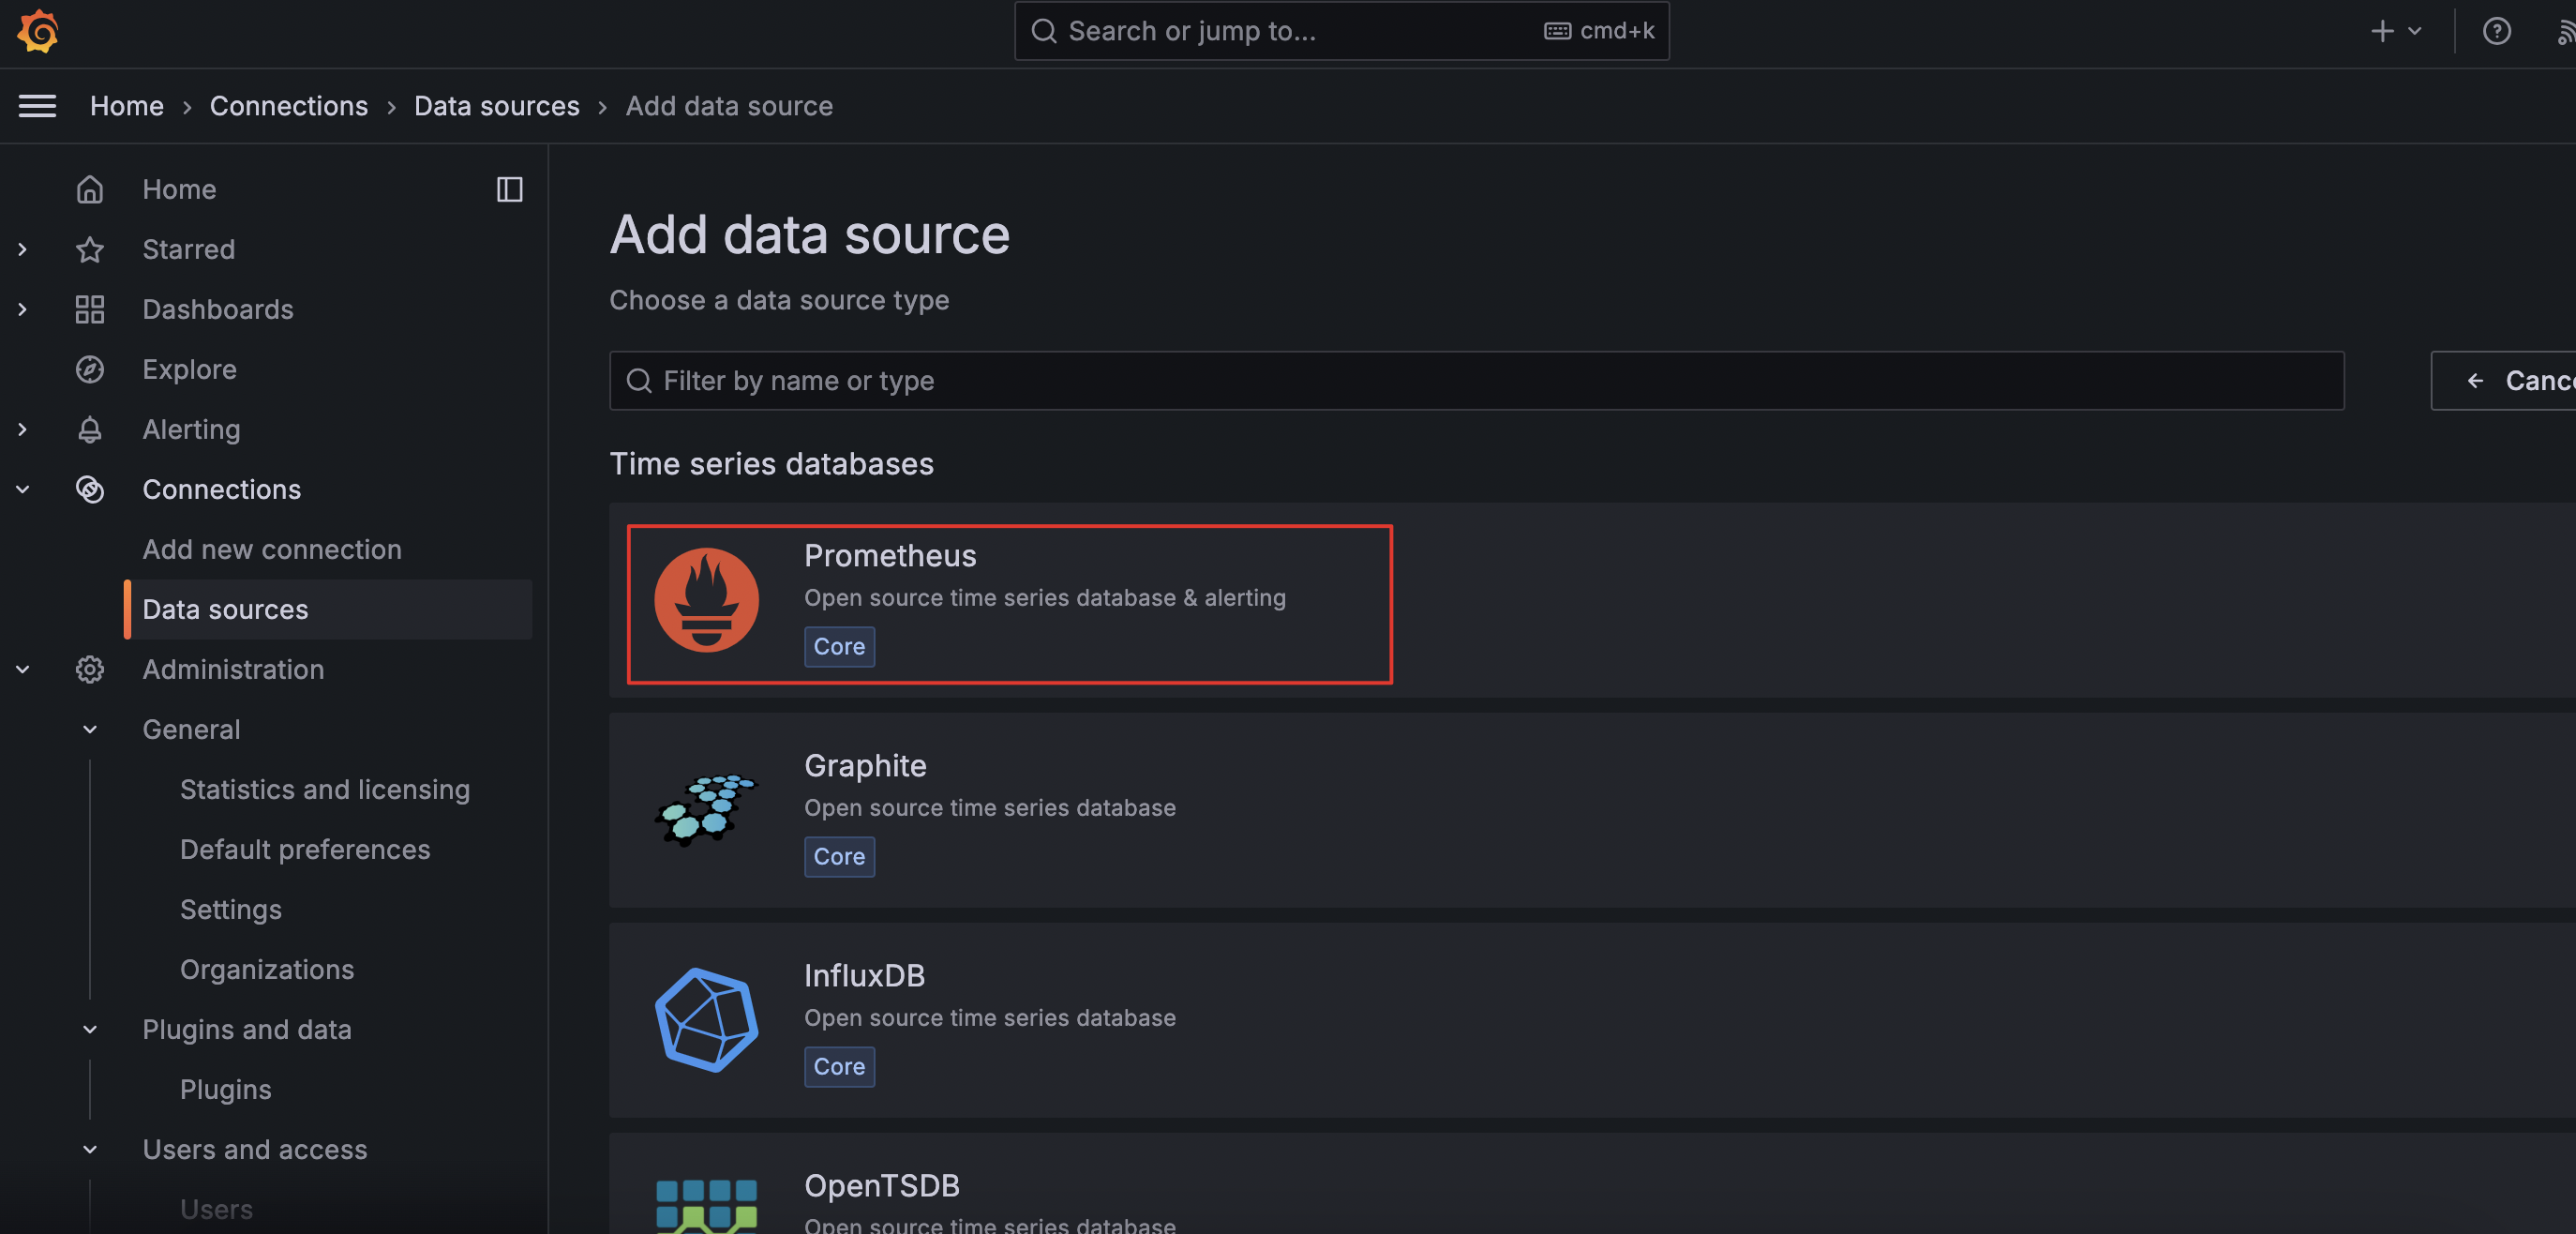
connection中输入的URL 与 配置文件中的prometheus.yml 中job_name: prometheus的端口号保持一致。
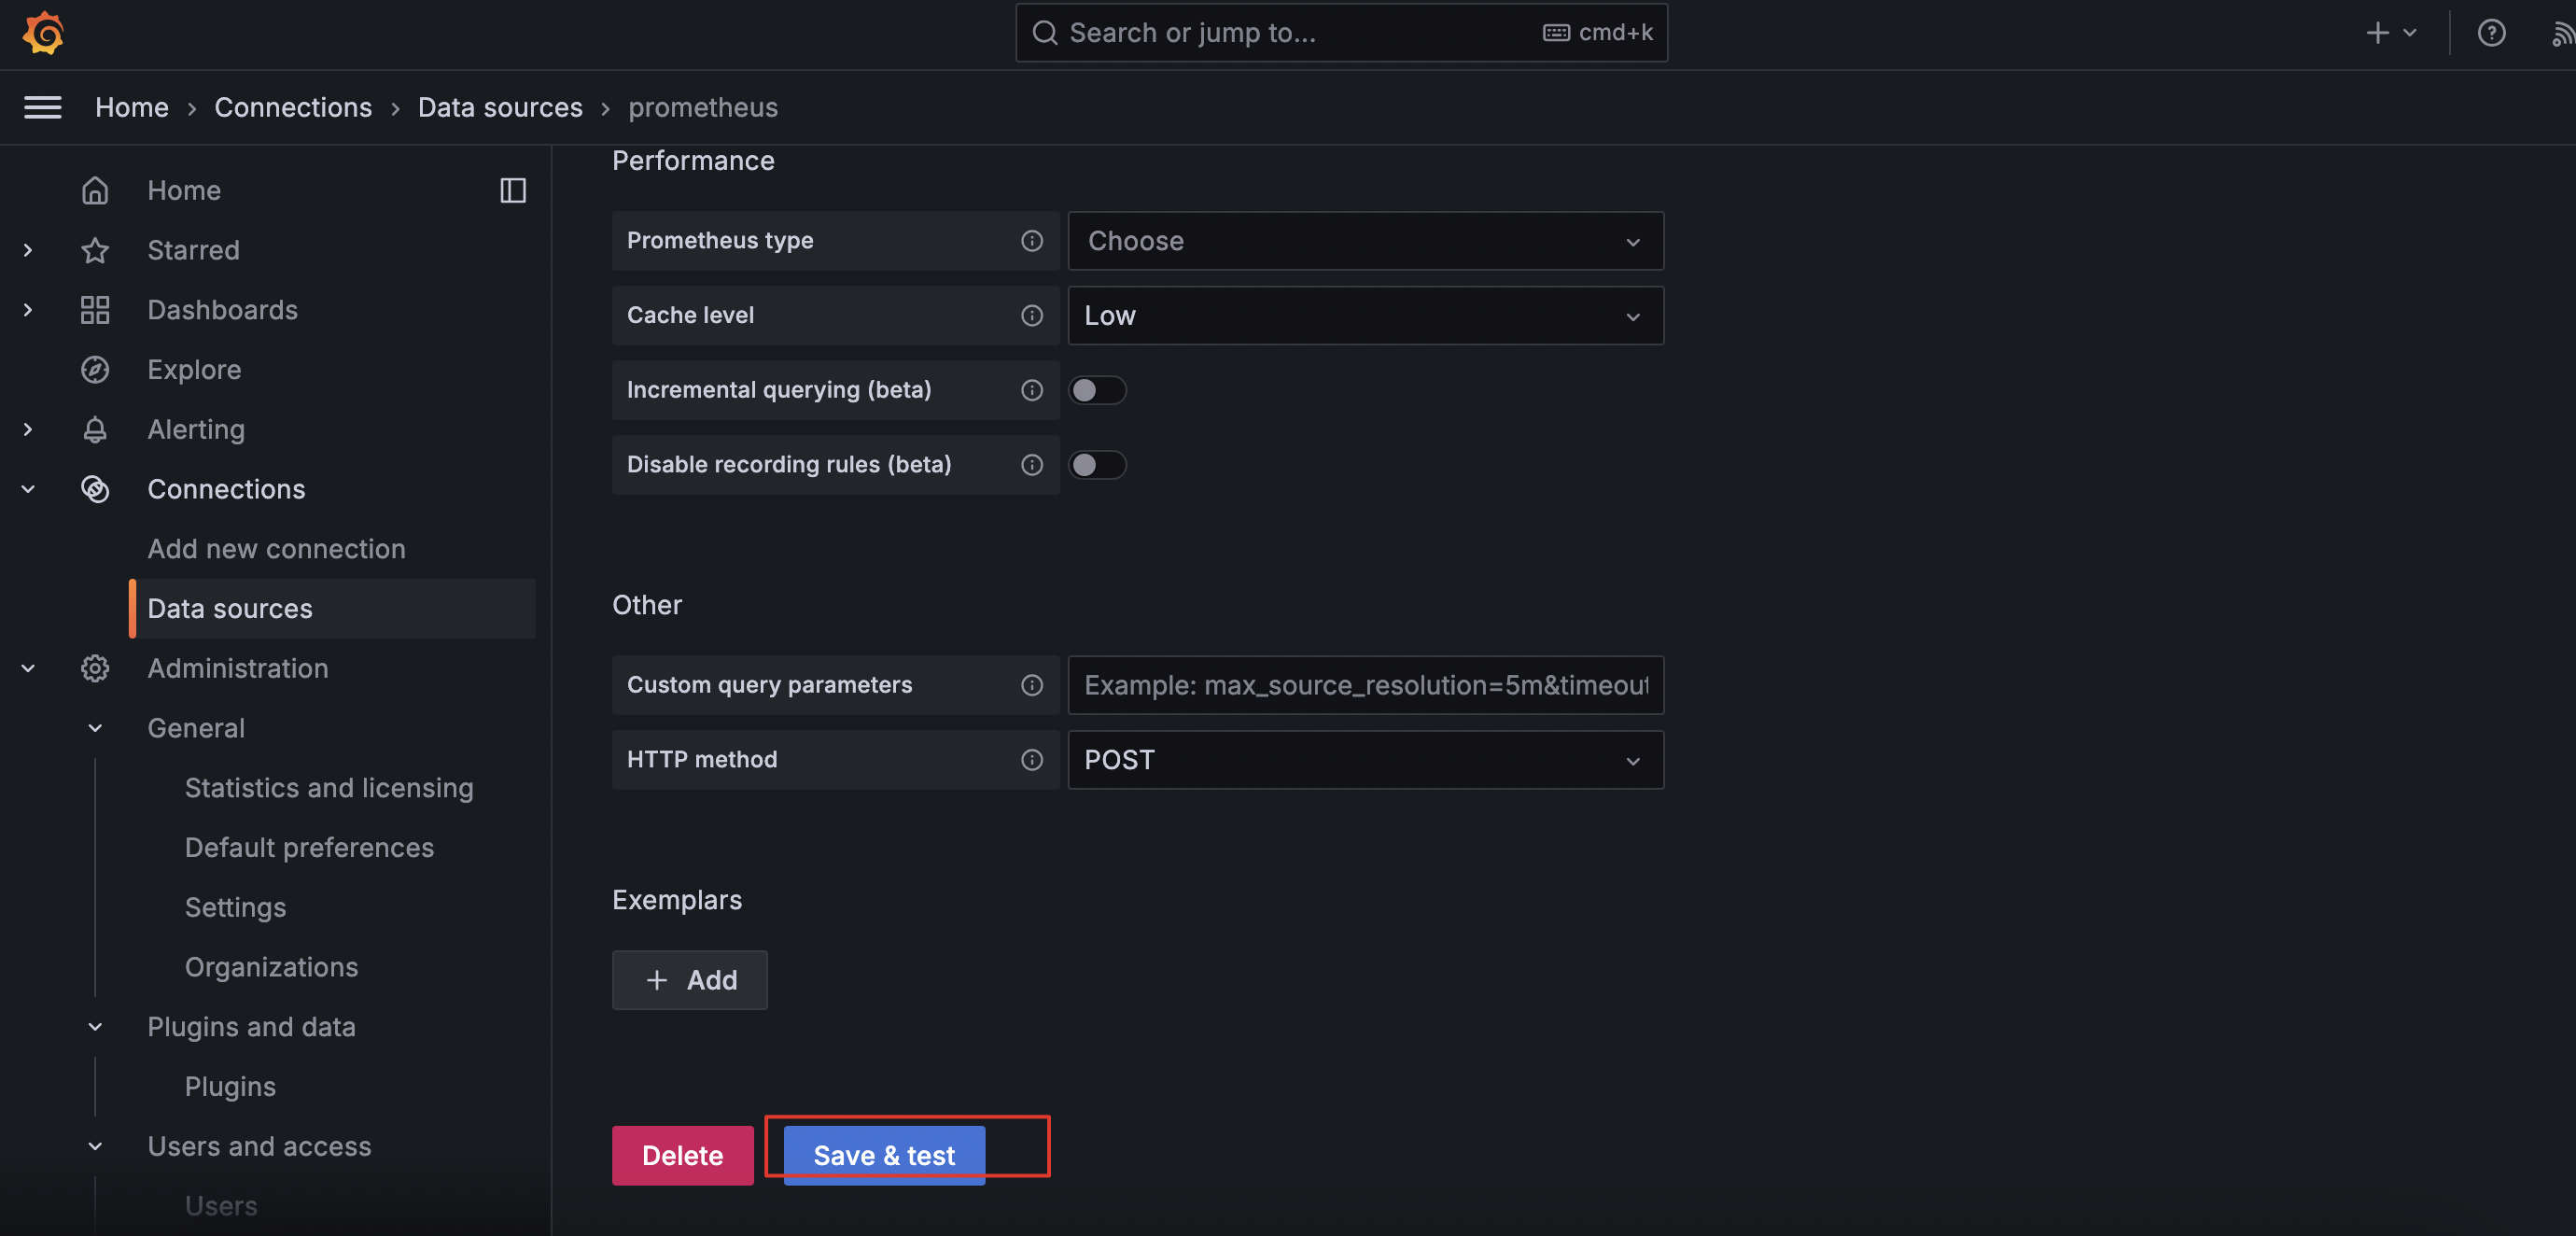
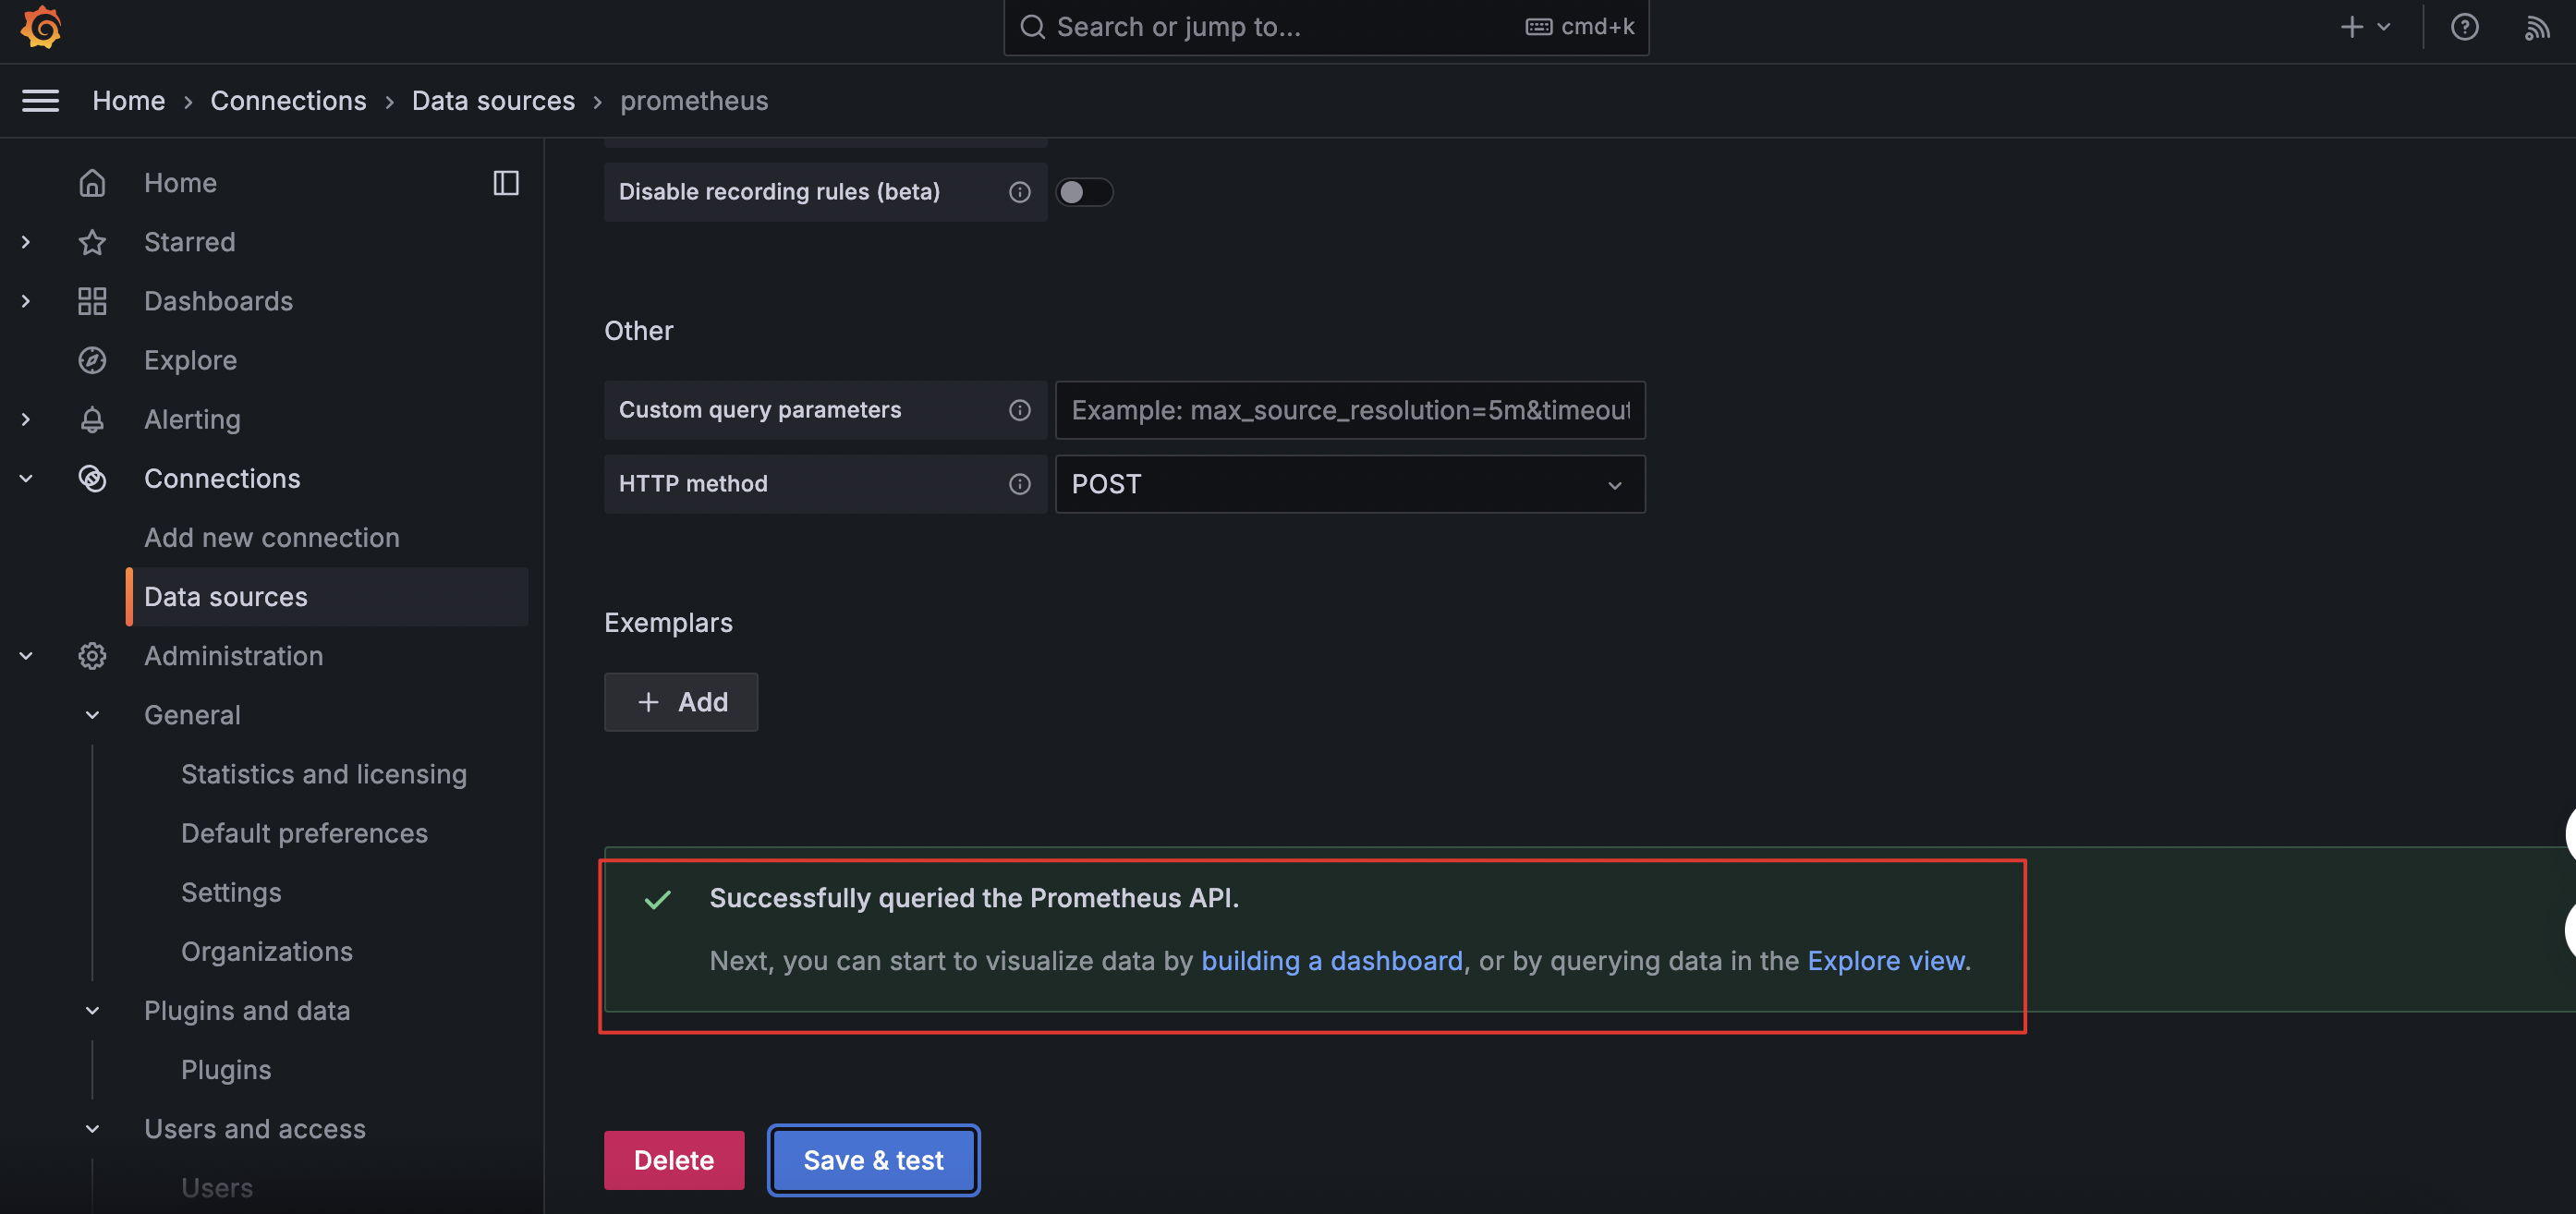
出现如下提示说明配置成功
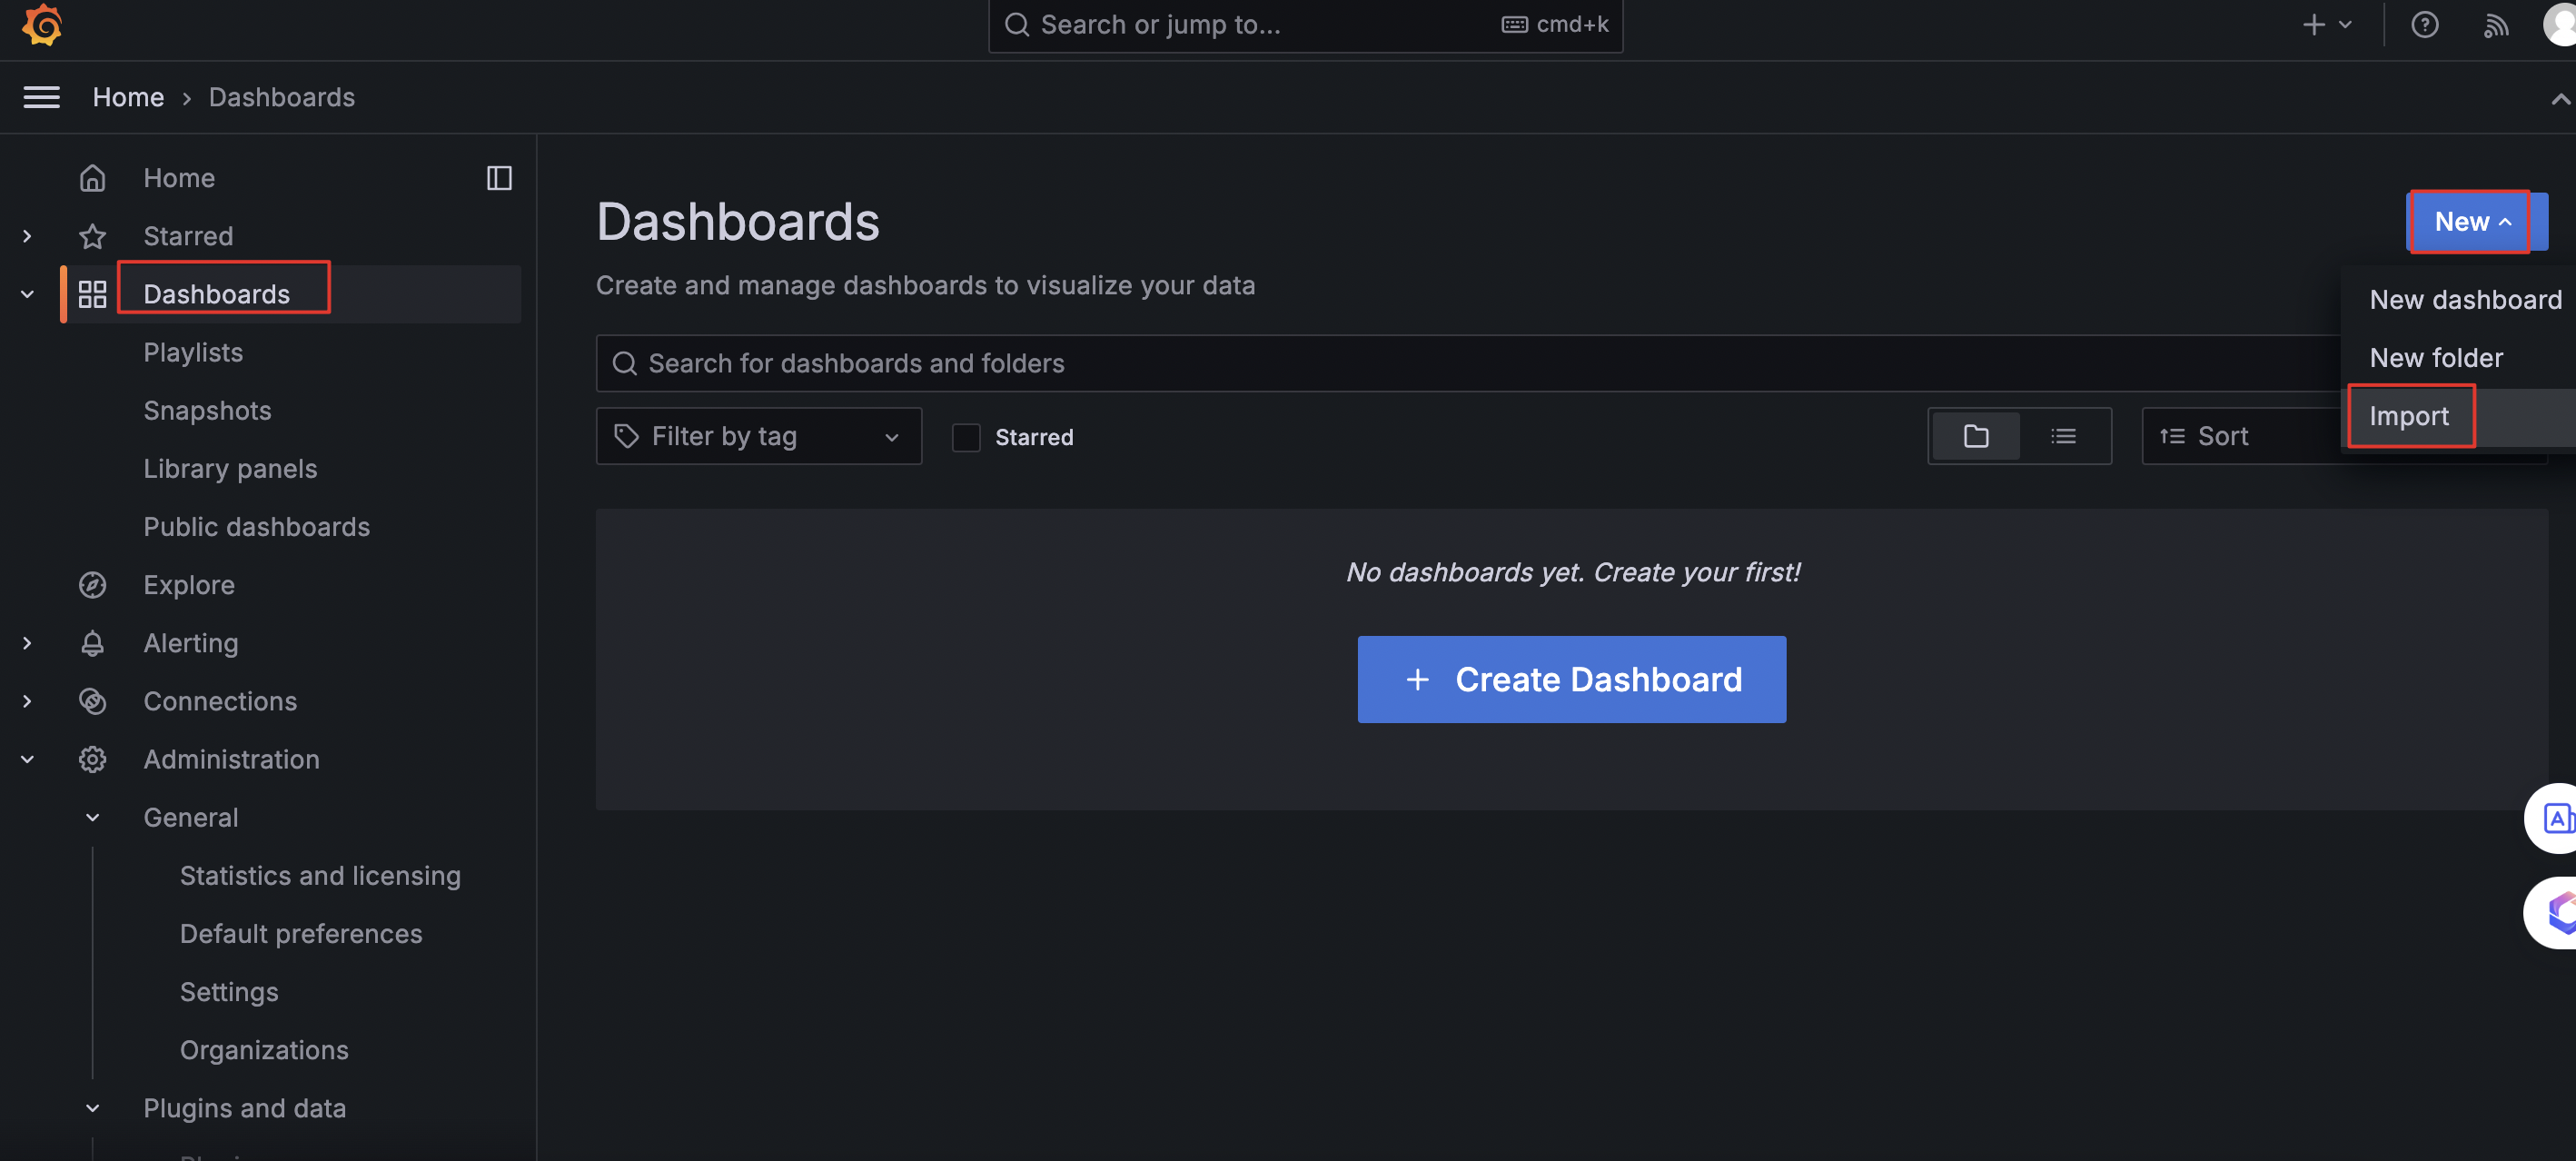
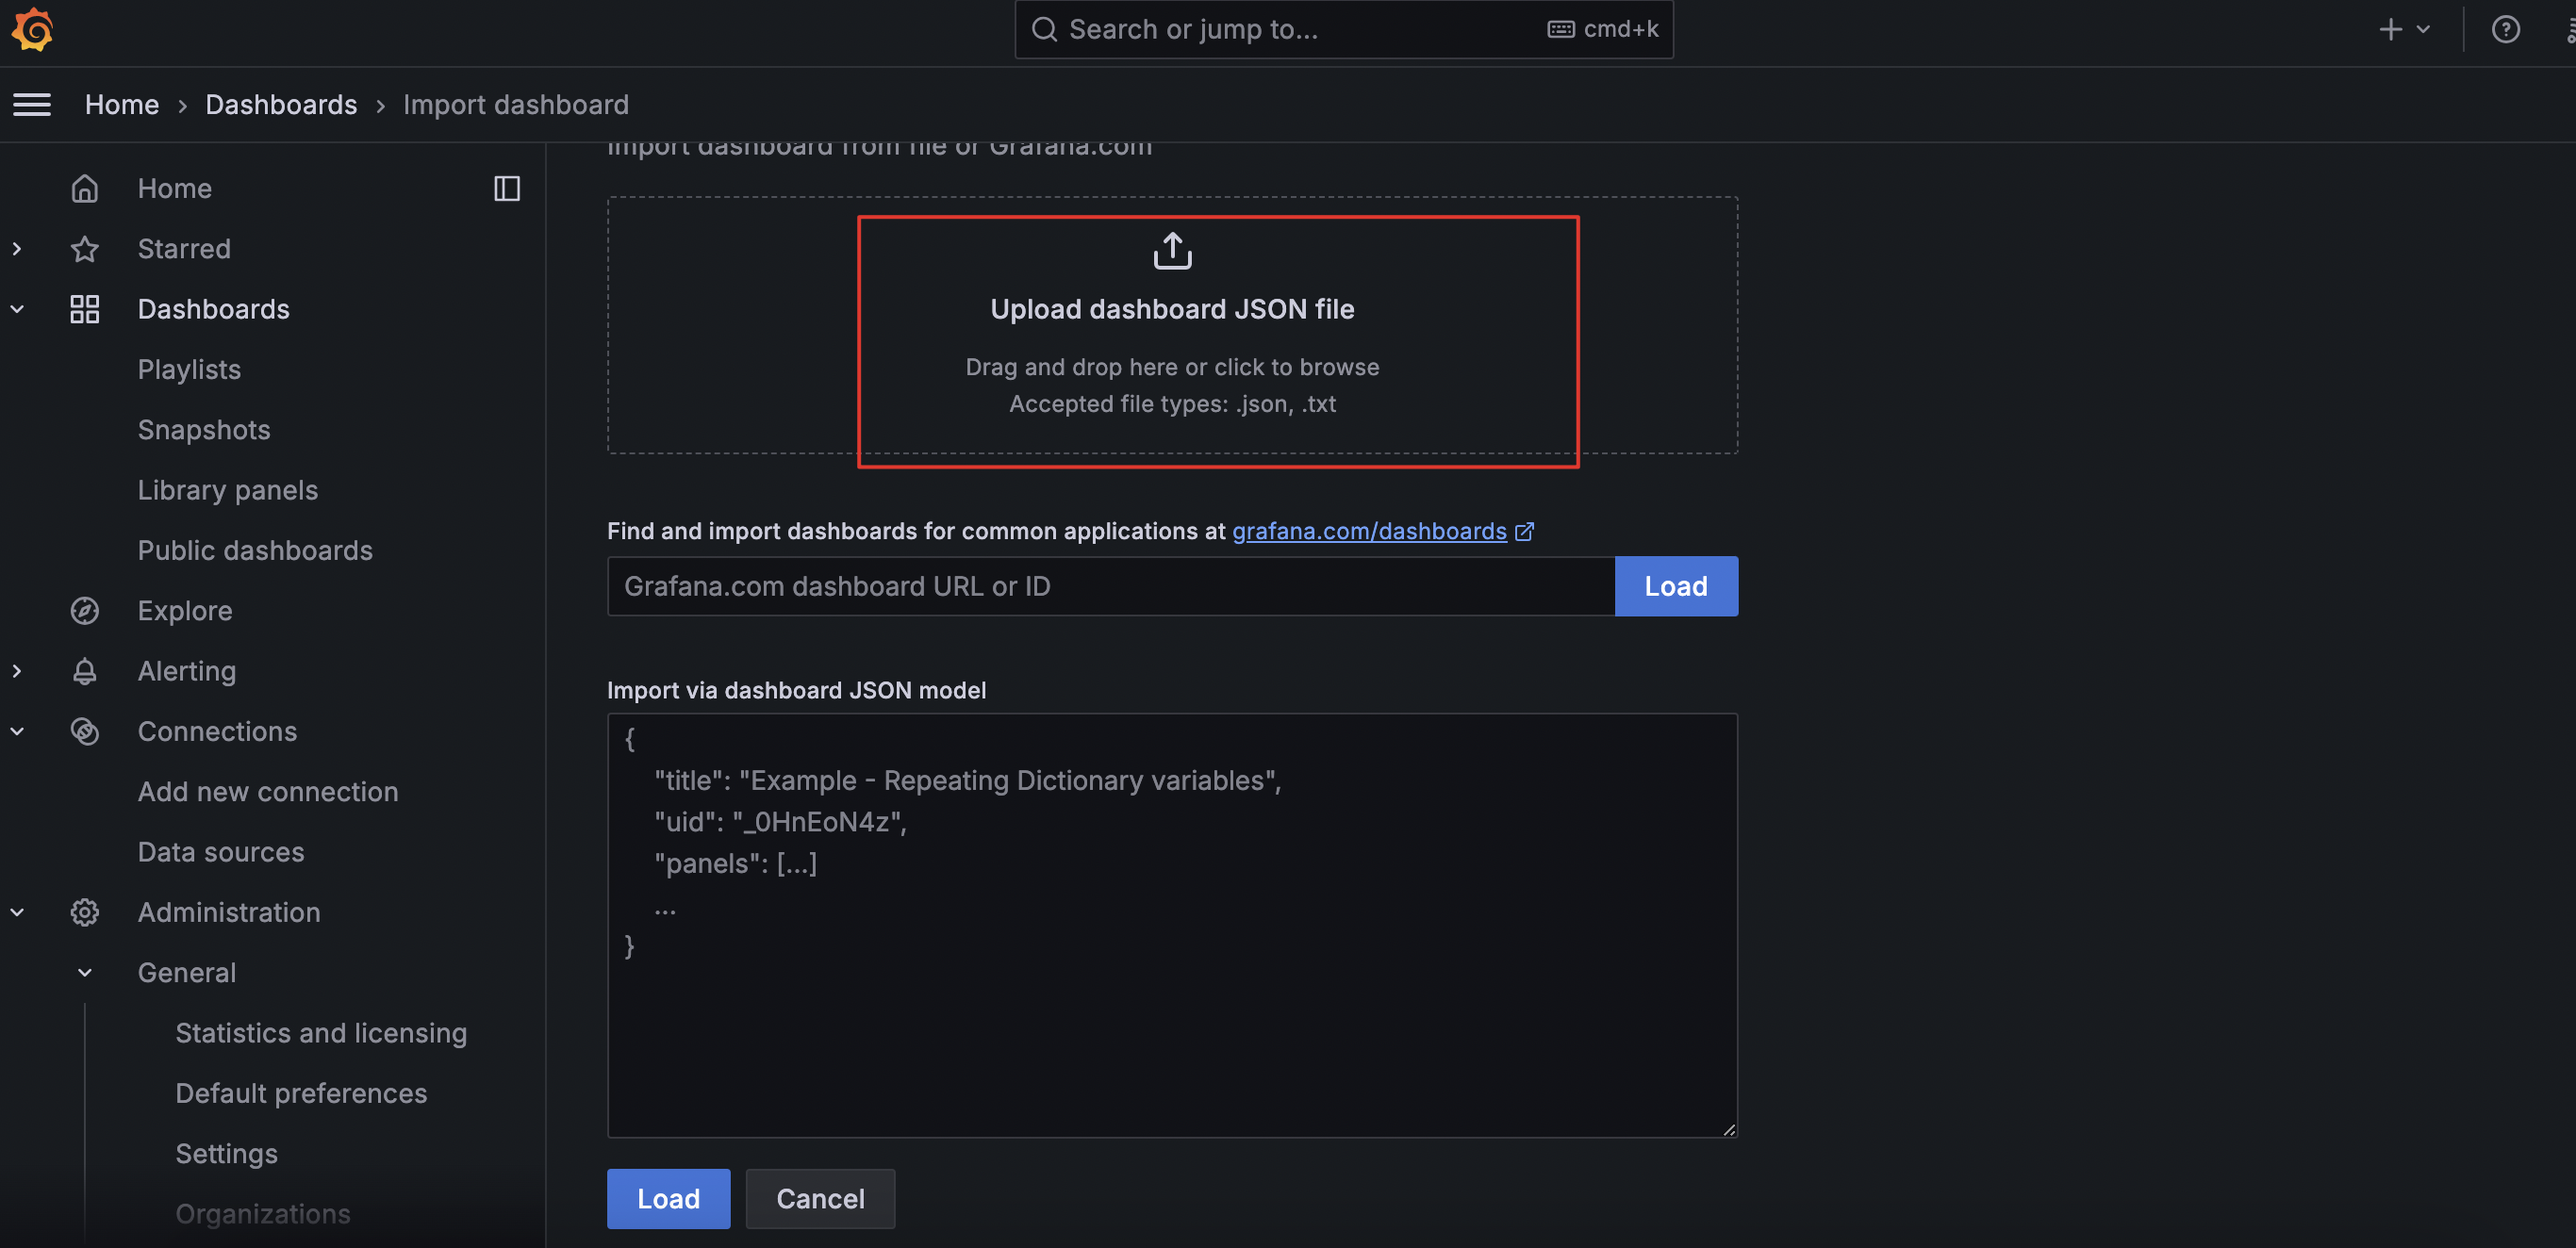
2、配置 dashboard
选择左侧菜单的 Dashboard --> new --> import
选择解压文件中的11074_rev9_cpu.json 导进去

选择默认的数据源,确认,出现面板后说明配置成功

六 、监控多台机器时
①在prometheus.yml 中添加如下配置: job名称 job_name 和 targets
监控的服务器中需安装并启动node_exporter-1.7.0.linux-amd64.tar.gz

 浙公网安备 33010602011771号