第八次作业
聚类--K均值算法:自主实现与sklearn.cluster.KMeans调用
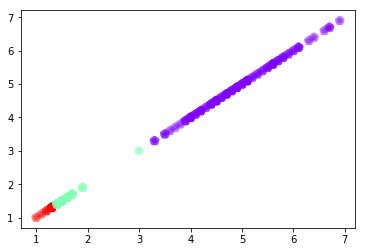
用python实现K均值算法,鸢尾花花瓣长度数据做聚类并用散点图显示。
代码:
import numpy as np

#随机生成一个数组
x = np.random.randint(1,100,[20,1])
y = np.zeros(x.shape[0],dtype=int)
k = 3
iris_length = [1.4, 1.4, 1.3, 1.5, 1.4, 1.7, 1.4, 1.5, 1.4, 1.5, 1.5, 1.6, 1.4, 1.1, 1.2, 1.5, 1.3, 1.4, 1.7, 1.5, 1.7, 1.5, 1.0, 1.7, 1.9, 1.6, 1.6, 1.5, 1.4, 1.6, 1.6, 1.5, 1.5, 1.4, 1.5, 1.2, 1.3, 1.4, 1.3, 1.5, 1.3, 1.3, 1.3, 1.6, 1.9, 1.4, 1.6, 1.4, 1.5, 1.4, 4.7, 4.5, 4.9, 4.0, 4.6, 4.5, 4.7, 3.3, 4.6, 3.9, 3.5, 4.2, 4.0, 4.7, 3.6, 4.4, 4.5, 4.1, 4.5, 3.9, 4.8, 4.0, 4.9, 4.7, 4.3, 4.4, 4.8, 5.0, 4.5, 3.5, 3.8, 3.7, 3.9, 5.1, 4.5, 4.5, 4.7, 4.4, 4.1, 4.0, 4.4, 4.6, 4.0, 3.3, 4.2, 4.2, 4.2, 4.3, 3.0, 4.1, 6.0, 5.1, 5.9, 5.6, 5.8, 6.6, 4.5, 6.3, 5.8, 6.1, 5.1, 5.3, 5.5, 5.0, 5.1, 5.3, 5.5, 6.7, 6.9, 5.0, 5.7, 4.9, 6.7, 4.9, 5.7, 6.0, 4.8, 4.9, 5.6, 5.8, 6.1, 6.4, 5.6, 5.1, 5.6, 6.1, 5.6, 5.5, 4.8, 5.4, 5.6, 5.1, 5.1, 5.9, 5.7, 5.2, 5.0, 5.2, 5.4, 5.1]

# 选取前k个值作为中心值
def intcenter(myarr,k):
    return x[:k]
kc = intcenter(x,k)

# 计算距离
def nearest(kc, i):
    d = abs(kc - i)
    w = np.where(d == np.min(d))
    return w[0][0]

# 计算样本中每个数据应该为哪个类
def xclassify(x,y,kc):
    for i in range(x.shape[0]):
        y[i] = nearest(kc, x[i])
    return y

# 更新聚类中心
def kcmean(x,y,kc,k):
    l = list(kc)
    flag = False
    for i in range(k):
        part = np.where(y == i)[0]
        if len(np.where(y == i)[0]) == 0:
            newcenter = l[i]
        else:
            newcenter = np.mean(x[part])
        if newcenter != l[i]: # 如果原中心和新中心不相等,就再赋值,并标记
            l[i] = newcenter
            flag = True # 标记
    return np.array(l),flag

# 整合
def k_means(x,k):
    y  = np.zeros(x.shape[0])
    # 选取k个中心
    kc = intcenter(x,k)

    # 每个元素进行分类,重新计算新中心,并判断中心是否发生变化
    flag = True
    while flag:
        y = xclassify(x,y,kc)
        result,flag = kcmean(x,y,kc,k)
    return result

# 不断迭代分类
flag = True
while flag:
    y = xclassify(x,y,kc)
    kc,flag = kcmean(x,y,kc,k)
print(kc,flag)

# 用鸢尾花花瓣作分析
x = np.array(iris_length)
y = np.zeros(x.shape[0])
kc = intcenter(x,3)
flag = True
while flag:
    y = xclassify(x,y,kc)
    kc,flag = kcmean(x,y,kc,3)
print(kc,flag)

# 分析鸢尾花花瓣长度的数据,并用散点图表示出来
import matplotlib.pyplot as plt
plt.scatter(iris_length, iris_length, marker='p', c=y, alpha=0.5, linewidths=4, cmap='rainbow')
plt.show()
截图:
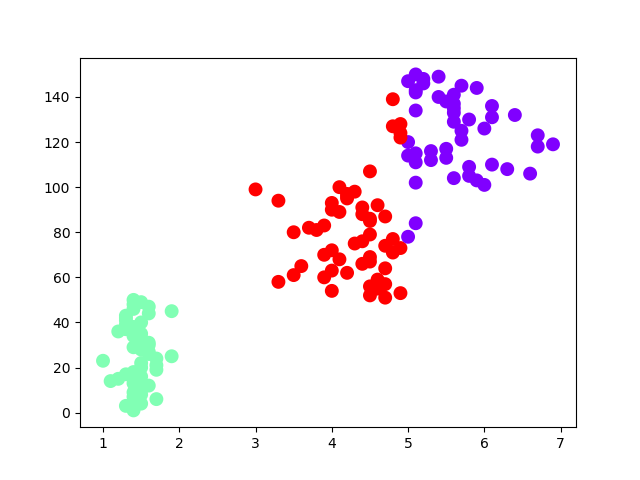
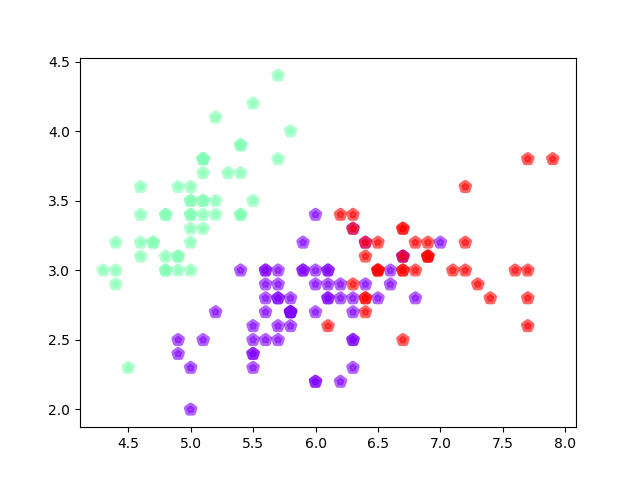
用sklearn.cluster.KMeans,鸢尾花花瓣长度数据做聚类并用散点图显示,鸢尾花完整数据做聚类并用散点图显示。
代码:
import numpy as np
from sklearn.cluster import KMeans
from sklearn.datasets import load_iris
from matplotlib import pyplot

iris_data = load_iris()

# 花瓣长度做聚类
iris_length = iris_data.data[:, 2:3]
x1 = iris_length
k_means1 = KMeans(n_clusters=3)
result1 = k_means1.fit(x1)
kc1 = result1.cluster_centers_
y_kmeans1 = k_means1.predict(x1)
# 画图
pyplot.scatter(x1,np.linspace(1,150,150),c=y_kmeans1,marker='x',cmap='rainbow',linewidths=4)
pyplot.show()

# 完整数据的聚类
x2 = iris_data.data
k_means2 = KMeans(n_clusters=3)
result2 = k_means2.fit(x2)
kc2 = result2.cluster_centers_
y_kmeans2 = k_means2.predict(x2)

print(y_kmeans2, kc2)
print(kc2.shape, y_kmeans2.shape, x2.shape)

pyplot.scatter(x2[:, 0], x2[:, 1], c=y_kmeans2, marker='p', cmap='rainbow', linewidths=4, alpha=0.6)
pyplot.show()
截图:
花瓣长度聚类散点
完整数据聚类散点图:

 浙公网安备 33010602011771号