Jenkins集成源码静态分析工具
1、static code analysis插件说明
Jenkins提供了插件”static code analysis“,该插件搜集不同的分析结果,并集合显示出来。实际上,我们可以认为static code analysi和FindBugs等插件组成了一个静态分析代码的套件。仅仅安装static code analysis是不够的,还需要安装其他插件(如FindBugs),才能正确工作。
2、static code analysis支持哪些插件?
官方文档:https://wiki.jenkins-ci.org/display/JENKINS/Static+Code+Analysis+Plug-ins#StaticCodeAnalysisPlug-ins-summaryJenkins理解好几种"代码静态分析工具"的结果文件(?什么格式的?),并以可视化的形势显示出来。
Jenkins支持对下面列出的静态分析工具插件的”可视化“:
- Checkstyle Plug-in
- DRY Plug-in
- FindBugs Plug-in
- PMD Plug-in
- Compiler Warnings Plug-in
- Task Scanner Plug-in
- CCM Plug-in
- Android Lint Plug-in
- OWASP Dependency-Check Plugin
上述插件的共同特点(可能会有个别遗漏):
- View column that shows the total number of warnings in a job
- Build summary showing the new and fixed warnings of a build
- Several trend reports showing the number of warnings per build
- Several portlets for the Jenkins dashboard view
- Overview of the found warnings per module, package, category, or type
- Detail reports of the found warnings optionally filtered by severity (or new and fixed)
- Colored HTML display of the corresponding source file and warning lines
- Several failure thresholds to mark a build as unstable or failed
- Configurable project health support
- Highscore computation for builds without warnings and successful builds
- Works with the freestyle and native m2 build option of Jenkins
- Email Support to show aggregated results of the warnings in a project
- Remote API to export the build quality and found warnings
- Several tokens to simplify post processing of the analysis results
3、static code analysis依赖哪些插件?
从官方文档了解到,static code analysis依赖:
This plugin adds reusable macro expansion capability for other plugins to use
Jenkins plugin for building Maven 2/3 jobs via a special project type.
This plugin contributes a new view implementation that provides a dashboard / portal-like view for your Jenkins instance.
其中,Maven和Ant一般在Jenkins安装完后,就跟着安装上的,作用是作为Jenkins的构建工具。
本例先把Dashboard View和Token Macro安装了,后续再体验两者的作用。
4、如何使用static code analysis进行代码分析?
1)安装static code analysis插件
以管理员登录到Jenkins。在”系统管理“/”管理插件“,选择”可安装插件“,在”过滤“栏输入”static code analysis“,选择”Static Code Analysis Plug-ins“插件。勾选直接安装。
2)安装其他插件
包括FindBugs、PMD、checkstyle等工具。具体也是通过搜索,在可选里面找到该插件,然后进行安装。
3)在Jenkins里面配置job使用maven
示例1:使用maven进行构建,maven内部调用ant。
cpds项目已经有了一个ant脚本,能够实现系统测试。因此使用maven的话,需要支持调用ant。不过也幸好maven支持调用ant。
所以maven构建包括两部分:一是调用ant,ant完成编译等工作;二是maven调用FindBugs等插件完成静态代码分析工作。
示例2:先执行maven,再执行ant。
类似示例1,不过maven和ant是平等关系,没有包含调用的情况。
5、示例
5.1for java
5.1.1非maven工程
对于非maven的java工程,例如普通的Eclipse工程,建议使用ant进行编译,然后使用maven进行代码分析(?)
当然也可以将普通工程转化为maven工程,但是可能比较麻烦。
方法:ant+findbugs分析代码。
代码清单:
5.1.2 maven工程
1)jenkins中使用static code analysis + findbugs进行代码分析
前提:按照前几章的说明,需要在jenkins安装static code analysis,findbugs插件。
一、编辑pom
首先,添加工程依赖和构建需要的插件,包括工程本身的依赖和构建需要的工具。
由于准备执行“mvn compile findbugs:findbugs site”命令,所以必须包含resources、compiler等maven插件。而如果需要打包(jar)、单元测试,则需要添加对jar、surefire、assembly等插件的依赖。
代码清单1:pom.xml的部分内容
<build><plugins><plugin><groupId>org.apache.maven.plugins</groupId><artifactId>maven-resources-plugin</artifactId><version>2.6</version></plugin><plugin><groupId>org.apache.maven.plugins</groupId><artifactId>maven-compiler-plugin</artifactId><configuration><source>1.5</source><target>1.5</target></configuration></plugin><plugin><groupId>org.apache.maven.plugins</groupId><artifactId>maven-jar-plugin</artifactId><configuration><archive><manifest><mainClass>org.sonatype.mavenbook.weather.Main</mainClass><addClasspath>true</addClasspath></manifest></archive></configuration></plugin><plugin><groupId>org.apache.maven.plugins</groupId><artifactId>maven-surefire-plugin</artifactId><configuration><testFailureIgnore>true</testFailureIgnore></configuration></plugin><plugin><artifactId>maven-assembly-plugin</artifactId><configuration><archive><manifest><mainClass>org.sonatype.mavenbook.weather.Main</mainClass></manifest></archive><descriptorRefs><descriptorRef>jar-with-dependencies</descriptorRef></descriptorRefs></configuration></plugin></plugins></build>
其次,需要在maven工程的pom.xml进行设置:在reporting节点中添加findbugs-maven-plugin的说明。
代码清单2:中findbugs-maven-plugin的说明
<reporting><plugins><!--FindBugs插件。maven goal:findbugs:findbugs --><plugin><groupId>org.codehaus.mojo</groupId><artifactId>findbugs-maven-plugin</artifactId><version>2.5.1</version><configuration><threshold>High</threshold><effort>Default</effort><findbugsXmlOutput>true</findbugsXmlOutput><findbugsXmlWithMessages>true</findbugsXmlWithMessages><xmlOutput>true</xmlOutput><formats><format>html</format></formats></configuration></plugin></plugins></reporting>
二、配置Jenkins job
根据经验,在jenkins中使用maven风格的job构建maven工程时,可能会出现问题。所以,建议创建freestyle风格的工程。
Maven的目标(goals)设置为:compile findbugs:findbugs site。
由于findbugs基于.class进行分析,所以先需要对代码进行编译,即执行compile。执行findbugs:findbugs表示使用findbugs对字节码文件进行代码分析。site则是生成相应的网页内容。
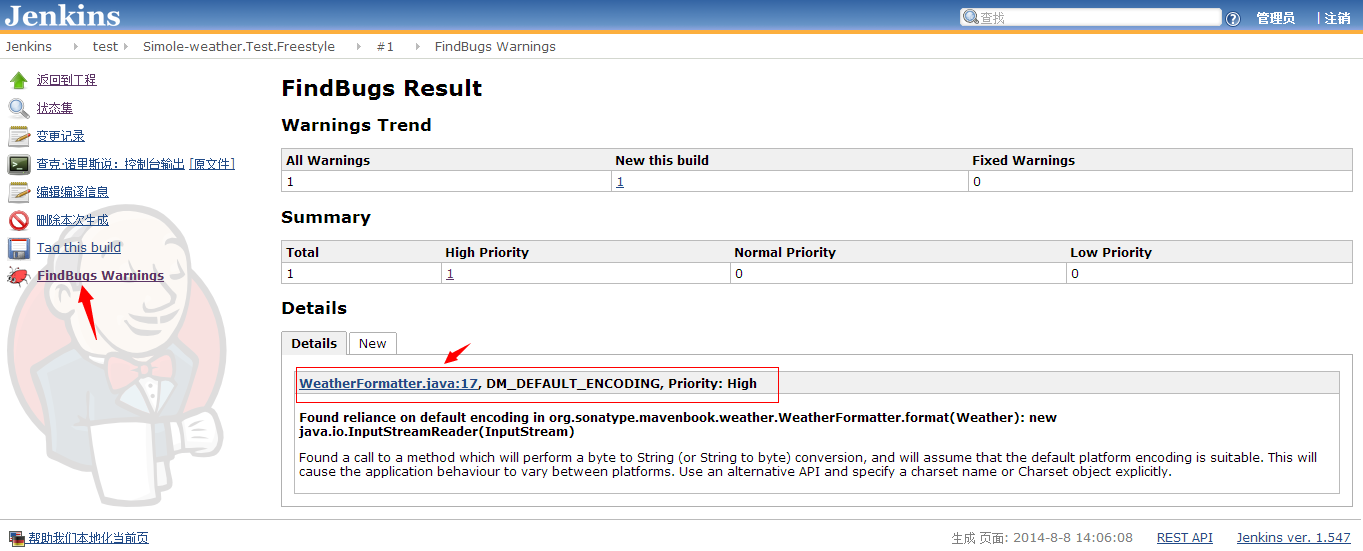
三、执行构建
构建完成后,jenkins显示结果如下:
2)jenkins中使用static code analysis + PMD进行代码分析
与配置FindBugs插件类似,仍旧是在pom中添加PMD的maven插件(maven-pmd-plugin)。
代码清单3:pom中配置PMD
<!--PMD报告设置 --><plugin><groupId>org.apache.maven.plugins</groupId><artifactId>maven-pmd-plugin</artifactId><version>3.2</version><configuration><rulesets><!-- Two rule sets that come bundled with PMD --><ruleset>/rulesets/java/braces.xml</ruleset><ruleset>/rulesets/java/naming.xml</ruleset><!-- Custom local file system rule set --><!-- ruleset>d:\rulesets\strings.xml</ruleset--><!-- Custom remote rule set accessed via a URL --><!-- ruleset>http://localhost/design.xml</ruleset--></rulesets></configuration></plugin>
完成构建后,pmd for jenkins插件在左侧视图自动添加按钮,如下:
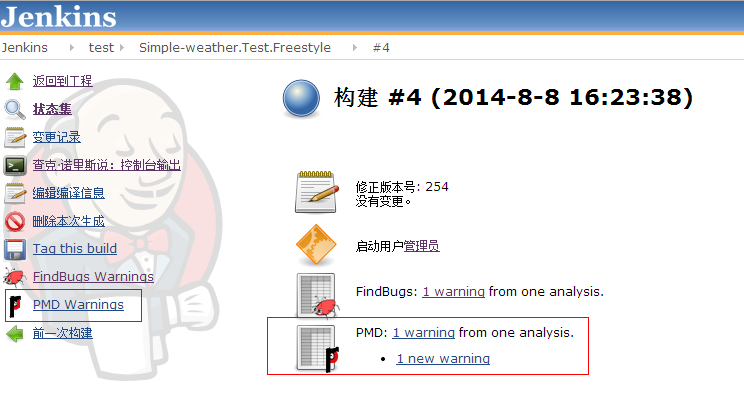
点击bug链接,如“1 warning”可查看详情:

相关问题参考:
Jenkins-FQA:http://www.cnblogs.com/topplay/p/3873456.html

 浙公网安备 33010602011771号